. 2013 Mar 26;13(4):4067-87.
doi: 10.3390/s130404067.

Fabrication quality analysis of a fiber optic refractive index sensor created by CO2 laser machining

Affiliations

Fabrication quality analysis of a fiber optic refractive index sensor created by CO2 laser machining

Chien-Hsing Chen et al. Sensors (Basel). .

Abstract

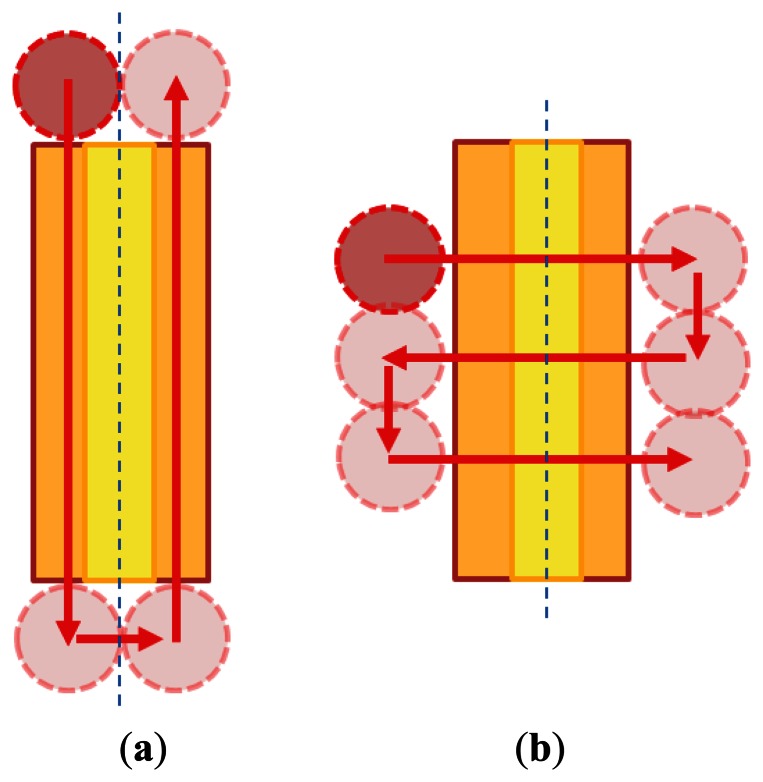
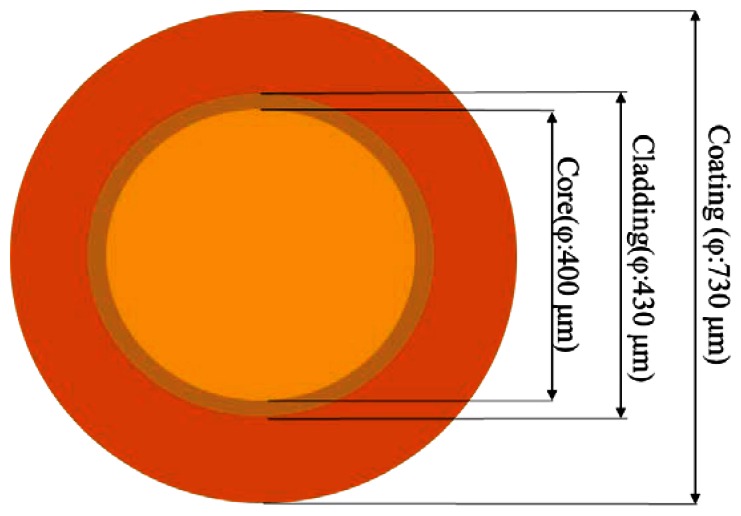
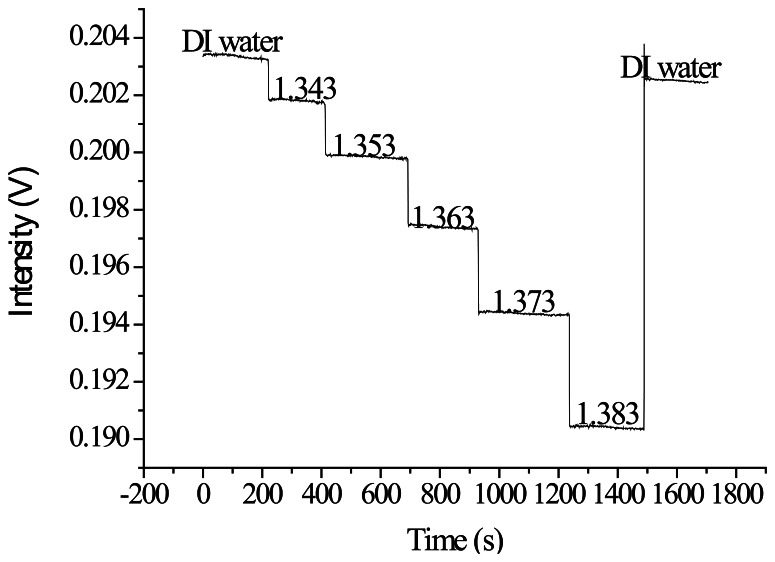
This study investigates the CO2 laser-stripped partial cladding of silica-based optic fibers with a core diameter of 400 μm, which enables them to sense the refractive index of the surrounding environment. However, inappropriate treatments during the machining process can generate a number of defects in the optic fiber sensors. Therefore, the quality of optic fiber sensors fabricated using CO2 laser machining must be analyzed. The results show that analysis of the fiber core size after machining can provide preliminary defect detection, and qualitative analysis of the optical transmission defects can be used to identify imperfections that are difficult to observe through size analysis. To more precisely and quantitatively detect fabrication defects, we included a tensile test and numerical aperture measurements in this study. After a series of quality inspections, we proposed improvements to the existing CO2 laser machining parameters, namely, a vertical scanning pathway, 4 W of power, and a feed rate of 9.45 cm/s. Using these improved parameters, we created optical fiber sensors with a core diameter of approximately 400 μm, no obvious optical transmission defects, a numerical aperture of 0.52 ± 0.019, a 0.886 Weibull modulus, and a 1.186 Weibull-shaped parameter. Finally, we used the optical fiber sensor fabricated using the improved parameters to measure the refractive indices of various solutions. The results show that a refractive-index resolution of 1.8 × 10(-4) RIU (linear fitting R2 = 0.954) was achieved for sucrose solutions with refractive indices ranging between 1.333 and 1.383. We also adopted the particle plasmon resonance sensing scheme using the fabricated optical fibers. The results provided additional information, specifically, a superior sensor resolution of 5.73 × 10(-5) RIU, and greater linearity at R2 = 0.999.


Figures

Figure 1.
Figure 1.
Schematic of the fiber sensor: (a) crude fiber; and (b) fiber sensors (window type).
Figure 2.
Figure 2.
Schematic of the laser machining fixtures: (a) the processing fix0ture; and (b) the rotating and fixed optical fiber fixture.
Figure 3.
Figure 3.
Schematic of the laser processing path: (a) parallel machining; and (b) vertical machining.
Figure 4.
Figure 4.
Schematic of the optical fiber.
Figure 5.
Figure 5.
Schematic of an optical fiber cable: (a) partially removed; (b) insufficiently removed; and (c) completely removed.
Figure 6.
Figure 6.
Schematic of optical fiber defects: (a) non-uniform changes in property; and (b) uniform changes in property.
Figure 7.
Figure 7.
Schematic of an optical fiber: (a) wavy pattern; and (b) excessive removal.
Figure 8.
Figure 8.
Schematic of the measuring instrument: (a) fiber connecter; (b) measuring fix0ture; (c) processed fiber; and (d) micro-stage.
Figure 9.
Figure 9.
Schematic of the measurement position.
Figure 10.
Figure 10.
Diagram of the components of an optical light transmission defect: (a) laser source; (b) collimator; (c) fiber cable (NA = 0.27); (d) fiber adapter; (e) fiber connecter; and (f) fiber sensor (NA = 0.37).
Figure 11.
Figure 11.
Schematic of the tool used for qualitative analysis of the optical transmission defects: (a) laser source; (b) collimator; (c) fiber cable; (d) fiber adapter; (e) fiber connecter; (f) processed fiber; and (g) micro-stage.
Figure 12.
Figure 12.
Schematic of the numerical aperture measurement instrument.
Figure 13.
Figure 13.
Schematic of the tensile test (Model FS-1002, Lutron Inc., New Taipei, Taiwan): (a) force gauge; (b) measuring fix0ture; (c) translation stage; (d) gauge value display; and (e) processed fiber.
Figure 14.
Figure 14.
Schematic of the experimental setup for creating sensing measurements: (a) function generator (Agilent Inc. Model: 33220A); (b) LED light source (Model: EHP-AX08LS-HA/SUG01-P01, Everlight Inc.); (c) sensing chip; (d) photo diode (Model PD-ET2040, EOT Inc., Traverse, MI, USA); (e) lock-in amplifier (Model 7225, Signal Recovery Inc., Oak Ridge, TN, USA); and (f) computer.
Figure 15.
Figure 15.
Schematic of the size analysis results (Scanning path: parallel).
Figure 16.
Figure 16.
Schematic of the size analysis results (Scanning path: vertical).
Figure 17.
Figure 17.
Schematic of the wavy pattern defect.
Figure 18.
Figure 18.
Schematic of the incomplete removal defect.
Figure 19.
Figure 19.
Schematic without any obvious optical transmission defect.
Figure 20.
Figure 20.
Weibull distribution.
Figure 21.
Figure 21.
Plot of the ATR fiber sensors' temporal responses to injections of increasing sucrose solution concentrations and refractive indices.
Figure 22.
Figure 22.
Plot of the ATR fiber sensor response versus the refractive index of the sucrose solution.
Figure 23.
Figure 23.
Plot of the PPR fiber sensors' temporal response to injections of increasing sucrose solution concentrations and refractive indices.
Figure 24.
Figure 24.
Plot of the PPR fiber sensor response versus the refractive index of the sucrose solution.
Figure 25.
Figure 25.
Plot of the sensor response versus the refractive index of the sucrose solution.

References

    1. Brooks S.L., Ashby R.E., Turner A.P.F., Calder M.R., Clarke D.J. Development of an on-line glucose sensor for fermentation monitoring. Biosensors. 1987;3:45–56.
    1. Lundstrom I., Spetz A., Winquist F., Albery W.J., Thomas J.D.R. Semiconductor biosensors [and Discussion] Philos. Trans. Roy. Soc. Lond. B Biol. Sci. 1987;316:47–60.
    1. Janata J. Principles of Chemical Sensors. Plenum Press; New York, NY, USA: 1989.
    1. Cheng S.-F., Chau L.-K. Colloidal gold-modified optical fiber for chemical and biochemical sensing. Anal. Chem. 2002;75:16–21. - PubMed
    1. Wang J.-N., Tang J.-L. Feasibility of fiber bragg grating and long-period fiber grating sensors under different environmental conditions. Sensors. 2010;10:10105–10127. - PMC - PubMed

LinkOut - more resources