

Identification and molecular characterization of a new ovarian cancer susceptibility locus at 17q21.31
- PMID: 23535648
- PMCID: PMC3709460
- DOI: 10.1038/ncomms2613
Identification and molecular characterization of a new ovarian cancer susceptibility locus at 17q21.31
Abstract
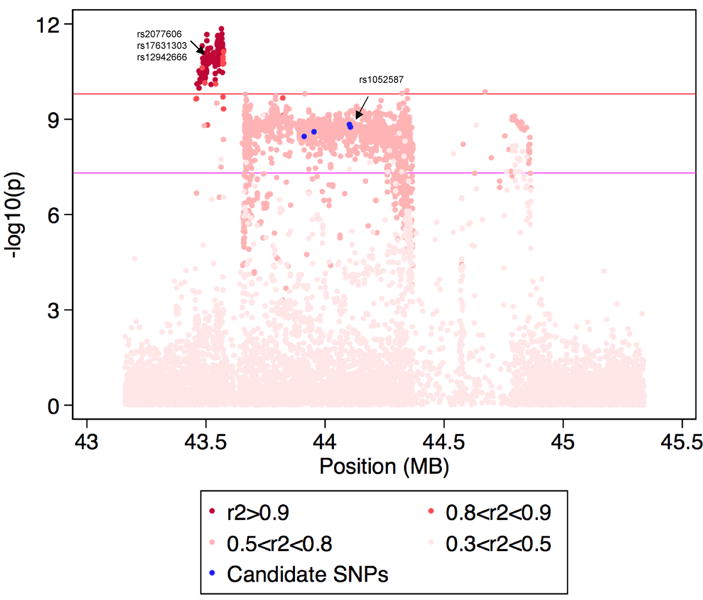
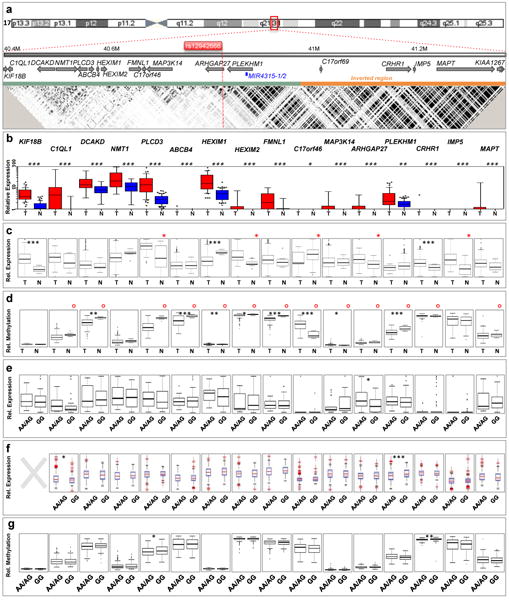
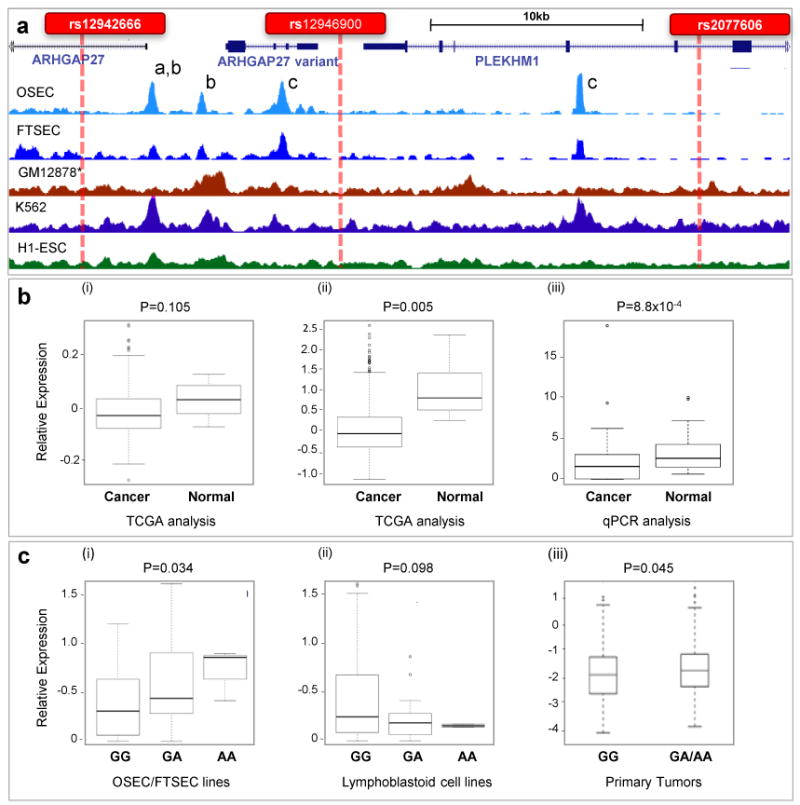
Epithelial ovarian cancer (EOC) has a heritable component that remains to be fully characterized. Most identified common susceptibility variants lie in non-protein-coding sequences. We hypothesized that variants in the 3' untranslated region at putative microRNA (miRNA)-binding sites represent functional targets that influence EOC susceptibility. Here, we evaluate the association between 767 miRNA-related single-nucleotide polymorphisms (miRSNPs) and EOC risk in 18,174 EOC cases and 26,134 controls from 43 studies genotyped through the Collaborative Oncological Gene-environment Study. We identify several miRSNPs associated with invasive serous EOC risk (odds ratio=1.12, P=10(-8)) mapping to an inversion polymorphism at 17q21.31. Additional genotyping of non-miRSNPs at 17q21.31 reveals stronger signals outside the inversion (P=10(-10)). Variation at 17q21.31 is associated with neurological diseases, and our collaboration is the first to report an association with EOC susceptibility. An integrated molecular analysis in this region provides evidence for ARHGAP27 and PLEKHM1 as candidate EOC susceptibility genes.
Figures
References
Publication types
MeSH terms
Grants and funding
- R03-CA115195/CA/NCI NIH HHS/United States
- P50 CA105009/CA/NCI NIH HHS/United States
- R01-CA092044/CA/NCI NIH HHS/United States
- U01 CA069417/CA/NCI NIH HHS/United States
- R01 CA050385/CA/NCI NIH HHS/United States
- R01-CA067262/CA/NCI NIH HHS/United States
- C490/A6187/CRUK_/Cancer Research UK/United Kingdom
- P01-CA017054/CA/NCI NIH HHS/United States
- C536/A13086/CRUK_/Cancer Research UK/United Kingdom
- P30 CA016056/CA/NCI NIH HHS/United States
- R01 CA087538/CA/NCI NIH HHS/United States
- R01 CA136924/CA/NCI NIH HHS/United States
- K07-CA80668/CA/NCI NIH HHS/United States
- K22-CA138563/CA/NCI NIH HHS/United States
- R01 CA067262/CA/NCI NIH HHS/United States
- R01 CA106414/CA/NCI NIH HHS/United States
- 11174/CRUK_/Cancer Research UK/United Kingdom
- C490/A10119/CRUK_/Cancer Research UK/United Kingdom
- C536/A6689/CRUK_/Cancer Research UK/United Kingdom
- N01-CN55424/CN/NCI NIH HHS/United States
- R01-CA054419/CA/NCI NIH HHS/United States
- R37-CA070867/CA/NCI NIH HHS/United States
- R03-CA113148/CA/NCI NIH HHS/United States
- R03 CA113148/CA/NCI NIH HHS/United States
- R01 CA058598/CA/NCI NIH HHS/United States
- R37 CA070867/CA/NCI NIH HHS/United States
- R01-CA112523/CA/NCI NIH HHS/United States
- R01-CA049449/CA/NCI NIH HHS/United States
- R01-CA080742/CA/NCI NIH HHS/United States
- K22 CA138563/CA/NCI NIH HHS/United States
- 11022/CRUK_/Cancer Research UK/United Kingdom
- R01-CA106414/CA/NCI NIH HHS/United States
- R01 CA058860/CA/NCI NIH HHS/United States
- R01 CA080742/CA/NCI NIH HHS/United States
- R01-CA126841/CA/NCI NIH HHS/United States
- R01-CA058598/CA/NCI NIH HHS/United States
- R01 CA074850/CA/NCI NIH HHS/United States
- N01-PC067001/PC/NCI NIH HHS/United States
- MSH-87734/CAPMC/ CIHR/Canada
- R01-CA122443/CA/NCI NIH HHS/United States
- K07 CA092044/CA/NCI NIH HHS/United States
- R01-CA087538/CA/NCI NIH HHS/United States
- R01-CA014089/CA/NCI NIH HHS/United States
- 076113/WT_/Wellcome Trust/United Kingdom
- R01-CA074850/CA/NCI NIH HHS/United States
- C490/A10124/CRUK_/Cancer Research UK/United Kingdom
- P30 CA008748/CA/NCI NIH HHS/United States
- R01 CA128978/CA/NCI NIH HHS/United States
- R01-CA061132/CA/NCI NIH HHS/United States
- R01-CA064277/CA/NCI NIH HHS/United States
- P30 CA076292/CA/NCI NIH HHS/United States
- R01 CA064277/CA/NCI NIH HHS/United States
- R01-CA050385/CA/NCI NIH HHS/United States
- P30 CA014089/CA/NCI NIH HHS/United States
- M01-RR000056/RR/NCRR NIH HHS/United States
- MOP-86727/CAPMC/ CIHR/Canada
- P50-CA105009/CA/NCI NIH HHS/United States
- R01 CA083918/CA/NCI NIH HHS/United States
- U01-CA069417/CA/NCI NIH HHS/United States
- R01-CA136924/CA/NCI NIH HHS/United States
- R01-CA-114343/CA/NCI NIH HHS/United States
- R01-CA063678/CA/NCI NIH HHS/United States
- R01-CA83918/CA/NCI NIH HHS/United States
- R01-CA114343-S1/CA/NCI NIH HHS/United States
- R03 CA115195/CA/NCI NIH HHS/United States
- U01-CA071966/CA/NCI NIH HHS/United States
- R01-CA017054/CA/NCI NIH HHS/United States
- R01 CA054419/CA/NCI NIH HHS/United States
- R01 CA122443/CA/NCI NIH HHS/United States
- P30 CA015083/CA/NCI NIH HHS/United States
- R01-CA016056/CA/NCI NIH HHS/United States
- R01 CA076016/CA/NCI NIH HHS/United States
- ImNIH/Intramural NIH HHS/United States
- K07 CA143047/CA/NCI NIH HHS/United States
- K07-CA143047/CA/NCI NIH HHS/United States
- R01 CA087696/CA/NCI NIH HHS/United States
- R01-CA149429/CA/NCI NIH HHS/United States
- N01-CN25403/CN/NCI NIH HHS/United States
- U19 CA148112/CA/NCI NIH HHS/United States
- R01 CA149429/CA/NCI NIH HHS/United States
- R01-CA071766/CA/NCI NIH HHS/United States
- P01 CA017054/CA/NCI NIH HHS/United States
- P01-CA087696/CA/NCI NIH HHS/United States
- 13086/CRUK_/Cancer Research UK/United Kingdom
- N01 CN025403/CA/NCI NIH HHS/United States
- WT_/Wellcome Trust/United Kingdom
- R01-CA114343/CA/NCI NIH HHS/United States
- R01 CA049449/CA/NCI NIH HHS/United States
- R01-CA076016/CA/NCI NIH HHS/United States
- U19-CA148112/CA/NCI NIH HHS/United States
- K07-CA095666/CA/NCI NIH HHS/United States
- R01 CA063682/CA/NCI NIH HHS/United States
- R01-CA061107/CA/NCI NIH HHS/United States
- P50-CA136393/CA/NCI NIH HHS/United States
- K07 CA095666/CA/NCI NIH HHS/United States
- 10118/CRUK_/Cancer Research UK/United Kingdom
- R01 CA112523/CA/NCI NIH HHS/United States
- P50 CA136393/CA/NCI NIH HHS/United States
- N01-PC035137/PC/NCI NIH HHS/United States
- P30 CA071789/CA/NCI NIH HHS/United States
- R01 CA126841/CA/NCI NIH HHS/United States
- 15960/CRUK_/Cancer Research UK/United Kingdom
- P30-CA15083/CA/NCI NIH HHS/United States
- R01 CA114343/CA/NCI NIH HHS/United States
- R01-CA058860/CA/NCI NIH HHS/United States
- R01-CA080978/CA/NCI NIH HHS/United States
- 16561/CRUK_/Cancer Research UK/United Kingdom
- 10124/CRUK_/Cancer Research UK/United Kingdom
- N01 PC035137/PC/NCI NIH HHS/United States
LinkOut - more resources
Full Text Sources
Other Literature Sources
Medical
