

Epigenetic analysis leads to identification of HNF1B as a subtype-specific susceptibility gene for ovarian cancer
- PMID: 23535649
- PMCID: PMC3848248
- DOI: 10.1038/ncomms2629
Epigenetic analysis leads to identification of HNF1B as a subtype-specific susceptibility gene for ovarian cancer
Abstract
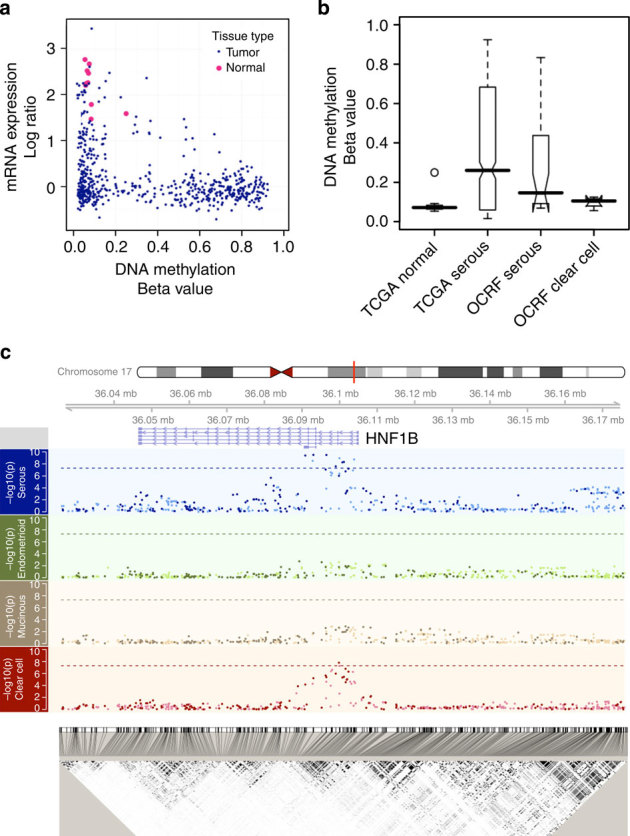
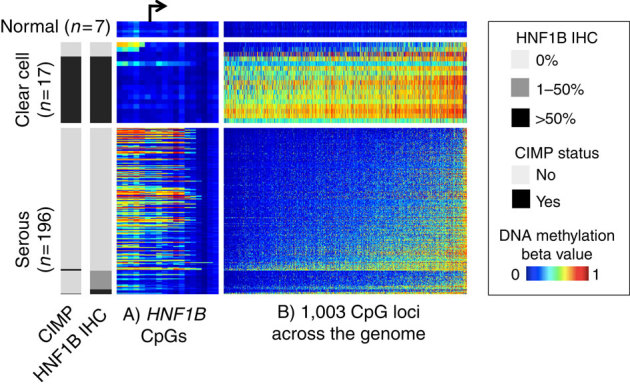
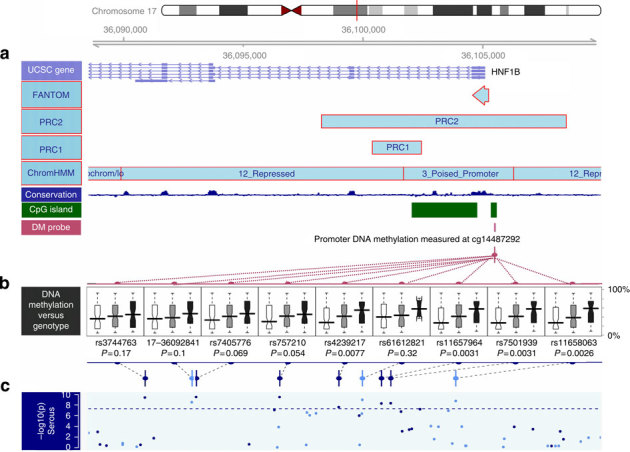
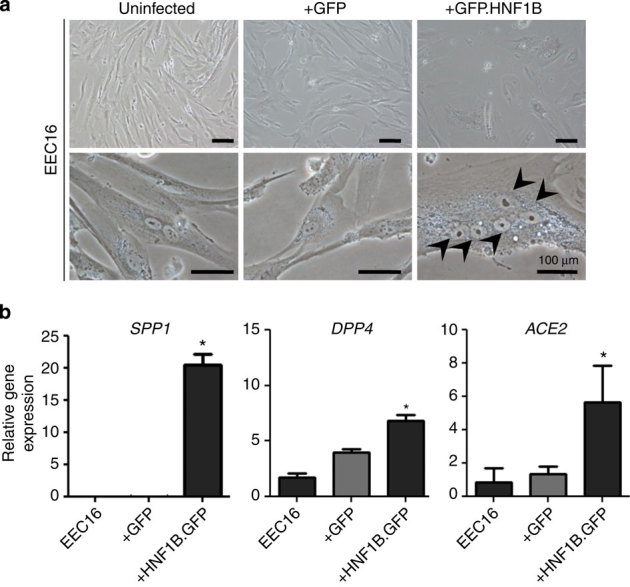
HNF1B is overexpressed in clear cell epithelial ovarian cancer, and we observed epigenetic silencing in serous epithelial ovarian cancer, leading us to hypothesize that variation in this gene differentially associates with epithelial ovarian cancer risk according to histological subtype. Here we comprehensively map variation in HNF1B with respect to epithelial ovarian cancer risk and analyse DNA methylation and expression profiles across histological subtypes. Different single-nucleotide polymorphisms associate with invasive serous (rs7405776 odds ratio (OR)=1.13, P=3.1 × 10(-10)) and clear cell (rs11651755 OR=0.77, P=1.6 × 10(-8)) epithelial ovarian cancer. Risk alleles for the serous subtype associate with higher HNF1B-promoter methylation in these tumours. Unmethylated, expressed HNF1B, primarily present in clear cell tumours, coincides with a CpG island methylator phenotype affecting numerous other promoters throughout the genome. Different variants in HNF1B associate with risk of serous and clear cell epithelial ovarian cancer; DNA methylation and expression patterns are also notably distinct between these subtypes. These findings underscore distinct mechanisms driving different epithelial ovarian cancer histological subtypes.
Conflict of interest statement
The authors declare no competing financial interests.
Figures
References
Publication types
MeSH terms
Substances
Grants and funding
- R03-CA115195/CA/NCI NIH HHS/United States
- G0401527/MRC_/Medical Research Council/United Kingdom
- R01-CA092044/CA/NCI NIH HHS/United States
- U01 CA069417/CA/NCI NIH HHS/United States
- R01 CA050385/CA/NCI NIH HHS/United States
- R25 CA092049/CA/NCI NIH HHS/United States
- U24 CA143882/CA/NCI NIH HHS/United States
- R01-CA067262/CA/NCI NIH HHS/United States
- C490/A6187/CRUK_/Cancer Research UK/United Kingdom
- P01-CA017054/CA/NCI NIH HHS/United States
- C536/A13086/CRUK_/Cancer Research UK/United Kingdom
- P30 CA016056/CA/NCI NIH HHS/United States
- R01 CA096958/CA/NCI NIH HHS/United States
- R01 CA087538/CA/NCI NIH HHS/United States
- R01-CA141154/CA/NCI NIH HHS/United States
- K07-CA80668/CA/NCI NIH HHS/United States
- K22-CA138563/CA/NCI NIH HHS/United States
- R01 CA067262/CA/NCI NIH HHS/United States
- R01 CA106414/CA/NCI NIH HHS/United States
- M01 RR000056/RR/NCRR NIH HHS/United States
- C490/A10119/CRUK_/Cancer Research UK/United Kingdom
- C536/A6689/CRUK_/Cancer Research UK/United Kingdom
- N01-CN55424/CN/NCI NIH HHS/United States
- R01-CA054419/CA/NCI NIH HHS/United States
- R37-CA070867/CA/NCI NIH HHS/United States
- R03-CA113148/CA/NCI NIH HHS/United States
- R03 CA113148/CA/NCI NIH HHS/United States
- R01 CA058598/CA/NCI NIH HHS/United States
- R37 CA070867/CA/NCI NIH HHS/United States
- R01-CA112523/CA/NCI NIH HHS/United States
- R01-CA049449/CA/NCI NIH HHS/United States
- R01-CA080742/CA/NCI NIH HHS/United States
- K22 CA138563/CA/NCI NIH HHS/United States
- 11022/CRUK_/Cancer Research UK/United Kingdom
- R01-CA106414/CA/NCI NIH HHS/United States
- R01CA83918/CA/NCI NIH HHS/United States
- R01 CA058860/CA/NCI NIH HHS/United States
- R01 CA080742/CA/NCI NIH HHS/United States
- R01-CA126841/CA/NCI NIH HHS/United States
- R01-CA058598/CA/NCI NIH HHS/United States
- G1000143/MRC_/Medical Research Council/United Kingdom
- R01 CA074850/CA/NCI NIH HHS/United States
- N01-PC067001/PC/NCI NIH HHS/United States
- MSH-87734/CAPMC/ CIHR/Canada
- R01-CA122443/CA/NCI NIH HHS/United States
- K07 CA092044/CA/NCI NIH HHS/United States
- R01-CA087538/CA/NCI NIH HHS/United States
- R01-CA014089/CA/NCI NIH HHS/United States
- 076113/WT_/Wellcome Trust/United Kingdom
- P50 CA105009/CA/NCI NIH HHS/United States
- N01 PC035137/CA/NCI NIH HHS/United States
- K07 CA080668/CA/NCI NIH HHS/United States
- R01-CA074850/CA/NCI NIH HHS/United States
- R01 CA141154/CA/NCI NIH HHS/United States
- C490/A10124/CRUK_/Cancer Research UK/United Kingdom
- P30 CA008748/CA/NCI NIH HHS/United States
- R01-CA061132/CA/NCI NIH HHS/United States
- R01-CA064277/CA/NCI NIH HHS/United States
- R01 CA064277/CA/NCI NIH HHS/United States
- R01-CA050385/CA/NCI NIH HHS/United States
- P30 CA014089/CA/NCI NIH HHS/United States
- M01-RR000056/RR/NCRR NIH HHS/United States
- 14136/CRUK_/Cancer Research UK/United Kingdom
- MOP-86727/CAPMC/ CIHR/Canada
- P50-CA105009/CA/NCI NIH HHS/United States
- U01-CA069417/CA/NCI NIH HHS/United States
- R01 CA083918/CA/NCI NIH HHS/United States
- R03 CA115195/CA/NCI NIH HHS/United States
- U01-CA071966/CA/NCI NIH HHS/United States
- R01-CA017054/CA/NCI NIH HHS/United States
- R01 CA054419/CA/NCI NIH HHS/United States
- R01 CA122443/CA/NCI NIH HHS/United States
- P30 CA015083/CA/NCI NIH HHS/United States
- R01-CA016056/CA/NCI NIH HHS/United States
- R01 CA076016/CA/NCI NIH HHS/United States
- ImNIH/Intramural NIH HHS/United States
- K07 CA143047/CA/NCI NIH HHS/United States
- K07-CA143047/CA/NCI NIH HHS/United States
- R01 CA087696/CA/NCI NIH HHS/United States
- R01-CA149429/CA/NCI NIH HHS/United States
- N01-CN25403/CN/NCI NIH HHS/United States
- U19 CA148112/CA/NCI NIH HHS/United States
- R01 CA149429/CA/NCI NIH HHS/United States
- R01-CA071766/CA/NCI NIH HHS/United States
- P01 CA017054/CA/NCI NIH HHS/United States
- P01-CA087696/CA/NCI NIH HHS/United States
- 13086/CRUK_/Cancer Research UK/United Kingdom
- N01 CN025403/CA/NCI NIH HHS/United States
- WT_/Wellcome Trust/United Kingdom
- T32GM067587/GM/NIGMS NIH HHS/United States
- R01-CA114343/CA/NCI NIH HHS/United States
- R01 CA049449/CA/NCI NIH HHS/United States
- R01-CA076016/CA/NCI NIH HHS/United States
- U19-CA148112/CA/NCI NIH HHS/United States
- R37-CA70867/CA/NCI NIH HHS/United States
- K07-CA095666/CA/NCI NIH HHS/United States
- R01 CA063682/CA/NCI NIH HHS/United States
- R01-CA061107/CA/NCI NIH HHS/United States
- P50-CA136393/CA/NCI NIH HHS/United States
- K07 CA095666/CA/NCI NIH HHS/United States
- 10118/CRUK_/Cancer Research UK/United Kingdom
- R01 CA112523/CA/NCI NIH HHS/United States
- P50 CA136393/CA/NCI NIH HHS/United States
- N01-PC035137/PC/NCI NIH HHS/United States
- P30 CA071789/CA/NCI NIH HHS/United States
- R01 CA126841/CA/NCI NIH HHS/United States
- 15960/CRUK_/Cancer Research UK/United Kingdom
- P30-CA15083/CA/NCI NIH HHS/United States
- R01 CA114343/CA/NCI NIH HHS/United States
- R01-CA058860/CA/NCI NIH HHS/United States
- T32 GM067587/GM/NIGMS NIH HHS/United States
- R01-CA080978/CA/NCI NIH HHS/United States
- 16561/CRUK_/Cancer Research UK/United Kingdom
- 10124/CRUK_/Cancer Research UK/United Kingdom
LinkOut - more resources
Full Text Sources
Other Literature Sources
Medical
Molecular Biology Databases
Research Materials
