. 2013 Apr;45(4):362-70, 370e1-2.
doi: 10.1038/ng.2564.

GWAS meta-analysis and replication identifies three new susceptibility loci for ovarian cancer

Paul D P Pharoah  1 Ya-Yu TsaiSusan J RamusCatherine M PhelanEllen L GoodeKate LawrensonMelissa BuckleyBrooke L FridleyJonathan P TyrerHoward ShenRachel WeberRod KarevanMelissa C LarsonHonglin SongDaniel C TessierFrançois BacotDaniel VincentJulie M CunninghamJoe DennisEd DicksAustralian Cancer StudyAustralian Ovarian Cancer Study GroupKatja K AbenHoda Anton-CulverNatalia AntonenkovaSebastian M ArmasuLaura BagliettoElisa V BanderaMatthias W BeckmannMichael J BirrerGreg BloomNatalia BogdanovaJames D BrentonLouise A BrintonAngela Brooks-WilsonRobert BrownRalf ButzowIan CampbellMichael E CarneyRenato S CarvalhoJenny Chang-ClaudeY Anne ChenZhihua ChenWong-Ho ChowMine S CicekGerhard CoetzeeLinda S CookDaniel W CramerCezary CybulskiAgnieszka Dansonka-MieszkowskaEvelyn DespierreJennifer A DohertyThilo DörkAndreas du BoisMatthias DürstDiana EcclesRobert EdwardsArif B EkiciPeter A FaschingDavid FenstermacherJames FlanaganYu-Tang GaoMontserrat Garcia-ClosasAleksandra Gentry-MaharajGraham GilesAnxhela GjyshiMartin GoreJacek GronwaldQi GuoMari K HallePhilipp HarterAlexander HeinFlorian HeitzPeter HillemannsMaureen HoatlinEstrid HøgdallClaus K HøgdallSatoyo HosonoAnna JakubowskaAllan JensenKimberly R KalliBeth Y KarlanLinda E KelemenLambertus A KiemeneySusanne Krüger KjaerGottfried E KonecnyCamilla KrakstadJolanta KupryjanczykDiether LambrechtsSandrina LambrechtsNhu D LeNathan LeeJanet LeeArto LeminenBoon Kiong LimJolanta LissowskaJan LubińskiLene LundvallGalina LurieLeon F A G MassugerKeitaro MatsuoValerie McGuireJohn R McLaughlinUsha MenonFrancesmary ModugnoKirsten B MoysichToru NakanishiSteven A NarodRoberta B NessHeli NevanlinnaStefan NickelsHoutan NoushmehrKunle OdunsiSara OlsonIrene OrlowJames PaulTanja PejovicLiisa M PelttariJenny Permuth-WeyMalcolm C PikeElizabeth M PooleXiaotao QuHarvey A RischLorna Rodriguez-RodriguezMary Anne RossingAnja RudolphIngo RunnebaumIwona K RzepeckaHelga B SalvesenIra SchwaabGianluca SeveriHui ShenVijayalakshmi ShridharXiao-Ou ShuWeiva SiehMelissa C SoutheyPaul SpellmanKazuo TajimaSoo-Hwang TeoKathryn L TerryPamela J ThompsonAgnieszka TimorekShelley S TworogerAnne M van AltenaDavid van den BergIgnace VergoteRobert A VierkantAllison F VitonisShan Wang-GohrkeNicolas WentzensenAlice S WhittemoreElisabeth WikBoris WinterhoffYin Ling WooAnna H WuHannah P YangWei ZhengArgyrios ZiogasFamida ZulkifliMarc T GoodmanPer HallDouglas F EastonCeleste L PearceAndrew BerchuckGeorgia Chenevix-TrenchEdwin IversenAlvaro N A MonteiroSimon A GaytherJoellen M SchildkrautThomas A Sellers
Affiliations

GWAS meta-analysis and replication identifies three new susceptibility loci for ovarian cancer

Paul D P Pharoah et al. Nat Genet. 2013 Apr.

Abstract

Genome-wide association studies (GWAS) have identified four susceptibility loci for epithelial ovarian cancer (EOC), with another two suggestive loci reaching near genome-wide significance. We pooled data from a GWAS conducted in North America with another GWAS from the UK. We selected the top 24,551 SNPs for inclusion on the iCOGS custom genotyping array. We performed follow-up genotyping in 18,174 individuals with EOC (cases) and 26,134 controls from 43 studies from the Ovarian Cancer Association Consortium. We validated the two loci at 3q25 and 17q21 that were previously found to have associations close to genome-wide significance and identified three loci newly associated with risk: two loci associated with all EOC subtypes at 8q21 (rs11782652, P = 5.5 × 10(-9)) and 10p12 (rs1243180, P = 1.8 × 10(-8)) and another locus specific to the serous subtype at 17q12 (rs757210, P = 8.1 × 10(-10)). An integrated molecular analysis of genes and regulatory regions at these loci provided evidence for functional mechanisms underlying susceptibility and implicated CHMP4C in the pathogenesis of ovarian cancer.


Figures

Figure 1
Figure 1
Manhattan plot showing association between genotype of 22,076 SNPs and risk of A) all invasive epithelial ovarian cancer and B) serous invasive epithelial ovarian cancer
Figure 2
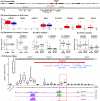
Figure 2. Summary of the functional analyses of the 8q21 locus
(A) Genomic map of a one-megabase region at 8q21 centered on the most statistically significant SNP, rs11782652. The location and size of all nine known protein-coding genes (grey) in the region are shown relative to the location of rs11782652 (red dashed line). (B) Expression analysis for all genes at the 8q21 locus performed in epithelial ovarian cancer (EOC) cell lines (n=50) and normal ovarian surface epithelial cell (OSEC) plus fallopian tube secretory epithelial cell (FTSEC) lines (n=73) illustrating the relative levels expression for each gene in tumor (T) compared to normal (N) cell lines (*p<0.05, ***p<0.001). (C) The ZFAND1 result from cell line studies does not replicate in the TCGA nor the MD Anderson primary tumor expression dataset. However, increased expression of CHMP4C gene in primary, high-grade serous ovarian tumors (T) compared to normal (N) tissues was confirmed in expression data for primary tissues (MD Anderson data). (D) Expression quantitative trait locus (eQTL) analysis: Gene expression is shown relative to the germline genotypes for individuals carrying minor/heterozygous allele (AG/GG) and common alleles (AA) for rs11782652. (i) FABP5 and (ii) CHMP4C show positive eQTL associations in lymphoblastoid cell lines. (iii) A highly significant eQTL association with rs11782652 genotype and CHMP4C expression is also seen in primary tumors (TCGA data). (E) Methylation quantitative trait locus (mQTL) analysis showing methylation status in 277 high grade serous ovarian cancers relative to genotypes for rs11782652. (F) Functional enhancer mapping: A 40kb region was tested for the presence of enhancer regions by transfection of 2kb tiling clones into immortalized OSECs. Activity of the luciferase reporter is shown as fold change in luciferase activity relative to pGL3-BP control. A novel enhancer region in OSECs is indicated by the red box. See Supplementary figure 8i and 9i for additional molecular analysis of all genes at this locus.
Figure 3
Figure 3. Summary of the functional analysis of the 10p12 locus
(A) Genomic map of a one-megabase region at 10p12 centred on the most statistically significant SNP, rs1243180. The location and approximate size of all six known protein-coding genes (grey) and one microRNA (blue) in the region are shown relative to the location of rs1243180 (red dashed line). (B) Expression analysis for all genes at this locus performed in EOC cell lines (T) and normal (N) OSEC and FTSEC lines illustrating the relative expression levels for each gene (** p<0.01, ***p<0.001). (C) eQTL analysis demonstrates significant associations between genotype at rs1243180 and expression of (i) NEBL and (ii) C10orf114 in early passage primary OSEC/FTSEC cultures. (D) (i) A positive eQTL association between C10orf114 genes expression and genotype at rs7098100 (r2=0.86with rs1243180) was also observed in primary high-grade serous ovarian tumors (TCGA). (E) Methylation analysis of 277 high-grade serous ovarian tumors (T) compared to normal ovarian tissues (N) (n=7); methylation at CpG sites near to C10orf114 show significantly less methylation than in normal samples, which may suggest that the increased expression of this gene in tumors is partly due to loss of methylation. (F) Expression versus copy number in TCGA tumors. MLLT10 and NEBL genes show a trend for higher levels of gene expression found in tumors with increased DNA copy number at 10p12; 1 = heterozygous loss; 2 = Diploid; 3 = Copy number gain; 4 = Amplification (G) Formaldehyde assisted isolation of regulatory elements sequencing (FAIRE-seq) performed in normal OSECs and FTSECs, relative to all SNPs correlated with r2≤0.8 to rs1243180. The SNP rs10828247 coincides with a region of open chromatin at the 5′ end of the MLLT10 gene. See Supplementary figure 8ii and 9ii for additional information for all genes at this locus.
Figure 4
Figure 4. Summary of the functional analysis of the 17q locus
(A) Genomic map of a one-megabase region at 17q12 centered on the most statistically significant SNP, rs757210. The location and approximate size of all thirteen known protein-coding genes (grey) in the region are shown relative to the location of rs757210 (red dashed line). (B) Expression analysis for all genes at this locus performed in ovarian tumor (T) cell lines and normal (N) OSEC and FTSEC primary cultures illustrates the relative levels of expression for each gene (** p<0.01, ***p<0.001). (C) Overexpression of HNF1B detected in EOC cells compared to OSECs/FTSECs was largely driven by the high expression of this gene in clear cell EOC cell lines. HNF1B is an established clear cell EOC biomarker (D) Methylation analysis of 277 high-grade serous ovarian tumors (T) compared to normal ovarian tissues (N) (n=7) shows significant hypermethylation of CpG sites upstream of SYNRG and HNF1B in tumors (T) compared to normal (N) tissues. (E) mQTL analysis showing methylation status of SYNRG and HNF1B genes in primary high grade serous ovarian cancers relative to germline genotypes for individuals carrying minor/heterozygous allele (AG/GG) and common alleles (AA) for rs757210. Only methylation at the HNF1B gene shows a significant association with genotype at this locus. See Supplementary figure 8iii and 9iii for additional information for all genes at this locus.

References

    1. Lichtenstein P, et al. Environmental and heritable factors in the causation of cancer-- analyses of cohorts of twins from Sweden, Denmark and Finland. N.Engl.J.Med. 2000;343:78–85. - PubMed
    1. Stratton JF, Pharoah PDP, Smith SK, Easton DF, Ponder BAJ. A systematic review and meta-analysis of family history and risk of ovarian cancer. British Journal of Obstetrics and Gynaecology. 1998;105:493–499. - PubMed
    1. Antoniou AC, Easton DF. Risk prediction models for familial breast cancer. Future Oncol. 2006;2:257–74. - PubMed
    1. Song H, et al. A genome-wide association study identifies a new ovarian cancer susceptibility locus on 9p22.2. Nat.Genet. 2009;41:996–1000. - PMC - PubMed
    1. Bolton KL, et al. Common variants at 19p13 are associated with susceptibility to ovarian cancer. Nat.Genet. 2010;42:880–4. - PMC - PubMed

Publication types