. 2013 Mar 27;33(13):5773-84.
doi: 10.1523/JNEUROSCI.4247-12.2013.

Conditional disruption of calpain in the CNS alters dendrite morphology, impairs LTP, and promotes neuronal survival following injury

Affiliations

Conditional disruption of calpain in the CNS alters dendrite morphology, impairs LTP, and promotes neuronal survival following injury

Mandana Amini et al. J Neurosci. .

Abstract

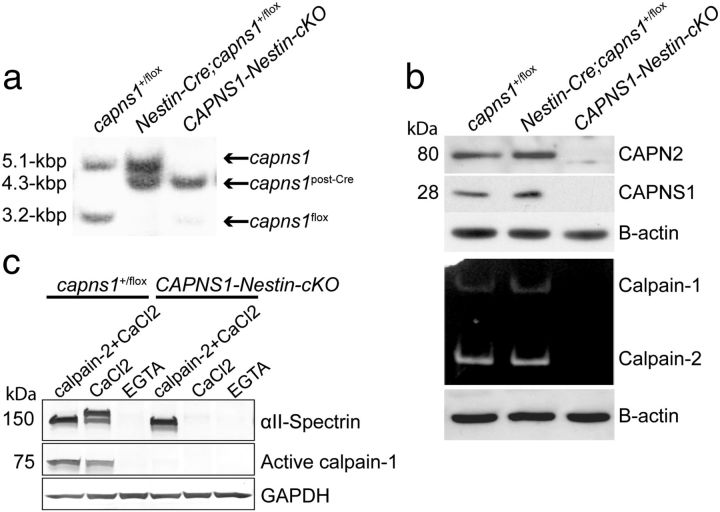
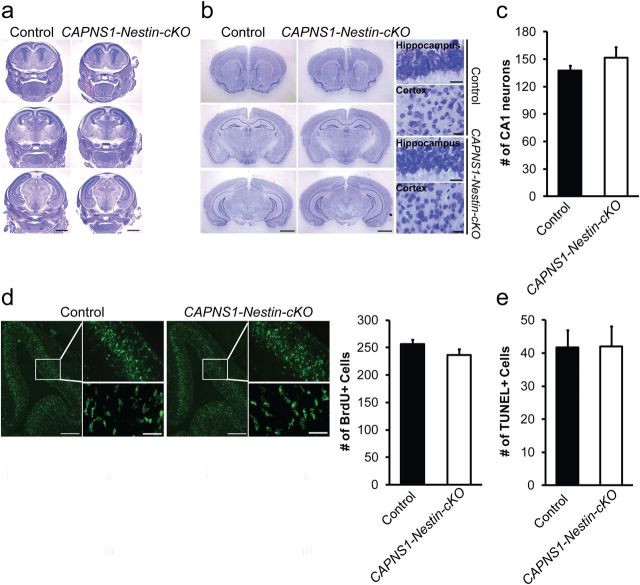
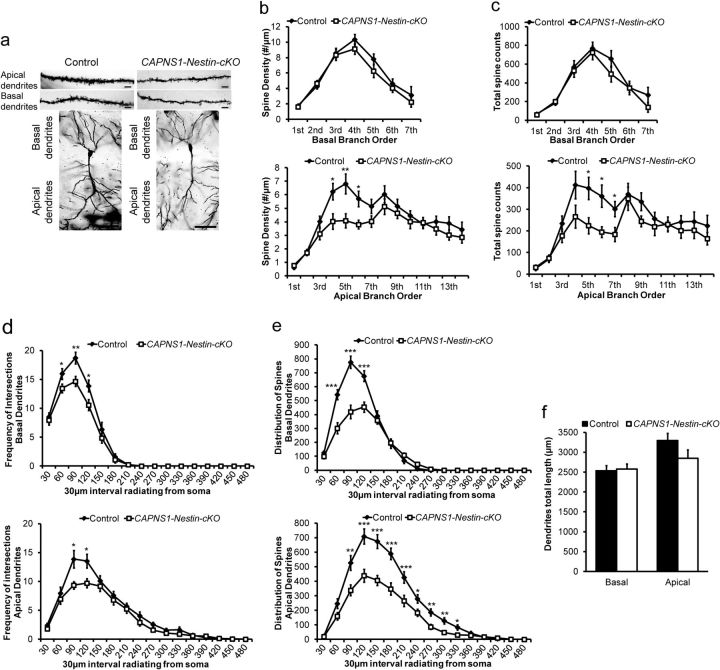
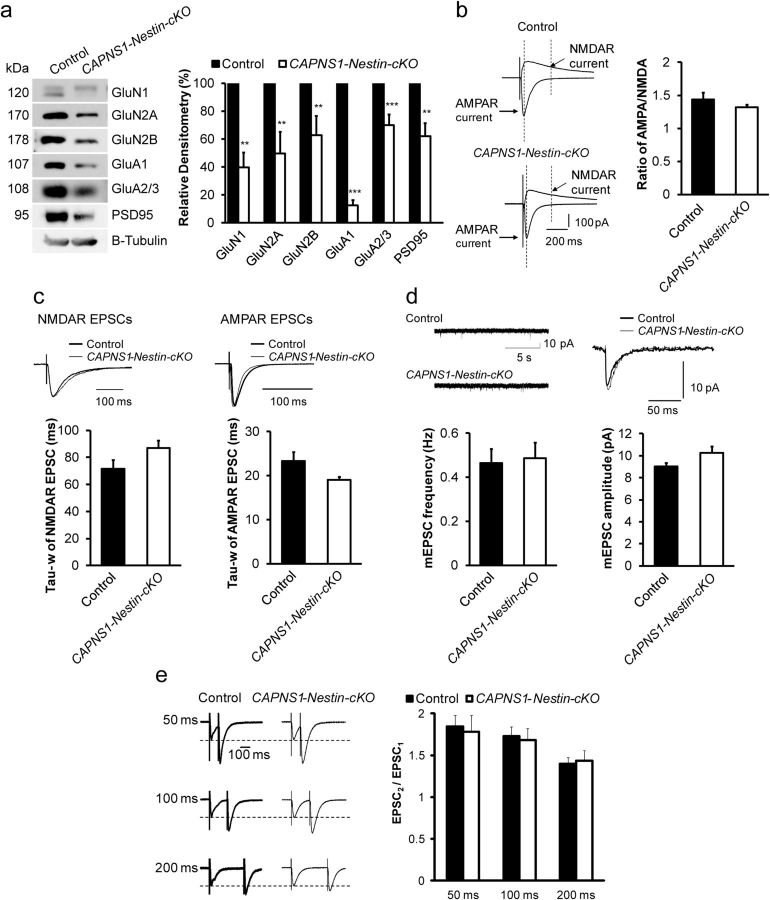
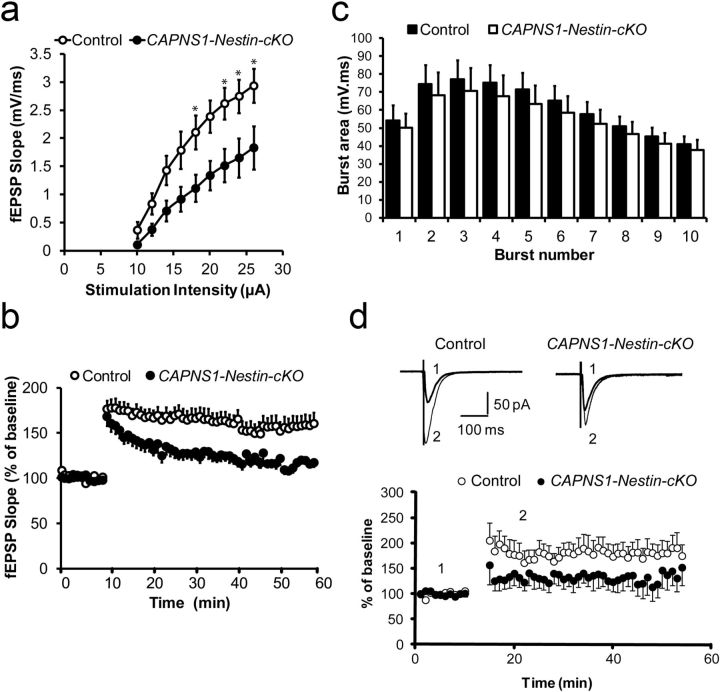
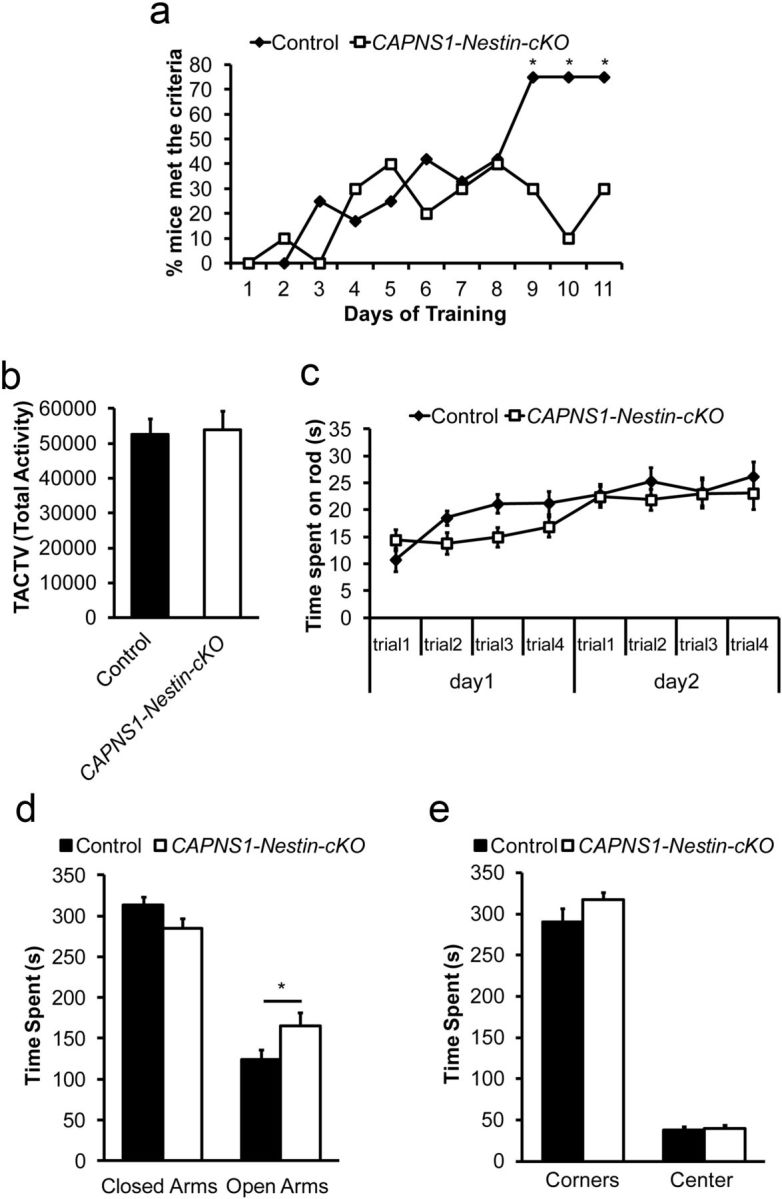
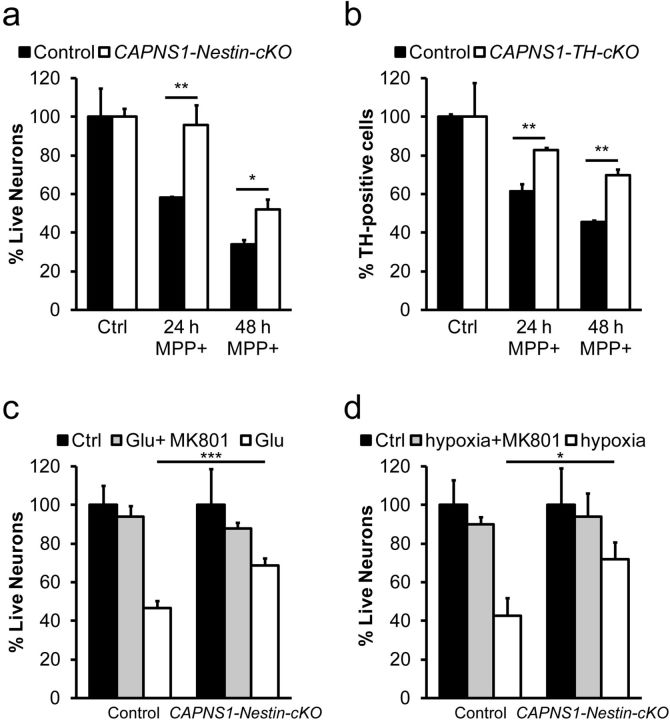
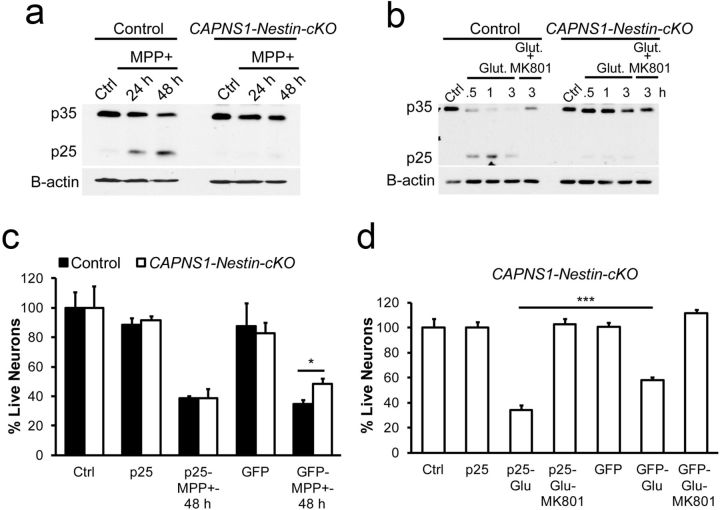
Ubiquitous classical (typical) calpains, calpain-1 and calpain-2, are Ca(+2)-dependent cysteine proteases, which have been associated with numerous physiological and pathological cellular functions. However, a clear understanding of the role of calpains in the CNS has been hampered by the lack of appropriate deletion paradigms in the brain. In this study, we describe a unique model of conditional deletion of both calpain-1 and calpain-2 activities in mouse brain, which more definitively assesses the role of these ubiquitous proteases in brain development/function and pathology. Surprisingly, we show that these calpains are not critical for gross CNS development. However, calpain-1/calpain-2 loss leads to reduced dendritic branching complexity and spine density deficits associated with major deterioration in hippocampal long-term potentiation and spatial memory. Moreover, calpain-1/calpain-2-deficient neurons were significantly resistant to injury induced by excitotoxic stress or mitochondrial toxicity. Examination of downstream target showed that the conversion of the Cdk5 activator, p35, to pathogenic p25 form, occurred only in the presence of calpain and that it played a major role in calpain-mediated neuronal death. These findings unequivocally establish two central roles of calpain-1/calpain-2 in CNS function in plasticity and neuronal death.


Figures

Figure 1.
Figure 1.
Disruption of calpain-1 and calpain-2 expression and activities in the CAPNS1-Nestin-cKO mouse brain. a, Southern blot analysis of brain DNA samples from CAPNS1-Nestin-cKO (Nestin-Cre; capns1 flox/flox) and control littermates (Nestin-Cre; capns1 +/flox or capns1 +/flox). The probe distinguishes 5.1, 4.3, and 3.2 kbp PstI fragments corresponding to untargeted (capns1) or the floxed allele after (capns1post-Cre) or before (capns1flox) Cre-mediated excision, respectively. b, Top, Representative immunoblot of calpain-2 (CAPN2) (80 kDa) and CAPNS1 (28 kDa) proteins extracted from brains of CAPNS1-Nestin-cKO and control littermates probed with calpain-2 antibody. Bottom, Casein zymogram of the brain total fraction to analyze calpain-1 and calpain-2 activities (n = 5 per genotype). c, Representative immunoblot of brain total protein extracts probed with indicated antibodies for αII-spectrin and active calpain-1 (n = 3 per genotype). CaCl2 triggered cleavage of spectrin to its calpain-specific 145 and 150 kDa breakdown products in control but not CAPNS1-Nestin-cKO brain extracts, whereas addition of rat calpain-2 enzyme cleaved spectrin to 150 kDa in brain lysates of both genotypes.
Figure 2.
Figure 2.
Histological assessment of CAPNS1-Nestin-cKO mice compared with control littermates. a, b, Representative cresyl violet staining of coronal sections through different regions of brains from (a) E17.5 and (b) 4- to 6-week-old adult CAPNS1-Nestin-cKO mice and controls, respectively, including different regions (scale bar, 1 mm) and neurons in hippocampus and cortex (scale bar, 20 μm). c, Number of CA1 neurons in defined fields at 4 to 6 weeks of age (n = 3 per genotype). d, Representative photomicrographs of BrdU-stained sections of embryonic brains from CAPNS1-Nestin-cKO and control littermates. Scale bar: left, 175 μm; right, 20 μm. Number of BrdU-positive cells were counted in defined fields of sections (n = 4 per genotype). e, Number of TUNEL-positive cells throughout whole brain sections (n = 3 per genotype).
Figure 3.
Figure 3.
Altered morphology of hippocampal CA1 neuron dendrites in CAPNS1-Nestin-cKO mice. a, Representative segments of apical and basal dendrites of CA1 neurons in CAPNS1-Nestin-cKO and control littermates. Scale bar: 5 μm. Bottom, Representative photomicrograph of CA1 pyramidal neurons. Scale bar: 50 μm. b, Representative graphs of spine density of basal and apical dendrites per branch orders. Spine density is expressed as the mean spine number per 1 μm dendritic segment. c, Representative graphs of total spine count of basal and apical dendrites per branch orders. d, Scholl analysis of intersection pattern of basal and apical dendrites in CA1 neurons. e, Distribution of spines in basal and apical dendrites at 30 μm interval radiating distances from the soma in CA1 neurons. f, Representative graphs of basal and apical dendrites total length (n = 27 neurons for control littermates and n = 20 neurons for CAPNS1-Nestin-cKOs). Data are mean ± SEM. *p < 0.05 (repeated ANOVA). **p < 0.01 (repeated ANOVA). ***p < 0.001 (repeated ANOVA).
Figure 4.
Figure 4.
Hippocampal membrane protein distribution and glutamatergic synaptic transmission in hippocampal CA1 neurons of CAPNS1-Nestin-cKO and controls. a, Representative immunoblots of membrane protein fractions of hippocampi from control and CAPNS1-Nestin-cKO probed with the indicated antibodies and densitometric quantification of changes in gray values expressed as mean ± SEM. **p < 0.01 (Student's t test). ***p < 0.001 (Student's t test). Per genotype: n = 4 for GluN1 and GluA1; n = 5 for GluN2A, GluN2B, and PSD95; n = 3 for GluA2/3. b, Representing traces of AMPAR and NMDAR EPSCs at V-hold of −65 and +40 mV, respectively (CAPNS1-Nestin-cKO 1.32 ± 0.04, n = 9 neurons from 3 mice; and controls 1.4 ± 0.1, n = 8 neurons from 4 mice). At −65 mV, the peak current is mainly contributed by AMPA receptors, whereas at +40 mV the peak current comes from both AMPA and NMDA receptors. c, Representative traces and weighted decay time constants of NMDAR and AMPAR EPSCs in CAPNS1-Nestin-cKO (NMDAR 87.07 ± 5.46 ms, n = 11 neurons from 4 mice; and AMPAR 19.05 ± 0.64 ms, n = 9 neurons from 4 mice) and controls (NMDAR 71.55 ± 6.42 ms, n = 6 neurons from 4 mice and AMPAR 23.36 ± 2.01 ms, n = 9 neurons from 4 mice). d, Representative traces and averages of spontaneous AMPAR-mediated mEPSCs recorded from neurons of CAPNS1-Nestin-cKO (amplitude, 10.27 ± 0.59 pA; frequency, 0.48 ± 0.07 Hz, n = 8 neurons from 3 mice) and control mice (amplitude, 9.01 ± 0.34 pA; frequency, 0.46 ± 0.07 Hz, n = 8 neurons from 4 mice). e, Representative traces and average of paired pulse ratios of EPSCs (AMPA + NMDAR) from neurons of CAPNS1-Nestin-cKO mice (50 ms, 1.78 ± 0.2; 100 ms, 1.68 ± 0.14; 200 ms, 1.44 ± 0.12, n = 9 neurons from 3 mice) and controls (50 ms, 1.85 ± 0.13; 100 ms, 1.73 ± 0.11; 200 ms, 1.39 ± 0.07, n = 12 neurons from 3 mice).
Figure 5.
Figure 5.
Features of synaptic transmission and plasticity in calpain-deficient mice assessed with field and patch-clamp recording. a, Input/output curves. Amplitudes of the fEPSPs were determined for various intensities of stimulation. The curve is significantly shifted downward in the mutant mice. The results are mean ± SEM; n = 5 or 6 slices from 5 mice per genotype. *p < 0.05 (Student's t test). b, TBS-induced LTP. TBS was delivered after 10 min of baseline recording and slopes of the fEPSPs monitored for an additional 50 min. The values are normalized to the baseline and are mean ± SEM; n = 5 or 6 slices from 5 mice per genotype. ***p < 0.001 (Student's t test). c, Areas of the burst responses during TBS (10 bursts of 4 pulses delivered at 100 Hz, with an interburst interval of 200 ms). Results are mean ± SEM with no statistical differences between the two groups of mice; n = 5 or 6 slices from 5 mice per genotype. d, Patch-clamp recording of LTP. Representative traces of EPSC amplitudes 10 min before (1) and 50 min after (2) HFS pairing paradigm. Bottom, Time course of relative changes of EPSCs (for control n = 6 neurons from 4 mice, for CAPNS1-Nestin-cKO n = 5 neurons form 4 mice). Data are mean ± SEM. p value is from the data comparison of 30–40 min EPSC average of mutants with those of control. ***p < 0.001 (Student's t test).
Figure 6.
Figure 6.
Spatial learning is deficient in CAPNS1-Nestin-cKO mice, whereas motor activity and anxiety behavior appear normal. a, Percentage of CAPNS1-Nestin-cKO (males, n = 6; females, n = 4) and control littermate (males, n = 5; females, n = 7) mice successfully reaching the criteria of finding the platform in the Morris Water Maze, as described in Materials and Methods. b, Locomotor activity assessed in a novel cage test. c, Motor coordination examined by rotarod test. d, e, Anxiety observation performed with elevated plus maze (d) and open field test (e). Data are mean ± SEM. *p < 0.05 (Student's t test and repeated ANOVA). Controls: males, n = 10; females, n = 11; CAPNS1-Nestin-cKO: males, n = 11; females, n = 10.
Figure 7.
Figure 7.
Calpain mediates excitotoxic neuronal death in PD- and ischemic-related in vitro models. a, b, MPP+ treatment of (a) cortical neurons and (b) midbrain neurons, respectively, at 20 μm final concentration for 24 and 48 h revealed that calpain-deficient neurons were resistant to toxin-induced death (survival rate, 96 ± 10% vs 58 ± 1% at 24 h; 52 ± 5% vs 34 ± 2% at 48 h and 83 ± 1% vs 61 ± 4% at 24 h; 70 ± 3% vs 45 ± 1% at 48 h, respectively; n = 4 per genotype). c, Transient glutamate treatment of CGNs at 50 μm final concentration for 70 min followed by 1.5 h reoxygenation in the presence and absence of 10 μm MK801 (survival rate, 68 ± 4% vs 47 ± 4%; n = 6 per genotype). d, Hypoxia (1% oxygen) treatment of CGNs for 4–5 h followed by 1–2 h reoxygenation in the presence and absence of 10 μm MK801 (survival rate, 72 ± 9% vs 43 ± 9%; n = 4 per genotype). Data are mean ± SEM. *p < 0.05 (Student's t test). **p < 0.01 (Student's t test). ***p < 0.001 (Student's t test).
Figure 8.
Figure 8.
p35 is a target of calpain, and the p25 cleavage product mediates excitotoxic neuronal death. a, b, Representative immunoblots showing the increase in p35 cleavage to p25 after (a) MPP+ and (b) glutamate treatment in cortical neurons and CGNs, respectively, from control mice but not CAPNS1-Nestin-cKO (n = 5 per genotype). c, d, Graphical representation of sensitization of (c) cortical neurons and (d) CGNs to MPP+ and glutamate, respectively, and the resensitization of calpain-deficient neurons by AAV-directed p25 overexpression (n = 3 per genotype). Data are mean ± SEM of the number of intact nuclei. c, *p < 0.05, controls versus mutant neurons expressing GFP and treated with MPP+ (Student's t test). d, ***p < 0.001, neurons from mutants expressing either p25 or GFP and treated with glutamate (Student's t test).

References

    1. Arthur JS, Elce JS, Hegadorn C, Williams K, Greer PA. Disruption of the murine calpain small subunit gene, Capn4: calpain is essential for embryonic development but not for cell growth and division. Mol Cell Biol. 2000;20:4474–4481. - PMC - PubMed
    1. Bai G, Hoffman PW. Transcriptional regulation of NMDA receptor expression. In: Van Dongen AM, editor. Boca Raton, FL: CRC; 2009. - PubMed
    1. Bartus RT, Dean RL, Cavanaugh K, Eveleth D, Carriero DL, Lynch G. Time-related neuronal changes following middle cerebral artery occlusion: implications for therapeutic intervention and the role of calpain. J Cereb Blood Flow Metab. 1995;15:969–979. - PubMed
    1. Baudry M, Lynch G. Remembrance of arguments past: how well is the glutamate receptor hypothesis of LTP holding up after 20 years? Neurobiol Learn Mem. 2001;76:284–297. - PubMed
    1. Bednarski E, Vanderklish P, Gall C, Saido TC, Bahr BA, Lynch G. Translational suppression of calpain I reduces NMDA-induced spectrin proteolysis and pathophysiology in cultured hippocampal slices. Brain Res. 1995;694:147–157. - PubMed

Publication types

MeSH terms