. 2013 Mar 27;33(13):5785-96.
doi: 10.1523/JNEUROSCI.6452-11.2013.

The α crystallin domain of small heat shock protein b8 (Hspb8) acts as survival and differentiation factor in adult hippocampal neurogenesis

Affiliations

The α crystallin domain of small heat shock protein b8 (Hspb8) acts as survival and differentiation factor in adult hippocampal neurogenesis

Gerardo Ramírez-Rodríguez et al. J Neurosci. .

Abstract

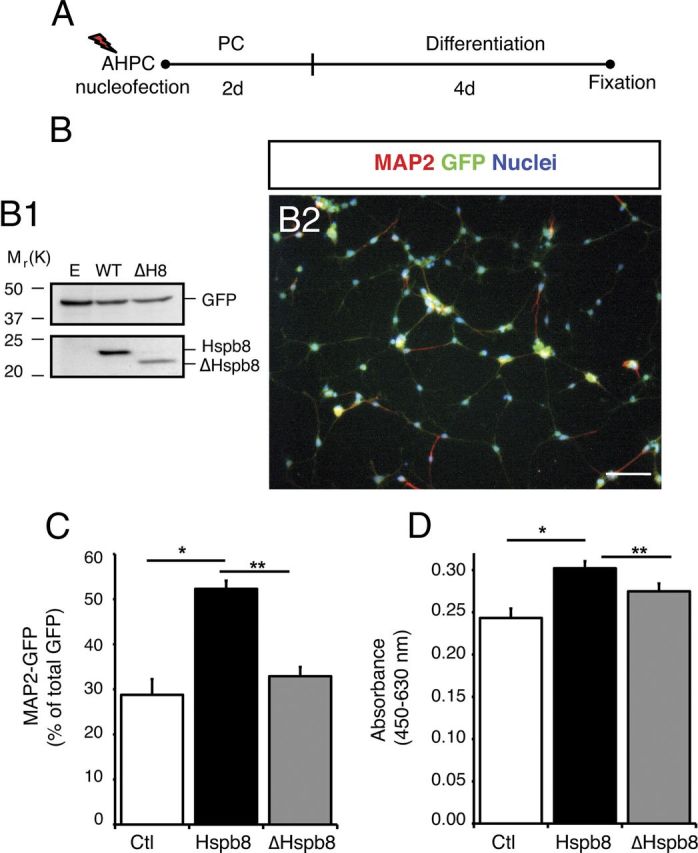
Adult hippocampal neurogenesis is to a large degree controlled at the level of cell survival, and a number of potential mediators of this effect have been postulated. Here, we investigated the small heat shock protein Hspb8, which, because of its pleiotropic prosurvival effects in other systems, was considered a particularly promising candidate factor. Hspb8 is, for example, found in plaques of Alzheimer disease but exerts neuroprotective effects. We found that expression of Hspb8 increased during differentiation in vitro and was particularly associated with later stages (48-96 h) of differentiation. Gain-of-function and loss-of-function experiments supported the hypothesis that Hspb8 regulates cell survival of new neurons in vitro. In the dentate gyrus of adult mice in vivo, lentiviral overexpression of Hspb8 doubled the surviving cells and concomitantly promoted differentiation and net neurogenesis without affecting precursor cell proliferation. We also discovered that the truncated form of the crystallin domain of Hspb8 was sufficient to affect cell survival and neuronal differentiation in vitro and in vivo. Precursor cell experiments in vitro revealed that Hspb8 increases the phosphorylation of Akt and suggested that the prosurvival effect can be produced by a cell-autonomous mechanism. Analysis of hippocampal Hspb8 expression in mice of 69 strains of the recombinant inbred set BXD revealed that Hspb8 is a cis-acting gene whose expression was associated with clusters of transcript enriched in genes linked to growth factor signaling and apoptosis. Our results strongly suggest that Hspb8 and its α-crystallin domain might act as pleiotropic prosurvival factor in the adult hippocampus.


Figures

Figure 1.
Figure 1.
Hspb8 is expressed in the dentate gyrus (DG) of adult mice. Immunofluorescent labeling reveals the expression of Hspb8 in the hippocampus of adult mice. A, B, The protein (red) appears to be more concentrated in the DG, CA3, CA2, CA1, and in the hilus. C, Hspb8 (red) shows colocalization with type 1 cells (small arrowhead). Also, Hspb8 colocalizes with type 2 cells identified by coexpression of Nestin-GFP (green) with double-cortin (blue). C2, High-power confocal images. C2′–C2′′′, Representative images of each protein marker (arrowheads). Also, Hspb8 colocalized with calretinin in some cells (D). D1, High-power images (arrowheads indicate Hspb8/calretinin double-positive immature neurons). E, E1, Representative images show that Hspb8 predominantly colocalizes with mature NeuN-positive neurons in the hippocampus. The colocalization is shown in high-power images (arrowhead; right). A–D, The molecular layer (ML), granular cell layer (GCL), and subgranular zone (SGZ). Scale bars: A, B, 150 μm; C, 75 μm; C1, 45 μm; D, E, 60 μm.
Figure 2.
Figure 2.
Hspb8 is expressed in adult hippocampal precursor cells and in the dentate gyrus of adult mice. A, Precursor cells express Hspb8. Immunofluorescence staining depicting the expression of Hspb8 (A3, blue) in precursor cells in culture. Precursor cells in culture were identified by nestin expression (A1, green) and βIII-tubulin (A2, red). Scale bar: A4, 20 μm. B, RT-PCR of Hspb8 using RNA derived from mouse adult precursor cells showed that the transcript is expressed in the precursor cells and in the dentate gyrus (DG). C, Expression of Hspb8 protein was also found in precursor cells (AHPC) and in the DG.
Figure 3.
Figure 3.
Expression changes of Hspb8 during precursor cell differentiation in vitro. A, Differential interference contrast (DIC) image of precursor cells cultured in the presence of growth factors is shown in A1, and precursor cells differentiated during 96 h are shown in A2. Images clearly show the morphological changes that occur before and after differentiation. Scale bar, 60 μm. B, qRT-PCR of Hspb8 during the differentiation time course of precursor cells shows an increase in its expression level at 48 and 96 h after differentiation. Error bars indicate SEM. *p < 0.0002, PC versus 48 and 96 h, respectively. C, The expression pattern of Hspb8 protein was analyzed by Western blot before and after induction of differentiation, indicating an increase in the protein level after 24 h of differentiation. GAPDH was used as loading control.
Figure 4.
Figure 4.
Overexpression of Hspb8 affects neuronal differentiation of precursor cells in vitro. A, Experimental time line for Hspb8 effect on precursor cell (AHPC) differentiation. B, Expression of Hspb8, ΔHspb8, and GFP after nucleofection was verified by Western blot (B1). B2, Representative image of new neurons identified by the coexpression of GFP (green) and MAP2 (red). Nuclei were stained with DAPI (blue). Scale bar, 70 μm. C, Precursor cells expressing Hspb8 or ΔHspb8 were differentiated during 4 d. Quantification of MAP2/GFP neurons was done as described in Materials and Methods. There were significant differences in neuronal differentiation between groups. Hspb8 and ΔHspb8 affect neuronal differentiation of precursor cells. Experiments were duplicated and repeated at least three times. Results represent the mean ± SEM of total GFP. *p = 0.001, control versus Hspb8 (Tukey's post hoc test after one-way ANOVA). **p = 0.001, Hspb8 versus ΔHspb8 (Tukey's post hoc test after one-way ANOVA). D, Effect of Hspb8 overexpression on cell survival was done with Wst-1 assay, showing that Hspb8 significantly increased cell survival and that ΔHspb8 affects this parameter. Wst-1 analysis from six wells per group was performed three times. Error bars indicate SEM. *p = 0.001, control versus Hspb8 (Tukey's post hoc test after one-way ANOVA). **p = 0.007, Hspb8 versus ΔHspb8 (Tukey's post hoc test after one-way ANOVA).
Figure 5.
Figure 5.
Knock-down of Hspb8 decreases neuronal differentiation and survival of precursor cells (AHPC) in vitro. A, Time line for the experiments in which Hspb8 was silenced to evaluate its effects on neuronal differentiation and survival. B, Immunofluorescence images of precursor cells nucleofected with control siRNA and Hspb8 siRNA sequences are shown in B1 and B2, respectively. The decrease of Hspb8 was studied in cells that showed colocalization of the signals for Hspb8 (red) and GFP (green). B2, Merged images show cells with a decrease in Hspb8 expression without altered GFP expression after silencing. Scale bar, 30 μm. C, The effect of Hspb8 knock-down was analyzed by immunoblotting. Silencing of Hspb8 (si-Hspb8) decreased the expression of Hspb8, whereas control sequences (si-Ctl) did not affect Hspb8 expression levels. GAPDH was used as loading control. D, E, Hspb8 knock-down significantly affected neuronal differentiation and survival of precursor cells. Control sequences did not significantly affect either parameter. Quantification of βIII-tubulin/GFP neurons was performed as described in Materials and Methods. Experiments were as duplicates with three independent runs. Results represent the mean ± SEM of total GFP. *p = 0.011, Ctl versus si-Hspb8 (Tukey's post hoc test after one-way ANOVA); p = 0.44, si-Ctl versus si-Hspb8 (Tukey's post hoc test after one-way ANOVA). E, Effect of Hspb8 overexpression on cell survival was also assessed with the Wst-1 assay. Wst-1 analysis from six wells per group was performed three times. *p = 0.004, Ctl versus si-Hspb8 (Tukey's post hoc test after one-way ANOVA); p = 0.75, Ctl versus si-Ctl (Tukey's post hoc test after one-way ANOVA).
Figure 6.
Figure 6.
LV-mediated overexpression of LV-Hspb8 affects cell survival in vivo. A, Experimental design for the proliferation study in adult mice transduced with control viral vector (LVGFP), LV-Hspb8, or LV-ΔHspb8. After viral vector injection, proliferating cells were labeled by three sequential injections of BrdU (50 mg/kg). B, Cells in the proliferation phase were identified by the coexpression of BrdU/GFP in the transduced areas. Scale bar, 30 μm. C, Quantification of BrdU-labeled cells did not show significant changes in cell proliferation between LV-GFP, LV-Hspb8, and LV-ΔHspb8 groups. D, Three weeks after viral vector injection (LVGFP, LV-Hspb8, or LV-ΔHspb8), cells were labeled by three sequential injections of BrdU (30 mg/kg). Surviving cells were quantified 3 weeks after the last BrdU administration. E, Representative image of cells coexpressing BrdU/GFP in the transduced dentate gyrus. Scale bar, 30 μm. F, Quantification of BrdU-labeled cells indicated an increase in cell survival caused by LV-Hspb8 compared with LV-GFP. However, the truncated LV-ΔHspb8 did not affect cell survival caused by LV-Hspb8. N = 5 or 6 mice per group. Error bars indicate SEM. *p = 0.022, LV-GFP versus LV-Hspb8 (Fisher's post hoc test after one-way ANOVA). **p = 0.006, LV-Hspb8 versus LV-ΔHspb8 (Fisher's post hoc test after one-way ANOVA).
Figure 7.
Figure 7.
Hspb8 modulates neuronal differentiation in vivo. A, Neuronal differentiation was assessed by quantifying BrdU-labeled (A1, red) and NeuN-labeled (A3, blue) cells coexpressing GFP (A2, green) in the transduced areas (arrows). Scale bar, 40 μm. The merged image shows a granule cell triple labeled for BrdU/NeuN/GFP (A4). B, Significant increase in BrdU/NeuN/GFP-labeled cells in the dentate gyrus of mice injected with LV-Hspb8 related to LV-GFP control mice. The truncated LV-ΔHspb8 affects neuronal differentiation caused by LV-Hspb8. N = 5 or 6 mice per group. Error bars indicate SEM. *p = 0.026, LV-GFP versus LV-Hspb8 (Fisher's post hoc test after one-way ANOVA). **p = 0.020, LV-Hspb8 versus LV-ΔHspb8 (Fisher's post hoc test after one-way ANOVA).
Figure 8.
Figure 8.
Hspb8 does not affect astrocytic differentiation in vivo. A, Astrocytic differentiation was assessed by counting BrdU-labeled cells (A1, red) and S100β-labeled cells (A3, blue) coexpressing GFP (A2, green) in the transduced areas (arrows). Scale bar, 40 μm. The merged image shows a triple-labeled cell for BrdU/ GFP/S100β (A4). B, Slight increase in BrdU/GFP/S100β-labeled astrocytes in the dentate gyrus of mice injected with LV-Hspb8 in relation to LV-GFP control mice (not significant). In contrast, the truncated LV-ΔHspb8 decreased the fraction of astrocytes in relation to to LV-GFP control mice. N = 5 or 6 mice per group. Error bars indicate SEM. p = 0.49, LV-GFP versus LV-Hspb8 or LV-Hspb8 versus LV-ΔHspb8 (Fisher's post hoc test after one-way ANOVA).
Figure 9.
Figure 9.
Overexpression of Hspb8 activates the Akt survival pathway during differentiation of precursor cells in vitro. A, Experimental time line for Hspb8 effects on precursor cell (AHPC) survival. B, Levels of phospho-Akt (p-Akt) decrease with differentiation of AHPC. C, Overexpression of Hspb8 increases levels of p-Akt, whereas cells that overexpressed Hspb8 and were incubated with PI3K inhibitor, LY294002 10 μm (I-PI3K) showed a decrease in levels of p-Akt. C, Knock-down of Hspb8 also decreased Akt phosphorylation. B–D, Representative autoradiograms and densitometric analysis of p-Akt. B, Total Akt (unphosphorylated form). D, GAPDH autoradiograms. Data were normalized to total Akt and GAPDH levels. Densitometric analysis represents the mean ± SEM. B, p = 0.001. C, p < 0.001. *Control (Ctl) versus Hspb8. **Ctl versus Ctl + I-PI3K. ***Hspb8 versus Hspb8 + I-PI3K. D, p < 0.001. *Control (Ctl) versus siHspb8 (Tukey's post hoc test after one-way ANOVA).
Figure 10.
Figure 10.
Soluble factors in CM from transfected precursor cells do not affect cell proliferation and survival of wild-type precursor cells in vitro. A, Time line for experiments, in which Hspb8 and siHspb8 were transfected to collect CM for subsequent treatment of nontransfected (wild-type) precursor cells (AHPC). B, C, CM from Hspb8- and siHspb8-expressing precursor cells did not affect cell proliferation (BrdU) and viability (Wst-1) of wild-type cells. Similar results were obtained with cells treated with normal proliferation media (NM) or with CM obtained from nontransfected cells. Error bars indicate SEM. B, C, p = 0.14 (BrdU) and p = 0.24 (Wst-1) (Tukey's post hoc test after one-way ANOVA). D, E, Wild-type precursor cells treated with CM from Hspb8- and siHspb8-expressing precursor cells did not lead to significant changes of survival. D, Wild-type precursor cells were prelabeled with BrdU before cells were switched to CM. Cells treated with NM or CM obtained from differentiated nontransfected cells did not show changes in cell survival. Error bars indicate SEM. D, E, p = 0.15 (BrdU) and p = 0.22 (Wst-1) (Tukey's post hoc test after one-way ANOVA). The BrdU and Wst-1 analysis from six wells per group was performed three times each.
Figure 11.
Figure 11.
Genetic interactions of Hspb8. A, Genomic association mapping of Hspb8 mRNA expression. A composite trait comprised of the principal component of transcript expression measured by three microarray probes was mapped to the mouse genome. A very strong cis-QTL (quantitative trait locus at the same location as the Hspb8 gene, blue trace) was highly significant (LOD 17.5), indicating that a sequence variant at this locus strongly affects Hspb8 gene expression. Gray and red horizontal lines indicate genome-wide significance at p = 0.63 and p = 0.05, respectively. B, A subnetwork from the STRING database showing genes associated, directly or indirectly, with Hspb8. Colored connections indicate conceptual links between genes based on different sources of evidence, such as literature commentary, protein–protein binding, and microarray coexpression. Genes exhibiting expression correlation in a pertinent hippocampal microarray study are highlighted green for positive and red for inverse correlation.

References

    1. Arndt V, Dick N, Tawo R, Dreiseidler M, Wenzel D, Hesse M, Fürst DO, Saftig P, Saint R, Fleischmann BK, Hoch M, Höhfeld J. Chaperone-assisted selective autophagy is essential for muscle maintenance. Curr Biol. 2010;20:143–148. - PubMed
    1. Arthur DB, Georgi S, Akassoglou K, Insel PA. Inhibition of apoptosis by P2Y2 receptor activation: novel pathways for neuronal survival. J Neurosci. 2006;26:3798–3804. - PMC - PubMed
    1. Babu H, Ramírez-Rodríguez G, Fabel K, Bischofberger J, Kempermann G. Synaptic network activity induces neuronal differentiation of adult hippocampal precursor cells through BDNF signaling. Front Neurosci. 2009;3:49. - PMC - PubMed
    1. Babu H, Claasen JH, Kannan S, Rünker AE, Palmer T, Kempermann G. A protocol for isolation and enriched monolayer cultivation of neural precursor cells from mouse dentate gyrus. Front Neurosci. 2011;5:89. - PMC - PubMed
    1. Bracko O, Singer T, Aigner S, Knobloch M, Winner B, Ray J, Clemenson GD, Jr, Suh H, Couillard-Despres S, Aigner L, Gage FH, Jessberger S. Gene expression profiling of neural stem cells and their neuronal progeny reveals IGF2 as a regulator of adult hippocampal neurogenesis. J Neurosci. 2012;10:3376–3387. - PMC - PubMed

Publication types

MeSH terms

LinkOut - more resources