. 2013 May;70(5):534-42.
doi: 10.1001/jamapsychiatry.2013.736.

Polygenic risk and the developmental progression to heavy, persistent smoking and nicotine dependence: evidence from a 4-decade longitudinal study

Affiliations

Polygenic risk and the developmental progression to heavy, persistent smoking and nicotine dependence: evidence from a 4-decade longitudinal study

Daniel W Belsky et al. JAMA Psychiatry. 2013 May.

Abstract

Importance: Genome-wide hypothesis-free discovery methods have identified loci that are associated with heavy smoking in adulthood. Research is needed to understand developmental processes that link newly discovered genetic risks with adult heavy smoking.

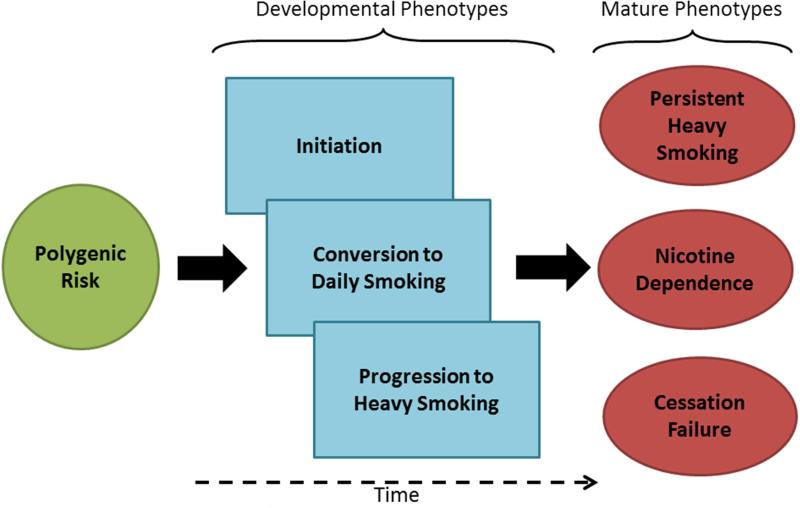
Objective: To test how genetic risks discovered in genome-wide association studies of adult smoking influence the developmental progression of smoking behavior from initiation through conversion to daily smoking, progression to heavy smoking, nicotine dependence, and struggles with cessation.

Design: A 38-year, prospective, longitudinal study of a representative birth cohort.

Setting: The Dunedin Multidisciplinary Health and Development Study of New Zealand.

Participants: The study included 1037 male and female participants.

Exposure: We assessed genetic risk with a multilocus genetic risk score. The genetic risk score was composed of single-nucleotide polymorphisms identified in 3 meta-analyses of genome-wide association studies of smoking quantity phenotypes.

Main outcomes and measures: Smoking initiation, conversion to daily smoking, progression to heavy smoking, nicotine dependence (Fagerström Test of Nicotine Dependence), and cessation difficulties were evaluated at 8 assessments spanning the ages of 11 to 38 years.

Results: Genetic risk score was unrelated to smoking initiation. However, individuals at higher genetic risk were more likely to convert to daily smoking as teenagers, progressed more rapidly from smoking initiation to heavy smoking, persisted longer in smoking heavily, developed nicotine dependence more frequently, were more reliant on smoking to cope with stress, and were more likely to fail in their cessation attempts. Further analysis revealed that 2 adolescent developmental phenotypes-early conversion to daily smoking and rapid progression to heavy smoking-mediated associations between the genetic risk score and mature phenotypes of persistent heavy smoking, nicotine dependence, and cessation failure. The genetic risk score predicted smoking risk over and above family history.

Conclusions and relevance: Initiatives that disrupt the developmental progression of smoking behavior among adolescents may mitigate genetic risks for developing adult smoking problems. Future genetic research may maximize discovery potential by focusing on smoking behavior soon after smoking initiation and by studying young smokers.


Figures

Figure 1
Figure 1. Genetic risk and the developmental progression of smoking behavior
In the hypothesized model, genetic risk influences the mature phenotypes of heavy smoking persistence, nicotine dependence, and cessation failure through a pathway mediated by three developmental phenotypes: smoking initiation, conversion to daily smoking; and progression to heavy smoking.
Figure 2
Figure 2. Smoking behavior in the Dunedin cohort
Panel A. Developmental Progression of Smoking Behavior in the Dunedin cohort. Study members reported their smoking status during in-person assessments at ages 11 (percent ever-smokers=7%), 13 (13%), 15 (62%), 18 (66%), 21 (70%), 26 (70%), 32 (71%), and 38 years (71%) and their daily cigarette consumption at ages 13 (percent daily smokers=1%), 15 (14%), 18 (31%), 21 (34%), 26 (35%), 32 (30%), and 38 years (20%). We assessed nicotine dependence using the Fagerstrom Test of Nicotine Dependence (FTND), completed by study members at the age-21, -26, and -38 assessments. We assessed cessation failure using study members’ reports of quit attempts and outcomes at the ages 18, 21, 26, 32, and 38 assessments. Panel B. Measurements of Developmental and Mature Smoking Phenotypes
Figure 3
Figure 3. A genetic risk score derived from GWAS of smoking quantity is associated with the developmental progression of smoking behavior in a birth cohort of European-descent individuals
Panel A shows that individuals at higher genetic risk progressed more rapidly from smoking initiation to heavy smoking. Panel A graphs hazard functions for onset of heavy smoking among individuals at low genetic risk (genetic risk Z-score=-1, green line), average genetic risk (genetic risk Z-score=0, black line), and high genetic risk (genetic risk Z-score=1, red line). The dashed gray line marks the cumulative hazard for individuals at average genetic risk. The hazard function was estimated from a Cox proportional hazard model with time since onset of ever-smoking as the exposure time and the first assessment a study member reported smoking ≥20 cigarettes/day as the failure event. The hazard model included all individuals who ever initiated smoking (N=627). Individuals at higher genetic risk progressed more rapidly from smoking initiation to smoking ≥20 cigarettes/day (Hazard Ratio=1.35 [1.14-1.58]). Panel B shows that genetic risk was highest among individuals who progressed to heavy smoking and lowest among individuals who initiated smoking but who did not progress to heavy smoking. The figure shows the genetic risk Z-sores (+/- 1 standard error) for each group. “CPD” is “cigarettes per day.” A genetic risk Z-score of 0 corresponds to the average genetic risk in the cohort. Error bars reflect standard errors of the sub-group means.
Figure 4
Figure 4. Genetic risk predicts mature phenotypes of smoking behavior
Panel A shows that among individuals who initiated smoking, those at higher genetic risk smoked more cigarettes by age 38 years. Ever-smokers were all individuals who initiated smoking by age 38 years (N=627). The bars of the histogram graph the percentages of the sample carrying 1-12 risk alleles. The dots and standard-error bars reflect average lifetime cigarette consumption (in pack-years) for ever-smokers carrying 1-3, 4, 5, 6, 7, 8, 9, 10, and 11-12 risk alleles. The regression line shows the association between the genetic risk score and pack-years smoked by age 38 years (Pearson Correlation r=0.12, p=0.003). Panel B shows that ever-smokers at higher genetic risk were more likely to be nicotine dependent. The bars of the chart graph the proportion of ever-smokers at low (n=157), average (n=292), and high (n=178) genetic risk (left side) who became nicotine dependent (≥4 Fagerstrom symptoms) by age 38 years; and (right side) who were nicotine dependent at two or more assessments. Panel C shows that smokers at higher genetic risk were more likely to experience cessation failure during their 30s. The bars of the chart graph the proportions of daily smokers at low, average, and high genetic risk (left side) who experienced relapse following a quit attempt lasting ≥1 month; and (right side) who achieved successful cessation (abstinence ≥1 year) through age 38 years. Percent with relapse was calculated from cohort members who quit smoking for ≥1 month during ages 32-38 years (n= 36 for the low genetic risk group; n= 61 for the average genetic risk group; n=34 for the high genetic risk group). Percent with successful cessation was calculated for cohort members who smoked daily during their 30s (n=65 for the low genetic risk group; n=120 for the average genetic risk group; n=77 for the high genetic risk group). In panels B and C, low genetic risk individuals had GRSs more than 0.5 standard deviations below the cohort mean; average genetic risk individuals had GRSs within 0.5 standard deviations of the cohort mean; and high genetic risk individuals had GRSs more than 0.5 standard deviations above the cohort mean. Error bars reflect standard errors.

References

    1. Centers for Disease Control and Prevention (CDC) Smoking-attributable mortality, years of potential life lost, and productivity losses--United States, 2000-2004. MMWR Morb Mortal Wkly Rep. 2008;57(45):1226–1228. - PubMed
    1. Current cigarette smoking prevalence among working adults--United States, 2004-2010. MMWR Morb Mortal Wkly Rep. 2011;60(38):1305–1309. - PubMed
    1. Joseph AM, Fu SS, Lindgren B, Rothman AJ, Kodl M, Lando H, Doyle B, Hatsukami D. Chronic disease management for tobacco dependence: a randomized, controlled trial. Arch Intern Med. 2011;171(21):1894–1900. - PMC - PubMed
    1. Carpenter MJ, Hughes JR, Gray KM, Wahlquist AE, Saladin ME, Alberg AJ. Nicotine therapy sampling to induce quit attempts among smokers unmotivated to quit: a randomized clinical trial. Arch Intern Med. 2011;171(21):1901–1907. - PMC - PubMed
    1. Carson KV, Brinn MP, Labiszewski NA, Esterman AJ, Chang AB, Smith BJ. Community interventions for preventing smoking in young people. Cochrane Database of Systematic Reviews. 2011;(7) - PMC - PubMed

Publication types

MeSH terms