. 2013 May 1;19(9):2420-31.
doi: 10.1158/1078-0432.CCR-12-3771. Epub 2013 Mar 27.

Bazedoxifene exhibits antiestrogenic activity in animal models of tamoxifen-resistant breast cancer: implications for treatment of advanced disease

Affiliations

Bazedoxifene exhibits antiestrogenic activity in animal models of tamoxifen-resistant breast cancer: implications for treatment of advanced disease

Suzanne E Wardell et al. Clin Cancer Res. .

Abstract

Purpose: There is compelling evidence to suggest that drugs that function as pure estrogen receptor (ER-α) antagonists, or that downregulate the expression of ER-α, would have clinical use in the treatment of advanced tamoxifen- and aromatase-resistant breast cancer. Although such compounds are currently in development, we reasoned, based on our understanding of ER-α pharmacology, that there may already exist among the most recently developed selective estrogen receptor modulators (SERM) compounds that would have usage as breast cancer therapeutics. Thus, our objective was to identify among available SERMs those with unique pharmacologic activities and to evaluate their potential clinical use with predictive models of advanced breast cancer.

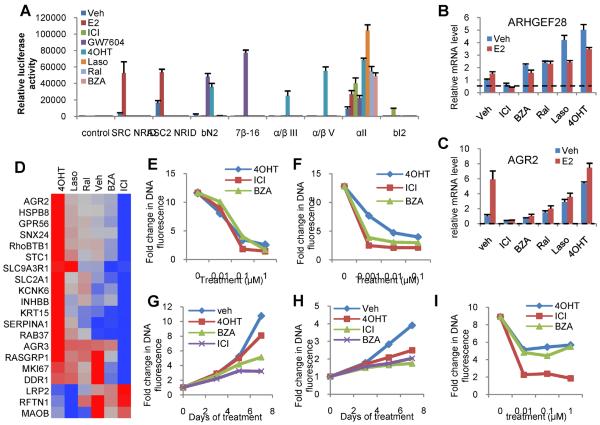
Experimental design: A validated molecular profiling technology was used to classify clinically relevant SERMs based on their impact on ER-α conformation. The functional consequences of these observed mechanistic differences on (i) gene expression, (ii) receptor stability, and (iii) activity in cellular and animal models of advanced endocrine-resistant breast cancer were assessed.

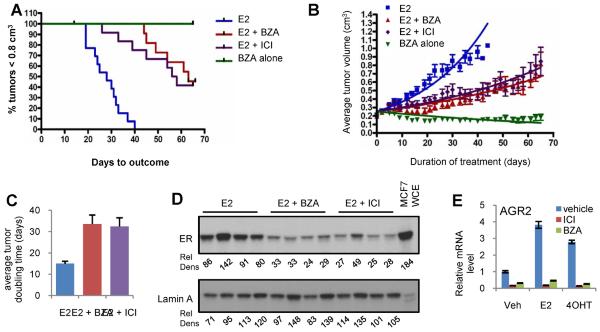
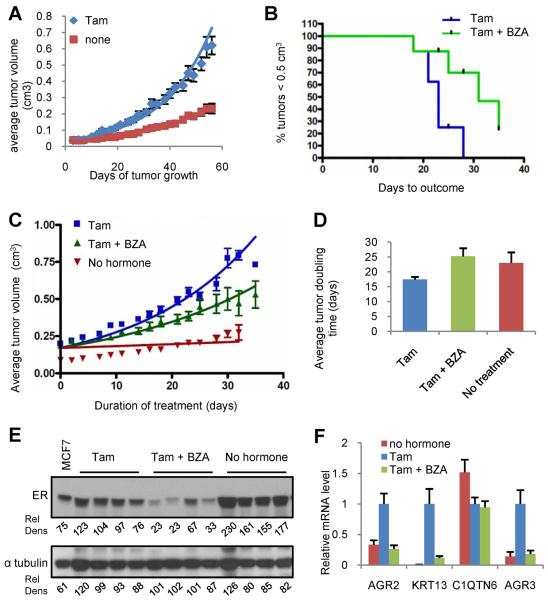
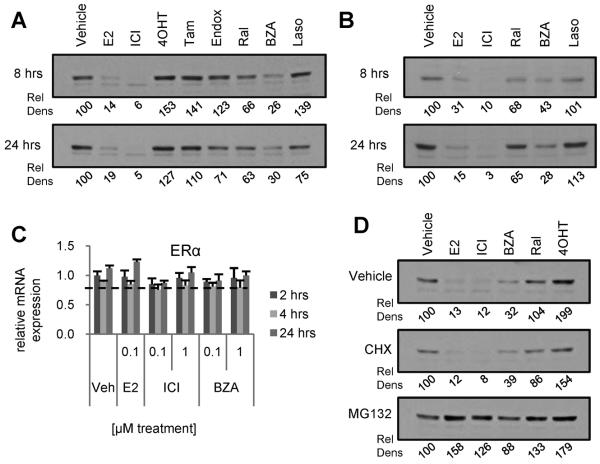
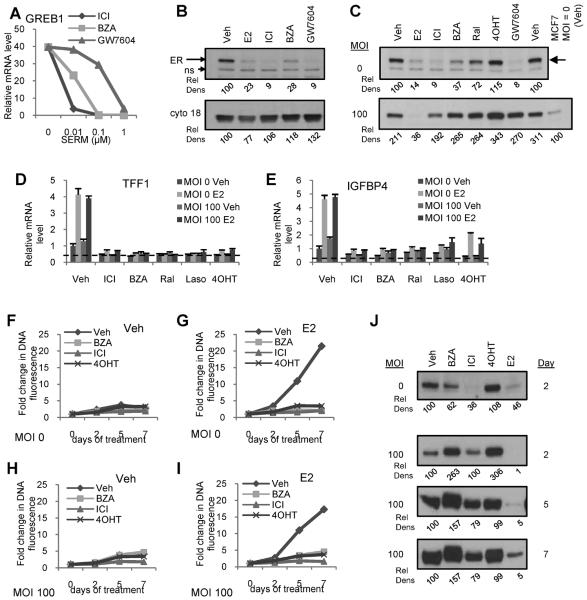
Results: The high-affinity SERM bazedoxifene was shown to function as a pure ER-α antagonist in cellular models of breast cancer and effectively inhibited the growth of both tamoxifen-sensitive and -resistant breast tumor xenografts. Interestingly, bazedoxifene induced a unique conformational change in ER-α that resulted in its proteasomal degradation, although the latter activity was dispensable for its antagonist efficacy.

Conclusion: Bazedoxifene was recently approved for use in the European Union for the treatment of osteoporosis and thus may represent a near-term therapeutic option for patients with advanced breast cancer.


Figures

Figure 1
Figure 1. BZA induces a unique conformational change in ERα and inhibits ERα activity in cellular models of breast cancer
A) Interaction between ERα and conformation-specific peptides in a mammalian two-hybrid system. Triplicate wells of SKBR3 cells were transfected with plasmids expressing ERα fused to VP16 together with Gal4DBD alone (control) or Gal4DBD fused to ER interacting peptides noted on the horizontal axis. Cells were then treated with the indicated ER ligands (100 nM). Interaction of ERα with the Gal4DBD peptide constructs was detected through activation of a Gal4 responsive luciferase reporter construct and was normalized to detected β-galactosidase activity expressed in a constitutive manner using a second vector. Normalized response is expressed as fold increase over the detected level of interaction between Gal4DBD alone and ER-VP16 in the absence of ligand (Veh). B–D) MCF7 cells were treated for 24 hours with vehicle or 100nM ligand - ICI 182,780 (ICI), Bazedoxifene (BZA), Raloxifene (Ral), Lasofoxifene (Laso), or 4-hydroxytamoxifen (4OHT) - prior to RNA isolation and RT-qPCR analysis of the expression of mRNAs shown previously to be responsive to SERMs. mRNA expression was normalized to the expression of the 36B4 housekeeping gene. D) Fold changes as compared to vehicle of mRNAs of interest were transformed and normalized as previously described and are presented as a dendogram constructed in JMP 9.0. E–F) MCF7 cells were plated in phenol red free media supplemented with charcoal stripped FBS (E) or in complete media supplemented with FBS (F) and were treated with the indicated ligands (100nM) on days 1, 4, and 6 of an 8 day proliferation assay. Cells in E were simultaneously treated with 1nM E2. DNA content as assessed by fluorescence serves as an indicator of cell proliferation. G) MCF7 cells were plated and treated as in E, but were treated with 20nM insulin instead of E2. H) Lapatinib resistant BT474 cells (rBT474) were plated in complete media supplemented with FBS and with 1μM GW2974 (EGFR inhibitor), and were then treated as in F. I) LTED MCF7 cells were plated in media supplemented with FBS that was stripped of growth factors twice using charcoal. Cells were treated with 0.01–1μM ligands on days 1, 4, and 6 of an 8 day proliferation assay and analyzed as in E. Values (relative increase in DNA fluorescence) in E–I were normalized to values detected in a duplicate plate of cells that was harvested on day 1 prior to the initial treatment. Data are representative of at least 3 independent experiments. E,F – 756 1nM E2 and complete media 703 – H RBT474 in complete media G – 875 GF prolif Data from 647 H – prolif in complete media F/G – gene expression and degr. coordinated
Figure 2
Figure 2. BZA attenuates ER and estrogen dependent growth of MCF7-cell derived tumor xenografts
Mice bearing MCF7 xenograft tumors were randomized (11–12 mice per group) at 0.2±0.025cm3 tumor volume to receive continued E2 stimulation (E2 alone), treatment with E2 together with either BZA (sc pellet) or ICI (weekly injection) or E2 withdrawal (pellet removed) together with BZA treatment (BZA alone). A) Days required for tumors to reach 0.8 cm3 by Kaplan Meier analysis. Logrank test indicated significance (p<0.0001) in comparison of all treatments to the estrogen control. Differences observed between the E2+ICI and E2+BZA groups were not significant. B) Tumor growth for each group is presented as the average tumor volume for each treatment group +/− SEM at each day of treatment, with the initial day of treatment at randomization considered to be day 0. Non-linear regression analysis for each growth curve is presented. C) Average doubling time for tumors within each group. Data for each replicate was fitted to an exponential growth regression model [Y=Start*exp(K*X), where we constrained the Start to being shared between all groups]. Doubling time was estimated from these curves and plotted as mean +/−SEM. Non-parametric Kruskal-Wallis analysis followed by the Dunn's test indicated significant differences (P< 0.0001) between both groups and E2. D) ER expression detected by immunoblot of whole cell extracts from tumors harvested from four representative mice from each group. Relative density (Rel Dens) of detected bands were calculated by mean density*pixels and normalized to, and expressed as a percentage of, the average density detected for the vehicle treated samples. E) MCF7 cells were treated for 24 hours with vehicle, 17β-estradiol (1nM) or 4OHT (10nM) in the presence or absence of ICI or BZA (100nM). AGR2 mRNA expression was detected and normalized as in Figure 1.
Figure 3
Figure 3. BZA attenuates ER dependent growth of tamoxifen resistant breast tumor xenografts
A) Average tumor volume of tamoxifen resistant xenograft tumors implanted with or without tamoxifen stimulation (5 mg sc pellet). B–D) When Tam stimulated tumors attained 0.2±0.025cm3 tumor volume, animals were randomized (8–10 mice per group) to receive continued tamoxifen stimulation (tam alone) or treatment with Tam together with BZA (5mg sc pellet). B) Days required for tumors in each group to reach 0.5 cm3 volume (Kaplan Meier analysis). Logrank test indicated significant difference (p=0.0175). C) Tumor growth for each group is presented as average tumor volume +/− SEM per study arm at each day of treatment, with the initial day of treatment at randomization considered to be day 0. Tumor volume for the unstimulated (no hormone) group is plotted corresponding to the first day of treatment for the +/− BZA groups. Non-linear regression analysis for each growth curve is presented D) Average doubling time for tumors in each group. Data for each replicate was fitted to an exponential growth regression model [Y=Start*exp(K*X), where we constrained the Start to being shared between all groups]. Doubling time was estimated from these curves and plotted as mean +/−SEM. Non-parametric Mann Whitney test indicated a significant difference (P=0.0207) between Tam and Tam+BZA. E) ER expression detected by immunoblot of whole cell extracts of tumors harvested from four representative mice from each group. Relative density (Rel Dens) was calculated as in Figure 2. F) Average expression level (+/− SEM) of tamoxifen regulated genes in tumors (n=8–10) from each treatment group. mRNA levels were detected and normalized to human 36B4 as in Figure 1. Data are plotted relative to the tamoxifen treated group. Graph – exp 558
Figure 4
Figure 4. BZA reduces ERα expression in ERα-positive breast cancer cells
MCF7 (A) and BT483 (B) breast cancer cells were treated for 8 or 24 hours with E2 (100 nM) or ER antagonists (1 μM). ERα levels in these whole cell extracts were analyzed by immunoblot.. C) MCF7 cells were pretreated 2 hours with MG132 (30μm) or cycloheximide (CHX – 10μg/ml) prior to 4 hours treatment with ER ligands (100nM E2, 1μM others). ER expression was analyzed by Western immunoblot analysis of whole cell extracts. D) MCF7 cells were treated for 2, 4 or 24 hours with 0.1 or 1μM E2, BZA, or ICI prior to RNA isolation and detection of ERα mRNA by RT-qPCR. ER mRNA levels were normalized to the housekeeping gene 36B4. E) MCF7 cells were treated for 24 hours with E2 (100nM) or SERDs (1μM) and ERα levels were analyzed as in (A). Loading controls for panels A–B are illustrated in Supplementary Figure S1. Relative density (Rel Dens) of blot images was calculated as in Figure 2, but normalized to, and expressed as a percentage of, the density detected for the vehicle treated control.
Figure 5
Figure 5. BZA dependent inhibition of ER-mediated transcriptional activity is not impacted by loss of ER turnover
A) MCF7 cells were treated for 24 hours with or without E2 (1nM) in the presence of the indicated SERDs (0.01–1 μM). mRNA expression of target gene GREB1 was detected as in Figure 1. B) MCF7 cells were treated for 24 hours with E2 (100nM) or SERDs (1μM) and ERα levels were analyzed by immunoblot. C–E) MCF7 cells were infected with ERα adenovirus (MOI 100) or mock infected prior to 24 hours treatment with E2 (100 nM) or other ligands (1μM). C) ERα levels were analyzed by immunoblotting of whole cell extracts. D–E) Expression of ER target genes in cells infected in parallel and treated 24 hours with E2 (10 nM) in the presence or absence of SERMs or ICI (1 μM) was analyzed by RT-qPCR as in Figure 1. F–G) MCF7 cells were infected as in C and treated with ligands (1μM) in the presence or absence of E2 (1nM) immediately, and 2 and 5 days following infection, with one replicate plate harvested prior to infection and 2, 5, and 7 days after infection. Cell proliferation in the absence (left) or presence (right) of estrogen was analyzed as in Figure 1. H) MCF7 cells were infected, treated with ligands, and harvested in parallel with F and G. ERα expression was analyzed as in C. Data are representative of at least 3 independent experiments. Relative density (Rel Dens) of blot images was calculated as in Figure 2, but normalized to, and expressed as a percentage of, the density detected for the vehicle treated control. For 5C, values are normalized to, and expressed as a percentage of, the vehicle treated uninfected sample. In 5H, values are normalized to, and expressed as a percentage of, the vehicle control for each MOI and time.

Similar articles

Cited by

References

    1. Kvinnsland S, Anker G, Dirix LY, Bonneterre J, Prove AM, Wilking N, et al. High activity and tolerability demonstrated for exemestane in postmenopausal women with metastatic breast cancer who had previously failed on tamoxifen treatment. Eur J Cancer. 2000;36:976–82. - PubMed
    1. Dodwell D, Wardley A, Johnston S. Postmenopausal advanced breast cancer: options for therapy after tamoxifen and aromatase inhibitors. Breast. 2006;15:584–94. - PubMed
    1. Goss PE, Ingle JN, Martino S, Robert NJ, Muss HB, Piccart MJ, et al. A randomized trial of letrozole in postmenopausal women after five years of tamoxifen therapy for early-stage breast cancer. N Engl J Med. 2003;349:1793–802. - PubMed
    1. Miller WR, Larionov AA. Understanding the mechanisms of aromatase inhibitor resistance. Breast cancer research : BCR. 2012;14:201. - PMC - PubMed
    1. Brodie A, Jelovac D, Sabnis G, Long B, Macedo L, Goloubeva O. Model systems: mechanisms involved in the loss of sensitivity to letrozole. J Steroid Biochem Mol Biol. 2005;95:41–8. - PubMed

Publication types

MeSH terms