. 2013 May 15;73(10):3155-67.
doi: 10.1158/0008-5472.CAN-12-3266. Epub 2013 Mar 27.

Trop-2 promotes prostate cancer metastasis by modulating β(1) integrin functions

Affiliations

Trop-2 promotes prostate cancer metastasis by modulating β(1) integrin functions

Marco Trerotola et al. Cancer Res. .

Abstract

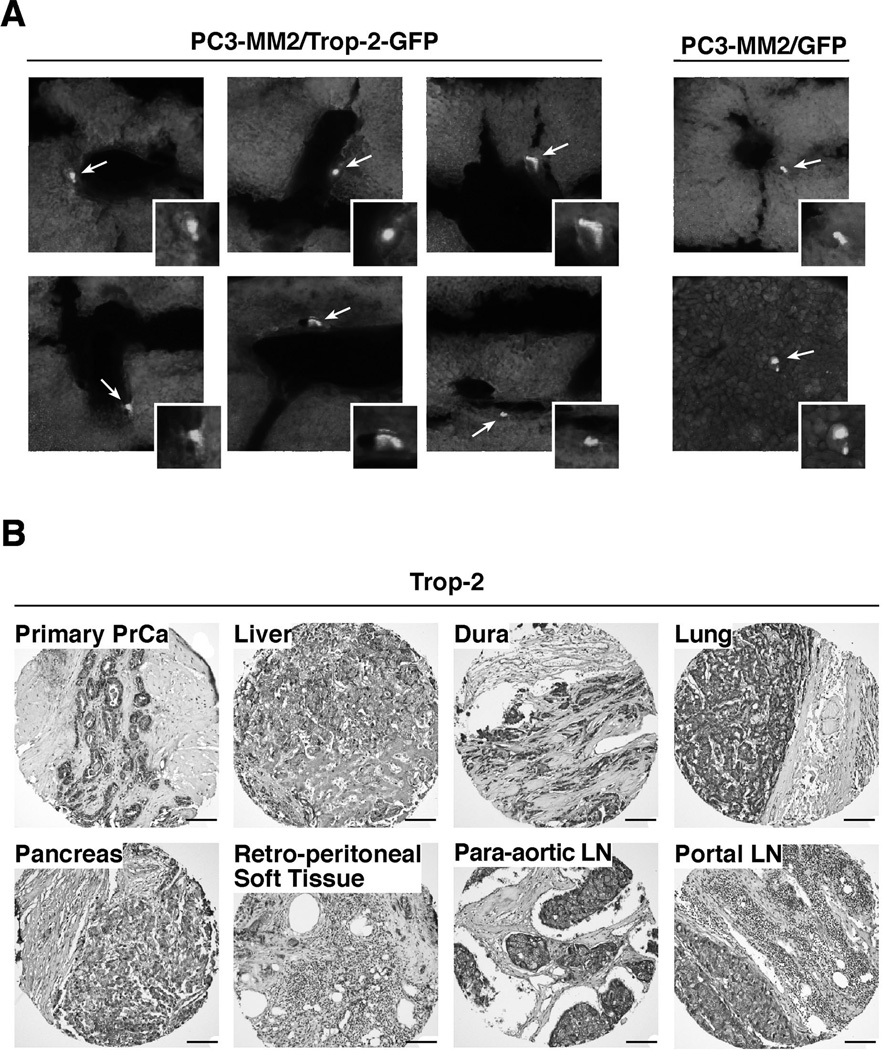
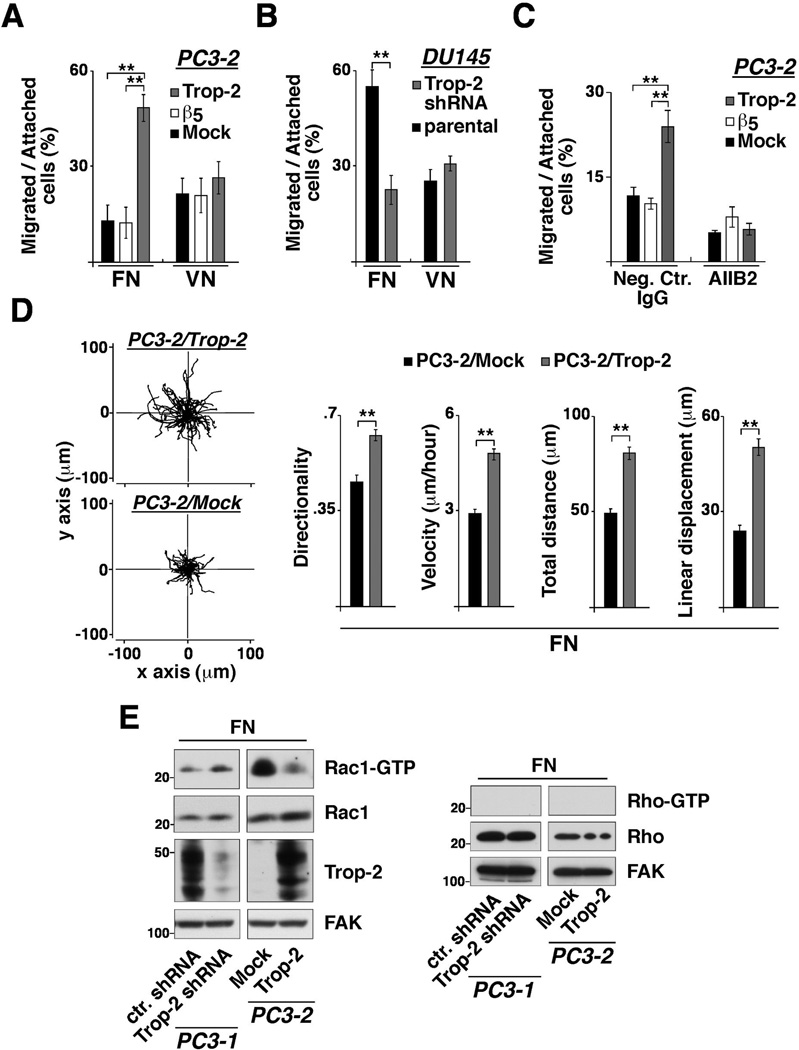
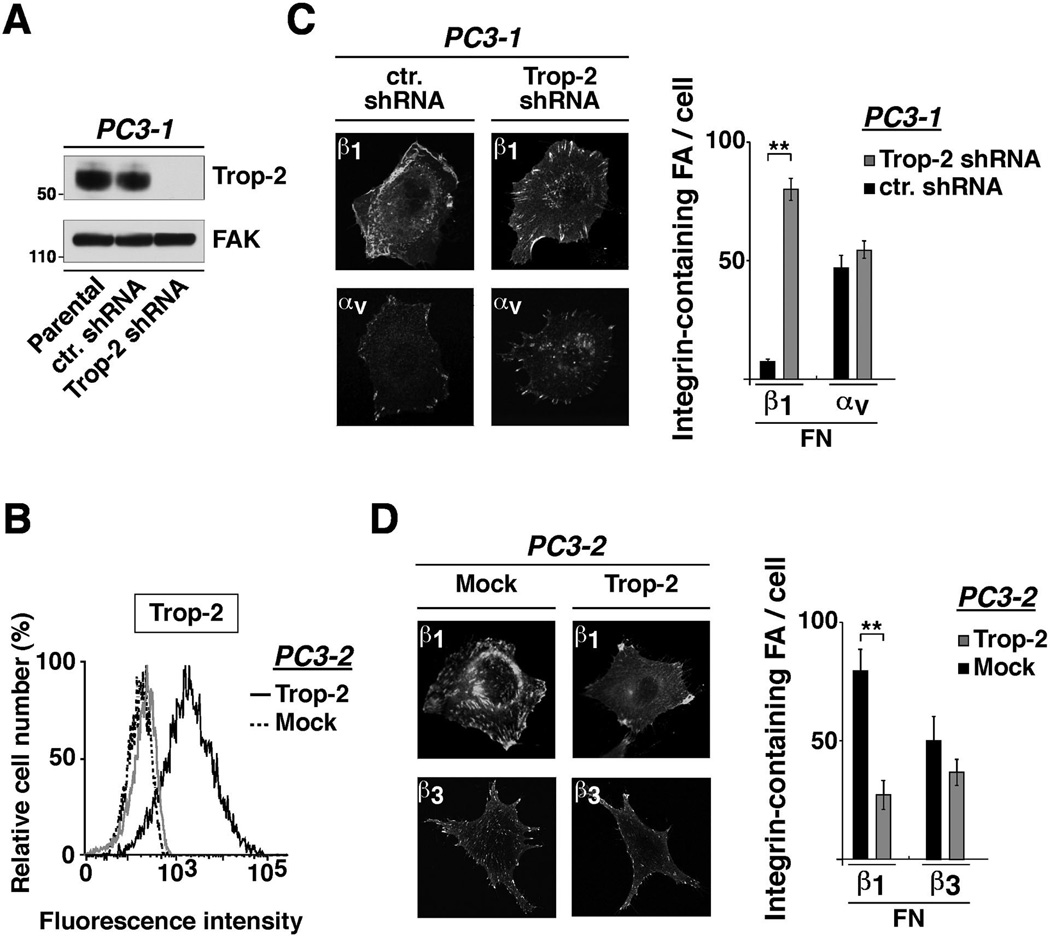
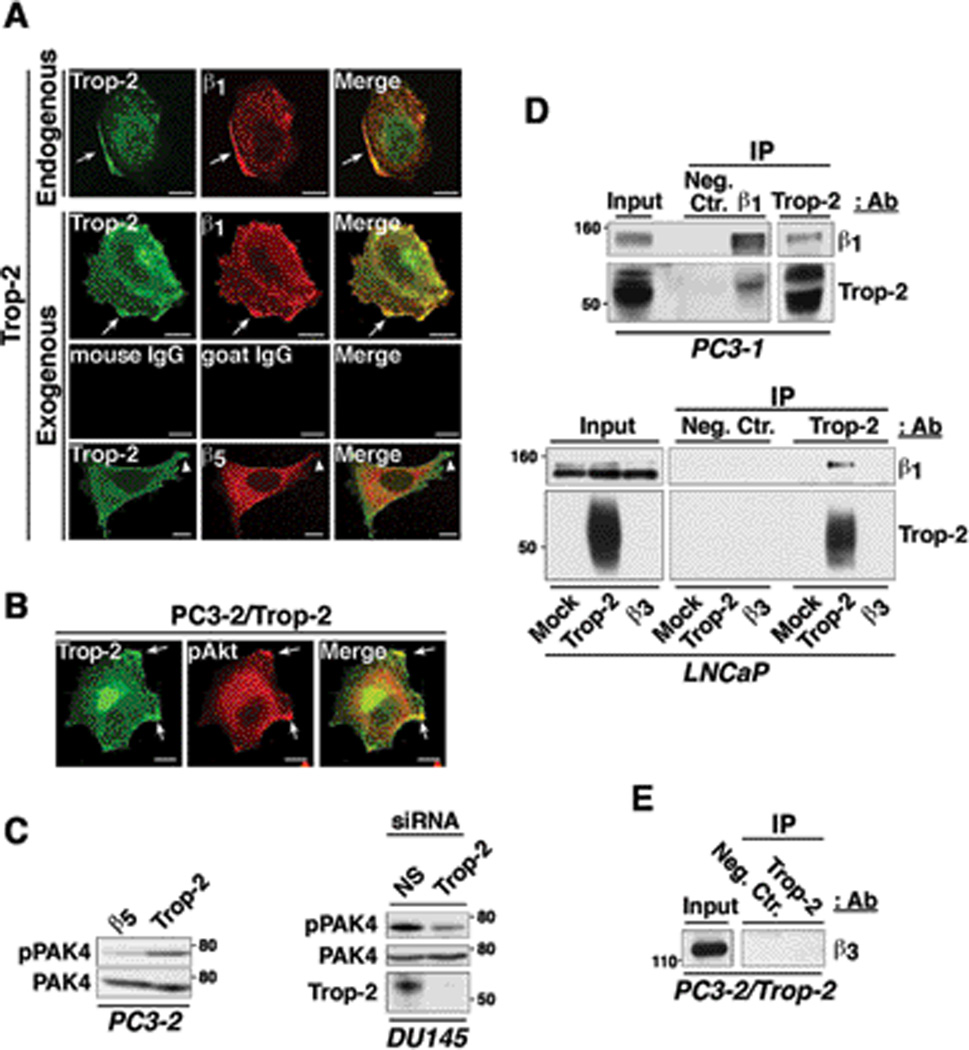
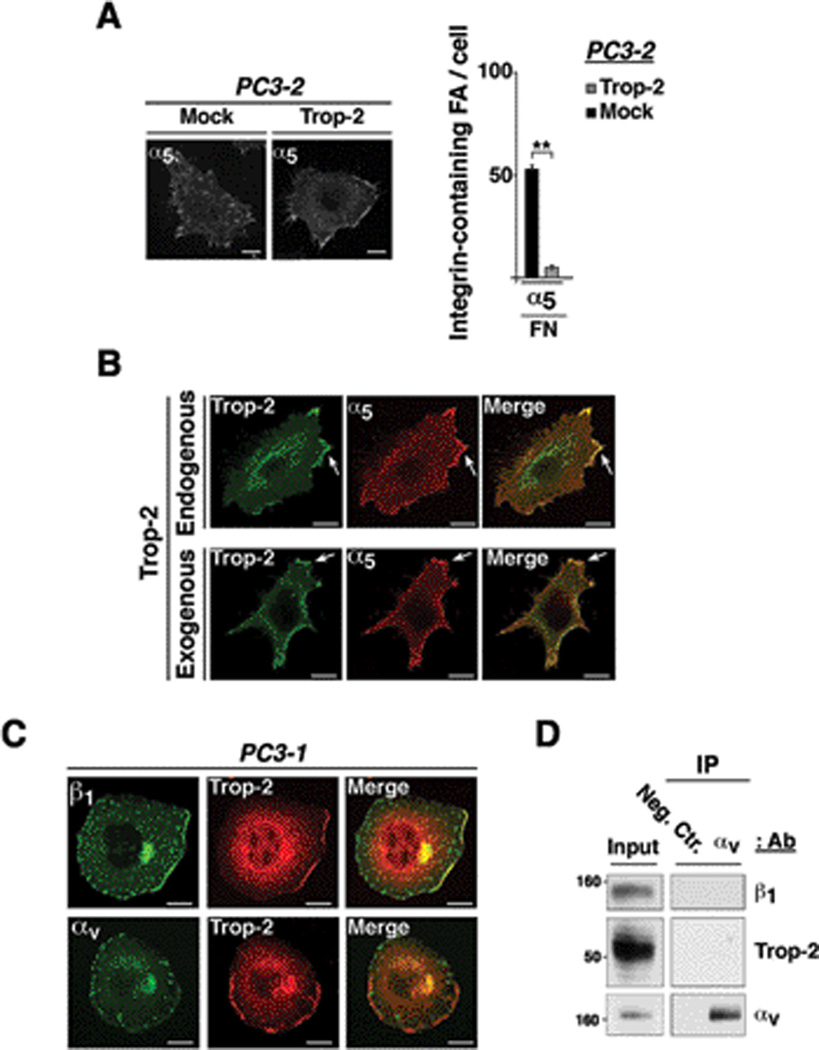
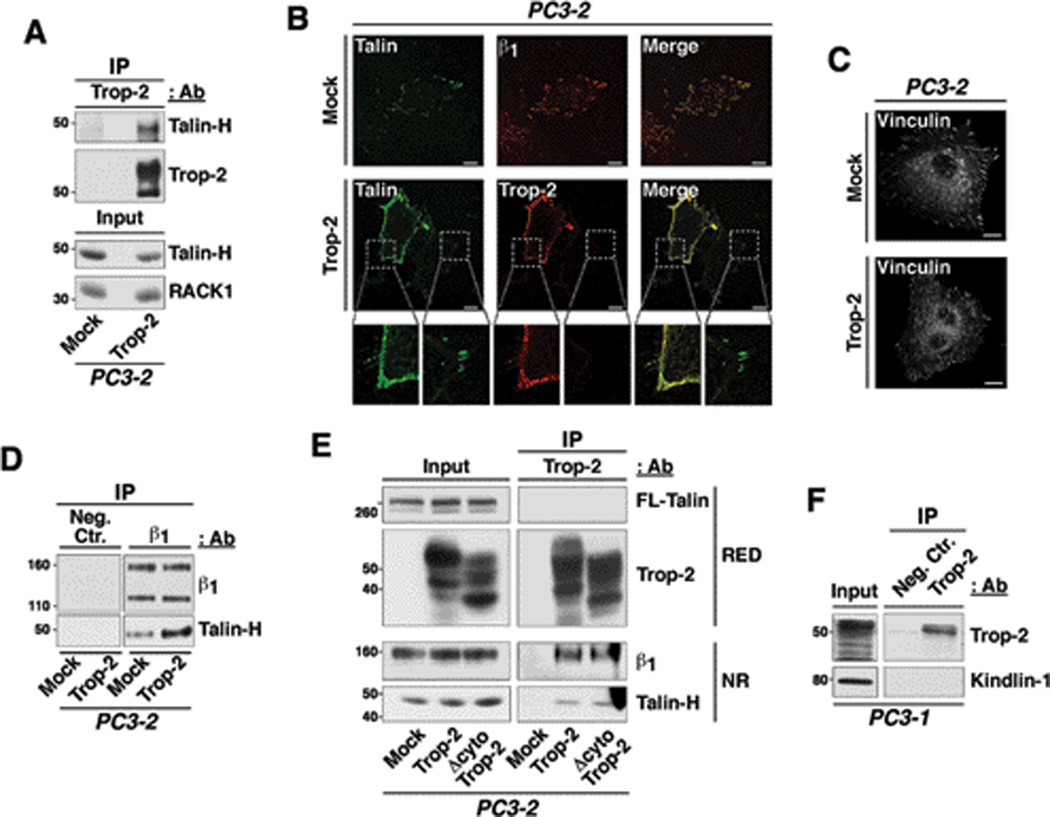
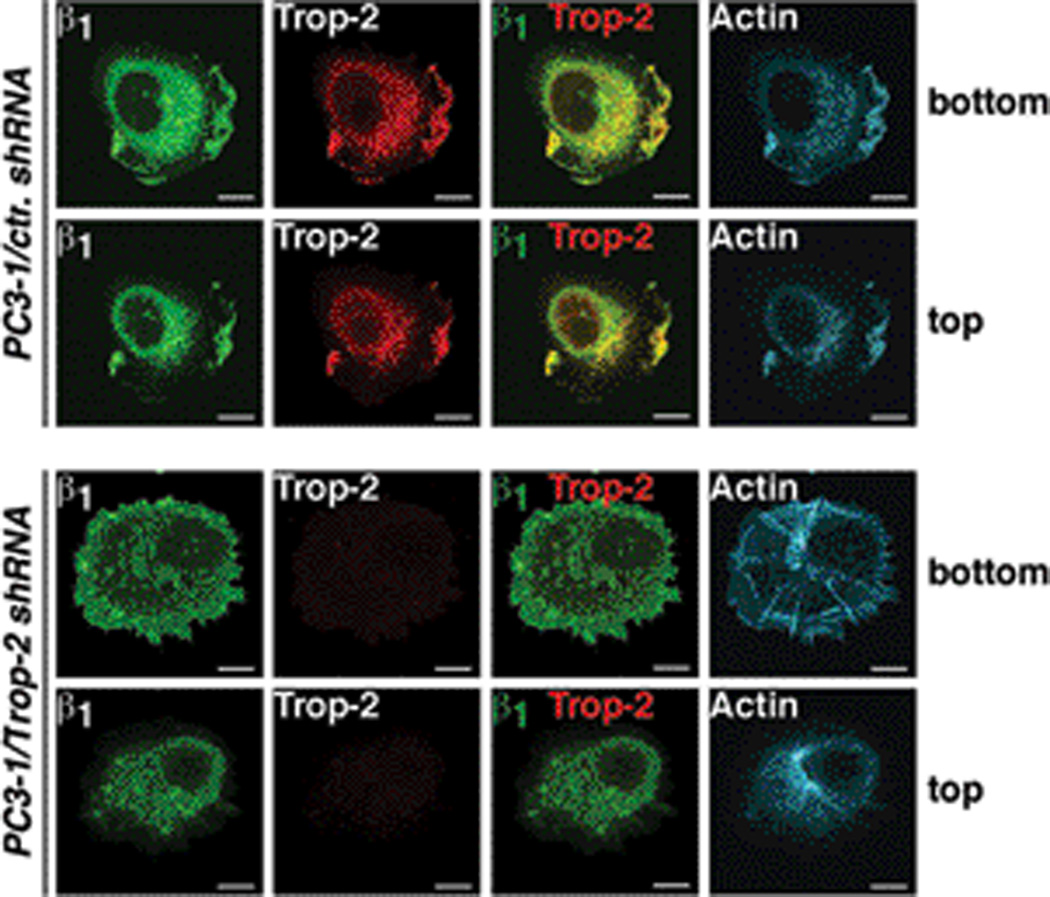
The molecular mechanisms underlying metastatic dissemination are still not completely understood. We have recently shown that β(1) integrin-dependent cell adhesion to fibronectin and signaling is affected by a transmembrane molecule, Trop-2, which is frequently upregulated in human carcinomas. Here, we report that Trop-2 promotes metastatic dissemination of prostate cancer cells in vivo and is abundantly expressed in metastasis from human prostate cancer. We also show here that Trop-2 promotes prostate cancer cell migration on fibronectin, a phenomenon dependent on β(1) integrins. Mechanistically, we demonstrate that Trop-2 and the α(5)β(1) integrin associate through their extracellular domains, causing relocalization of α(5)β(1) and the β(1)-associated molecule talin from focal adhesions to the leading edges. Trop-2 effect is specific as this molecule does not modulate migration on vitronectin, does not associate with the major vitronectin receptor, α(v)β(3) integrin, and does not affect localization of α(v)β(3) integrin as well as vinculin in focal adhesions. We show that Trop-2 enhances directional prostate cancer cell migration, through modulation of Rac1 GTPase activity. Finally, we show that Trop-2 induces activation of PAK4, a kinase that has been reported to mediate cancer cell migration. In conclusion, we provide the first evidence that β(1) integrin-dependent migratory and metastatic competence of prostate cancer cells is enhanced by Trop-2.


Conflict of interest statement

Conflicts of Interest: No potential conflicts of interest are disclosed.

Figures

Figure 1
Figure 1
Trop-2 induces prostate cancer cell dissemination in vivo and is abundantly expressed in human prostate cancer metastasis. A, PC3-MM2/Trop-2-GFP and PC3-MM2/GFP were injected in the left cardiac ventricle of SCID mice, and the presence of fluorescent cells in livers was quantified after 2 weeks. Representative pictures of PC3-MM2/Trop-2-GFP (left) and PC3-MM2/GFP (right) cells in the liver parenchyma are shown. Arrows and magnification boxes, fluorescent cells. B, Representative IHC images of Trop-2 expression in liver, dura, lung, pancreas, retro-peritoneal soft tissue, para-aortic LN and portal LN metastasis from prostate cancer patients are shown. Bars, 100 µm.
Figure 2
Figure 2
β1 integrin-dependent prostate cancer cell migration is enhanced by Trop-2. A, Migration assays were performed using PC3-2 transfectants seeded on FN- or VN-coated transwell chambers, as described in Materials and Methods. The fraction of cells migrated onto the bottom layer was calculated for each group of transfectants and expressed as percentage of total number of cells attached on both filter layers. Error bars, SEM. **, P<0.001. B, Migration assays were also performed using DU145/Trop-2 shRNA versus parental DU145 cells seeded on FN- or VN-coated transwell chambers. Error bars, SEM. **, P<0.001. C, Migration of PC3-2 transfectants on FN was assessed in the presence of AIIB2, an inhibitory Ab to β1 integrins. A non-immune rat IgG was used as negative control Ab. **, P<0.001. D, PC3-2/Trop-2 (top) and PC3-2/Mock (bottom) transfectants seeded on FN-coated plates were observed for 17 hours by time-lapse video microscopy; the movements of individual cells were followed using cell-tracking software, and the panels are presented as overlays of trajectories described by cells during their migration (left). Bar graphs show directionality, velocity, total distance migrated and linear displacement of PC3-2/Trop-2 (n=63 cells) and PC3-2/Mock (n=68 cells) transfectants extracted from the trajectories (right). Values are reported as means ± SEM. **, P<0.001. E, Rac1-GTP (left) and Rho-GTP (right) levels were measured in PC3-1/Trop-2 shRNA and ctr. shRNA cells, as well as in PC3-2/Trop-2 and Mock transfectants seeded on FN. Trop-2 expression was quantified in both groups of cell lines tested for Rac1 and Rho activity. FAK, control of protein loading.
Figure 3
Figure 3
β1 integrins are localized at the leading edges rather than focal adhesions in Trop-2 expressing cells. A, Trop-2 expression was evaluated by IB after shRNA-mediated silencing in PC3-1 cells. FAK, control of protein loading. B, Trop-2 expression levels in PC3-2 transfectants were evaluated by FACS (continuous black line). PC3-2/Mock stained with an Ab to Trop-2 (dotted black line), and PC3-2/Trop-2 stained with a non-immune mouse IgG (continuous gray line) were used as negative controls. C, Localization of β1 and αv in PC3-1/ctr. shRNA and PC3-1/Trop-2 shRNA cells seeded on FN was analyzed by IF (left). β1- and αv-containing focal adhesions were counted, and average numbers/cell are shown in the bar graph (right). Error bars, SEM. **, P<0.001. D, Localization of β1 and β3 integrins in PC3-2/Mock and PC3-2/Trop-2 transfectants seeded on FN was analyzed by IF (left). β1- and β3-containing focal adhesions were counted in the two groups of transfectants, and average numbers/cell are shown in the bar graph (right). Error bars, SEM. **, P<0.001.
Figure 4
Figure 4
The Trop-2/β1 integrin complex is accumulated in the leading edges of prostate cancer cells seeded on FN. A, PC3-1 cells, endogenously expressing Trop-2 (first row from top), and PC3-2/Trop-2 transfectants (second row from top) were seeded on FN and stained for Trop-2 (green) and β1 integrins (red). Arrows show co-localization of β1 and Trop-2 in membrane rims at the leading edges. Mouse IgG and goat IgG, negative control Abs for Trop-2 and β1, respectively (third row from top). PC3-2/Trop-2 transfectants seeded on FN were also stained for Trop-2 and β5 integrin. Arrowheads show Trop-2-containing membrane protrusions (green), with undetectable co-localization of β5 (red) (bottom row). B, PC3-2/Trop-2-GFP (green) transfectants were seeded on FN, then fixed and stained with an Ab to pAkt (Ser473) (red). Arrows, leading edges. A and B, Bars, 10 µm. C, Phosphorylation of PAK4 was analyzed by comparing PC3-2/Trop-2 transfectants with negative control cells (PC3-2/β5) (left). Phosphorylation of PAK4 was also analyzed in DU145 cells upon siRNA-mediated silencing of Trop-2. A non-silencing (NS) siRNA was used as negative control (right). Total PAK4, control of protein loading. D, β1 integrins and Trop-2 were immunoprecipitated from PC3-1 protein lysates; the immunoprecipitates were then analyzed by IB using a goat pAb against Trop-2 and a mAb against β1 integrins, respectively (top). Trop-2 was immunoprecipitated from LNCaP transfectant lysates, and the immunoprecipitates were then analyzed by IB using a goat pAb against β1 integrins. LNCaP/Trop-2 transfectants were compared with Mock or β3 integrin transfectants (bottom). E, Trop-2 was immunoprecipitated from PC3-2/Trop-2 cell lysates, and IB analysis was performed on the immunoprecipitates using an Ab against β3 integrin. D and E, A mouse IgG (Neg.Ctr.) was used as a negative control Ab for IP.
Figure 5
Figure 5
α5β1 integrin is accumulated in the leading edges of Trop-2 expressing cells. A, Localization of α5 in PC3-2/Mock and PC3-2/Trop-2 cells seeded on FN was analyzed by IF (left). α5-containing focal adhesions were counted, and average numbers/cell are shown in the bar graph (right). Error bars, SEM. **, P<0.001. B, DU145 cells, endogenously expressing Trop-2 (top panels), and PC3-2/Trop-2 transfectants (bottom panels) were seeded on FN and stained for Trop-2 (green) and α5 (red). Arrows show co-localization of α5 and Trop-2 in membrane rims at the leading edges. C, PC3-1 cells were seeded on FN, and co-localization of Trop-2 with β1 or αv integrins at the leading edges was assessed by confocal microscopy. A, B and C, Bars, 10 µm. D, PC3-1 cell lysates were immunoprecipitated using an Ab targeting αv integrins; β1, Trop-2 and αv were then detected by IB. A non-immune mouse IgG was used as a negative control Ab (Neg. Ctr.).
Figure 6
Figure 6
Trop-2 co-precipitates with and induces relocalization of talin from focal adhesions to cell edges. A, Trop-2 was immunoprecipitated from PC3-2/Mock and PC3-2/Trop-2 lysates; the immunoprecipitates were separated by non reducing SDS-PAGE and analyzed by IB using an anti talin-H Ab. B, Localization of talin was analyzed in ghosts of Mock and Trop-2 transfectants of PC3-2 cells, seeded on FN. Talin (green) is localized in focal adhesions of Mock cells, where β1 integrins (red) are also found (top panels). In Trop-2 transfectants, talin is localized in membrane rims together with Trop-2 (red) (middle panels). Magnified boxes show details of talin (green) localization in membrane rims and focal adhesions (bottom). Trop-2 localization in membrane rims is also shown (red). C, PC3-2/Mock and PC3-2/Trop-2 transfectants were seeded on FN, and then stained for vinculin. Localization of vinculin in peripheral and ventral focal adhesions is shown. B and C, Bars, 10 µm. D, β1 integrins were immunoprecipitated from PC3-2/Mock and PC3-2/Trop-2 protein lysates; the immunoprecipitates were then analyzed by IB in order to detect talin-H. A mouse IgG (Neg.Ctr.) was used as a negative control Ab for IP. E, Trop-2 was immunoprecipitated from PC3-2/Mock, PC3-2/Trop-2 and PC3-2/Δcyto Trop-2 protein lysates, and IB analysis was performed on the immunoprecipitates using mAbs against FL-talin and talin-H, and goat pAbs against Trop-2 and β1 integrins. RED, SDS-PAGE performed in reducing conditions. NR, SDS-PAGE performed in non-reducing conditions. F, Trop-2 was immunoprecipitated from PC3-1 protein lysates, and IB analysis was performed on the immunoprecipitates using a rabbit pAb against Kindlin-1. A mouse IgG (Neg.Ctr.) was used as a negative control Ab for IP.
Figure 7
Figure 7
Trop-2-dependent reorganization of actin cytoskeleton. PC3-1/ctr. shRNA (top rows) and PC3-1/Trop-2 shRNA (bottom rows) cells were stained with Abs against β1 integrins (green) and Trop-2 (red), as well as with phalloidin-TRITC in order to observe the actin cytoskeleton (cyan). Ventral (bottom) and dorsal (top) cell layers are shown.

References

    1. Siegel R, Naishadham D, Jemal A. Cancer statistics. CA Cancer J Clin. 2013;63:11–30. - PubMed
    1. Lu P, Weaver VM, Werb Z. The extracellular matrix: a dynamic niche in cancer progression. J Cell Biol. 2012;196:395–406. - PMC - PubMed
    1. Zhu H, Zhao J, Zhu B, Collazo J, Gal J, Shi P, et al. EMMPRIN regulates cytoskeleton reorganization and cell adhesion in prostate cancer. Prostate. 2012;72:72–81. - PMC - PubMed
    1. Lokeshwar VB, Cerwinka WH, Isoyama T, Lokeshwar BL. HYAL1 hyaluronidase in prostate cancer: a tumor promoter and suppressor. Cancer Res. 2005;65:7782–7789. - PubMed
    1. Hynes RO. Integrins: bidirectional, allosteric signaling machines. Cell. 2002;110:673–687. - PubMed

Publication types