. 2013 May 1;190(9):4640-9.
doi: 10.4049/jimmunol.1202312. Epub 2013 Mar 27.

Role of fatty-acid synthesis in dendritic cell generation and function

Affiliations

Role of fatty-acid synthesis in dendritic cell generation and function

Adeel Rehman et al. J Immunol. .

Abstract

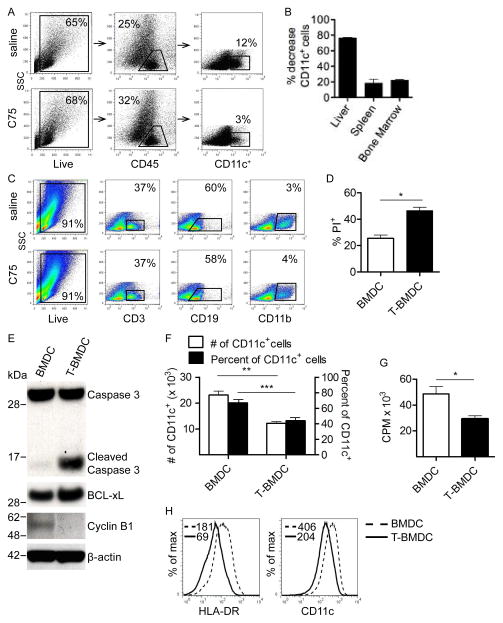
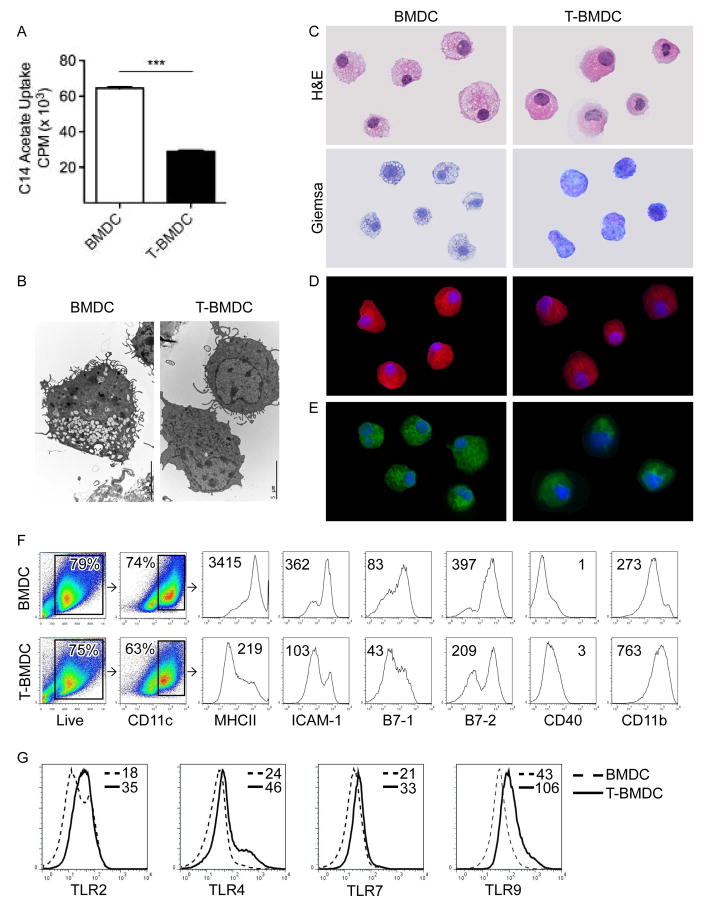
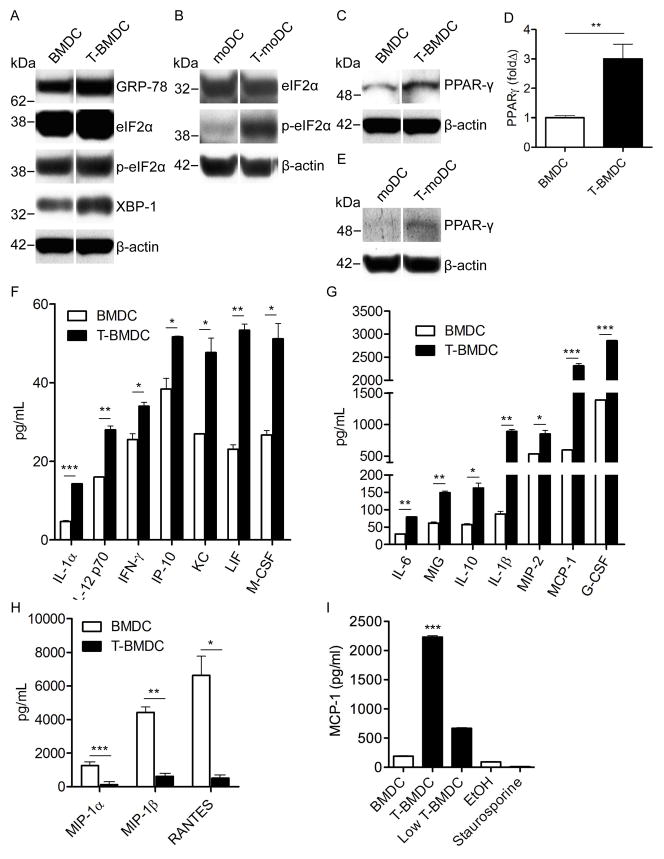
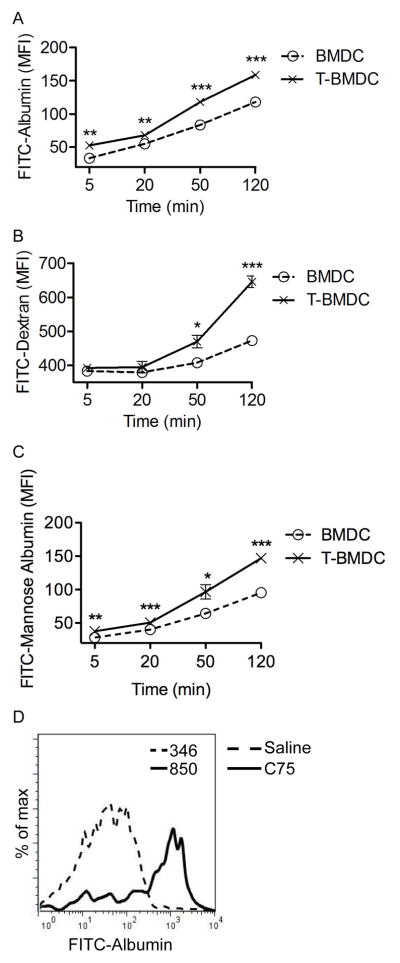
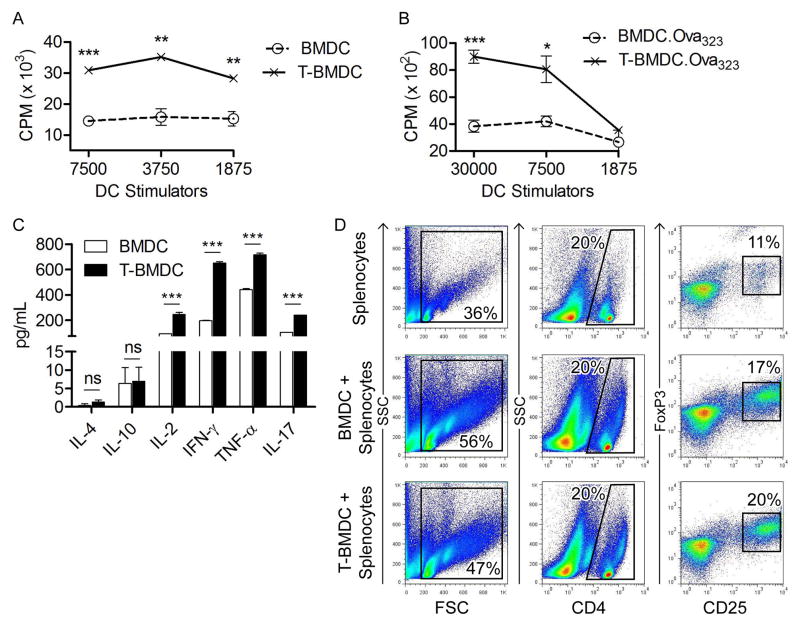
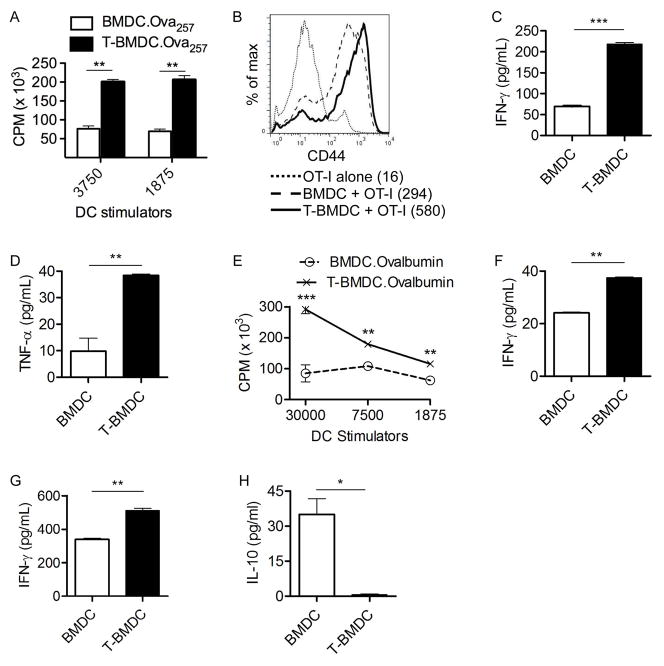
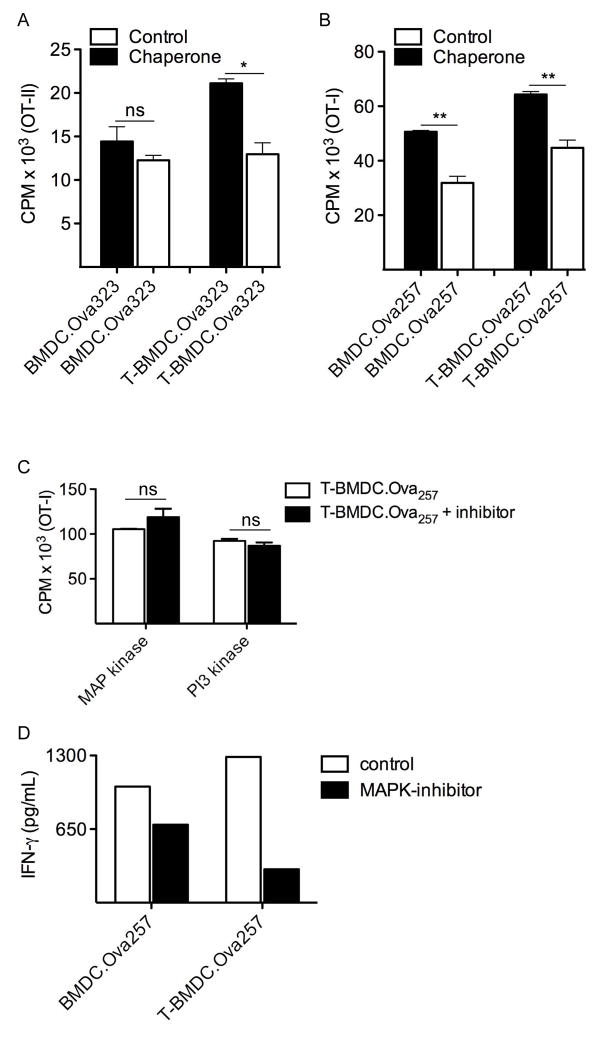
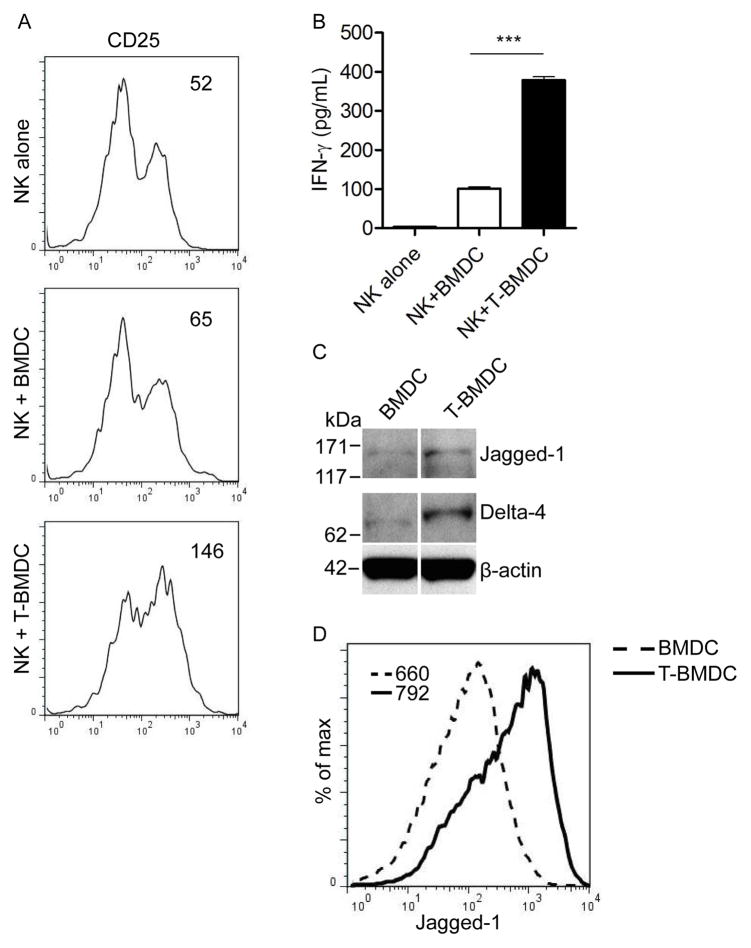
Dendritic cells (DC) are professional APCs that regulate innate and adaptive immunity. The role of fatty-acid synthesis in DC development and function is uncertain. We found that blockade of fatty-acid synthesis markedly decreases dendropoiesis in the liver and in primary and secondary lymphoid organs in mice. Human DC development from PBMC precursors was also diminished by blockade of fatty-acid synthesis. This was associated with higher rates of apoptosis in precursor cells and increased expression of cleaved caspase-3 and BCL-xL and downregulation of cyclin B1. Further, blockade of fatty-acid synthesis decreased DC expression of MHC class II, ICAM-1, B7-1, and B7-2 but increased their production of selected proinflammatory cytokines including IL-12 and MCP-1. Accordingly, inhibition of fatty-acid synthesis enhanced DC capacity to activate allogeneic as well as Ag-restricted CD4(+) and CD8(+) T cells and induce CTL responses. Further, blockade of fatty-acid synthesis increased DC expression of Notch ligands and enhanced their ability to activate NK cell immune phenotype and IFN-γ production. Because endoplasmic reticulum (ER) stress can augment the immunogenic function of APC, we postulated that this may account for the higher DC immunogenicity. We found that inhibition of fatty-acid synthesis resulted in elevated expression of numerous markers of ER stress in humans and mice and was associated with increased MAPK and Akt signaling. Further, lowering ER stress by 4-phenylbutyrate mitigated the enhanced immune stimulation associated with fatty-acid synthesis blockade. Our findings elucidate the role of fatty-acid synthesis in DC development and function and have implications to the design of DC vaccines for immunotherapy.


Figures

Figure 1
Figure 1. Blockade of fatty-acid synthesis inhibits dendropoiesis in mice and humans
(a–c) Mice were treated for four weeks with C75 or saline. (a) Live CD45+ liver leukocytes were gated using flow cytometry and the sub-fraction of hepatic CD11c+ cells was determined. (b) The percentage decrease in the number of liver, spleen, and bone marrow DC was calculated. (c) The fraction of splenocytes expressing CD3, CD19, and CD11b in saline- or C75-treated mice was tested. (d–g) BMDC were grown alone or with TOFA. (d) The fraction of PI+ cells was calculated on day 8 of culture. (e) Day 8 BMDC and T-BMDC were also tested for expression of Caspase 3, Cleaved Caspase 3, BCL-xL, Cyclin B1, and β-actin by Western blotting. (f) In addition, the total number and fraction of CD11c+ cells was calculated in day 8 BMDC and T-BMDC cultures. (g) Cellular proliferation was compared in day 8 BMDC and T-BMDC by pulsing with 3H-Thymidine. (h) moDC grown in control media and TOFA-enriched media were tested for HLA-DR and CD11c expression. Median fluorescence index (MFI) is indicated for each respective histogram (*p<0.05; **p<0.01; ***p<0.001).
Figure 2
Figure 2. Blockade of fatty-acid synthesis alters DC phenotype
(a) C-14 acetate uptake was compared in day 8 BMDC and T-BMDC cultures (***p<0.001). (b–e) Day 8 BMDC and T-BMDC were examined by (b) electron microscopy, (c) H&E and Gimsea staining, or (d) immunofluorescence using HCS LipidTOX Red which binds neutral lipids and (e) HCS LipidTOX Green which binds phospholipids. (f) CD11c+ cells in BMDC or T-BMDC cultures were gated and analyzed for expression of MHCII, adhesion, and co-stimulatory molecules as well as (g) TLR2, TLR4, TLR7, and TLR9. MFIs are indicated for each respective histogram.
Figure 3
Figure 3. Inhibition of fatty-acid synthesis during DC development increases ER stress and alters DC production of inflammatory mediators
(a) Expression of markers of ER stress (GRP-78, eIF2α, p- eIF2α, XBP-1) was tested in day 8 BMDC and T-BMDC by Western blotting. (b) Human moDC generated in control or TOFA-enriched media were tested for expression of selected ER stress markers. (c) Control or TOFA-treated murine BMDC were tested for expression of PPAR-γ by Western blotting and (d) PCR. (e) Human moDC generated in control media or TOFA-supplemented media were tested for expression of PPAR-γ by Western blotting. β-actin was used as a loading control. (f–h) 24 hour cell culture supernatants from day 8 BMDC and T-BMDC plated at equal densities were tested for the presence of numerous cytokines and chemokines. (i) Control BMDC, high-dose TOFA-treated BMDC, standard low-dose TOFA-treated BMDC, ethanol-trreated BMDC, and staurosporine-treated BMDC were tested for their capacity to produce MCP-1 (*p<0.05; **p<0.01; ***p<0.001).
Figure 4
Figure 4. Blockade of fatty-acid synthesis enhances DC capacity for antigen capture in vitro and in vivo
(a–c) BMDC and T-BMDC were tested at various time points for uptake of fluorescent (a) Albumin, (b) Dextran, and (c) Mannosylated Albumin (*p<0.05; **p<0.01; ***p<0.001). (d) Splenic CD11c+ cells from control or C75 treated mice were tested for uptake of FITC-Albumin at 30 minutes after in vivo administration. Data are representative of experiments performed 3 times.
Figure 5
Figure 5. T-BMDC induce enhanced allogeneic and antigen-restricted CD4+ T cell stimulation
(a) Various concentrations of BMDC and T-BMDC were tested for their ability to induce proliferation of allogeneic T cells in an MLR. (b, c) BMDC and T-BMDC pulsed with Ova323–339 peptide were tested for their ability to induce (b) antigen-restricted CD4+ T cell proliferation and (c) Th1, Th2, and Th17 cytokine production in OT-II T cells (*p<0.05; **p<0.01; ***p<0.001). (d) CD4+ T cell co-expression of CD25 and FoxP3 was tested at 96 hours after splenocytes were co-cultured in a 1:1 ratio with BMDC or T-BMDC.
Figure 6
Figure 6. T-BMDC induce enhanced CD8+ T cell activation
(a–d) BMDC and T-BMDC were loaded with Ova257–264 peptide and plated in various ratios with CD8+ OT-I T cells. (a) OT-I proliferation was measured by incorporation of 3H-Thymidine. (b) OT-I T cell expression of CD44 was measured on flow cytometry (MFI is indicated). (c) IFN-γ and (d) TNF-α production by CD8+ OT-I T cells was measured in cell culture supernatant. (e, f) To test DC capacity for cross-presentation, BMDC and T-BMDC were loaded with Ovalbumin and used in various ratios to stimulate CD8+ OT-I T cells. (e) OT-I cellular proliferation and (f) production of IFN-γ were measured. (g, h) Restimulated CTL cultures from mice twice-immunized by adoptive transfer of Ova257–264 peptide-pulsed BMDC or T-BMDC were tested for production of (g) IFN-γ and (h) IL-10 (*p<0.05; **p<0.01; ***p<0.001).
Figure 7
Figure 7. Lowering ER stress reduces the enhanced T cell stimulatory capacity of T-BMDC
(a, b) BMDC or T-BMDC (1×10⁴) were loaded with the appropriate Ova peptide and used to stimulate (a) CD4+ OT-II T cells or (b) CD8+ OT-I T cells, respectively, for 72h. In selected experiments, DC were pre-incubated with the chaperone 4-phenylbutyrate (*p<0.05; **p<0.01). (c) OTI-I T cell stimulation assays were repeated using soluble PI3 Kinase and MAP Kinase inhibitors. T cell proliferation was measured by incorporation of 3H-Thymidine during the last 24h. (d) OT-I T cell activation after stimulation by peptide-pulsed BMDC in the context of MAP kinase inhibition or control was measured by production of IFN-γ. Representative data is shown from experiments repeated three times.
Figure 8
Figure 8. T-BMDC have enhanced capacity for NK cell activation
(a–d) Spleen NK cells were harvested and co-incubated with BMDC or T-BMDC. NK cell (a) expression of CD25 (MFI is indicated), (b) production of IFN-γ (***p<0.001), (c, d) and expression of Notch ligands were measured by (c) Western blotting (Jagged-1, Delta-4) and (d) flow cytometry (Jagged-1).

Similar articles

Cited by

References

    1. Steinman RM, Banchereau J. Taking dendritic cells into medicine. Nature. 2007;449:419–426. - PubMed
    1. Zeyda M, Saemann MD, Stuhlmeier KM, Mascher DG, Nowotny PN, Zlabinger GJ, Waldhausl W, Stulnig TM. Polyunsaturated fatty acids block dendritic cell activation and function independently of NF-kappaB activation. J Biol Chem. 2005;280:14293–14301. - PubMed
    1. Herber DL, Cao W, Nefedova Y, Novitskiy SV, Nagaraj S, Tyurin VA, Corzo A, Cho HI, Celis E, Lennox B, Knight SC, Padhya T, McCaffrey TV, McCaffrey JC, Antonia S, Fishman M, Ferris RL, Kagan VE, Gabrilovich DI. Lipid accumulation and dendritic cell dysfunction in cancer. Nat Med. 2010;16:880–886. - PMC - PubMed
    1. Miller G, Lahrs S, Pillarisetty VG, Shah AB, DeMatteo RP. Adenovirus infection enhances dendritic cell immunostimulatory properties and induces natural killer and T-cell-mediated tumor protection. Cancer Res. 2002;62:5260–5266. - PubMed
    1. Kapadia SB, Chisari FV. Hepatitis C virus RNA replication is regulated by host geranylgeranylation and fatty acids. P Natl Acad Sci USA. 2005;102:2561–2566. - PMC - PubMed

Publication types

MeSH terms