. 2013 May 1;190(9):4848-60.
doi: 10.4049/jimmunol.1200870. Epub 2013 Mar 27.

Tolerogenic Donor-Derived Dendritic Cells Risk Sensitization In Vivo owing to Processing and Presentation by Recipient APCs

Affiliations

Tolerogenic Donor-Derived Dendritic Cells Risk Sensitization In Vivo owing to Processing and Presentation by Recipient APCs

Lesley A Smyth et al. J Immunol. .

Abstract

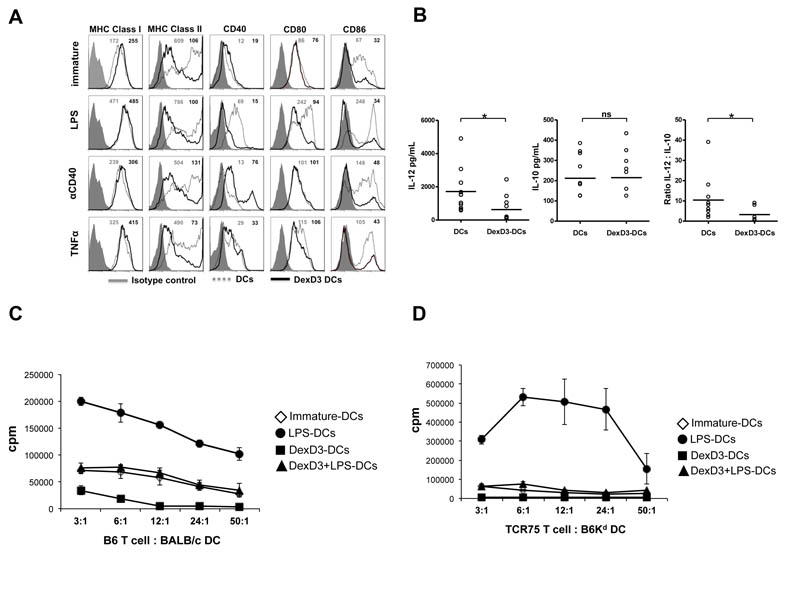
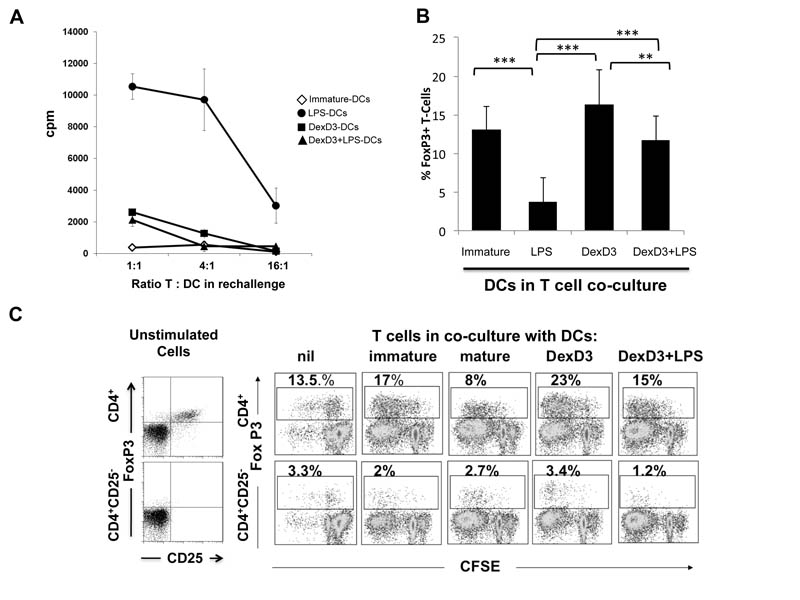
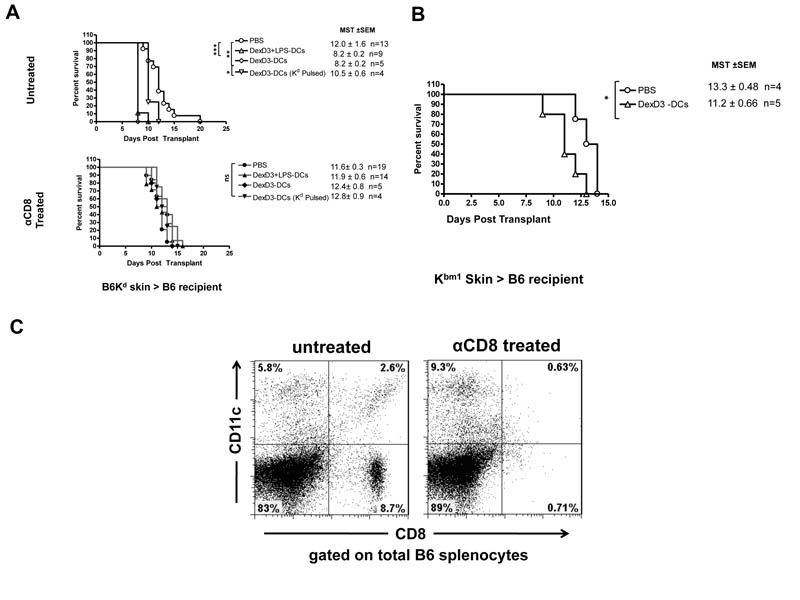
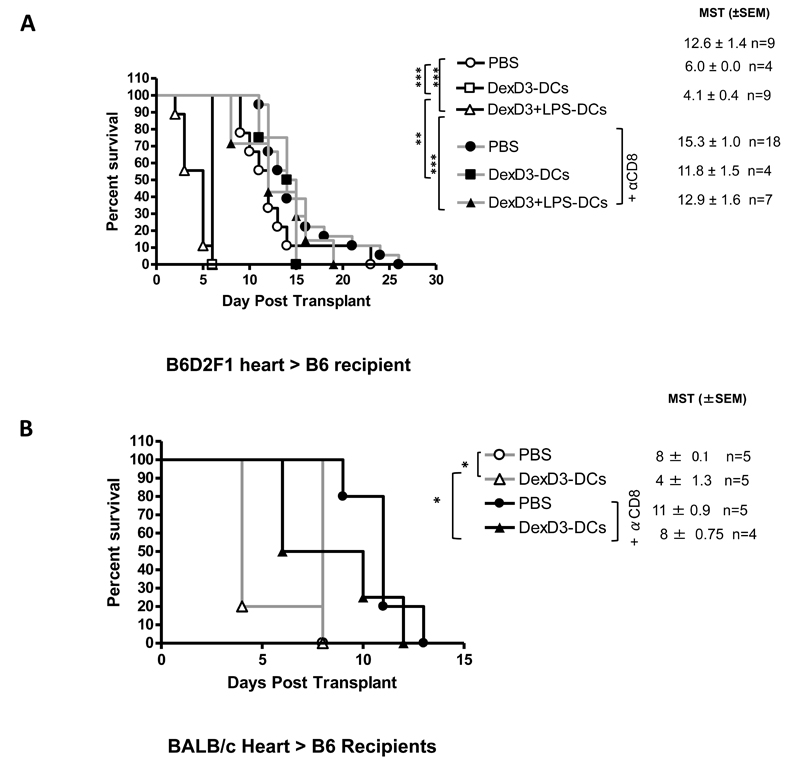
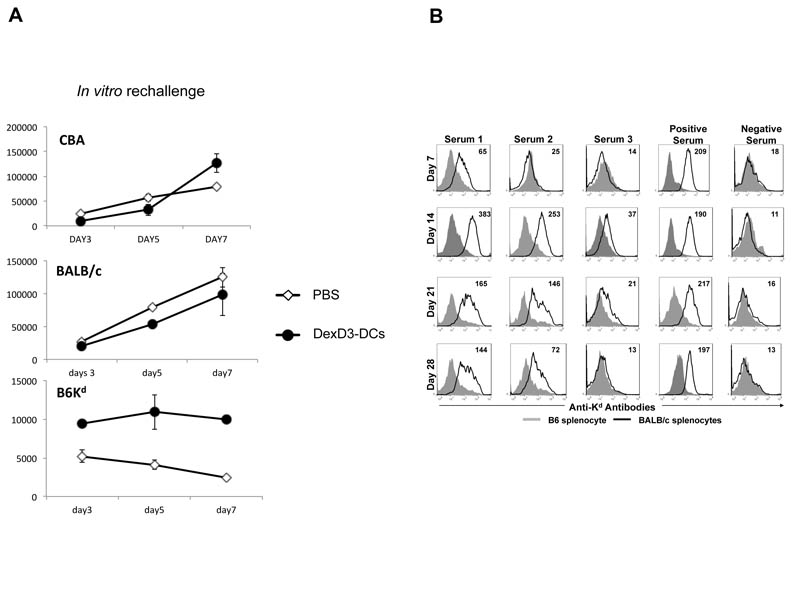
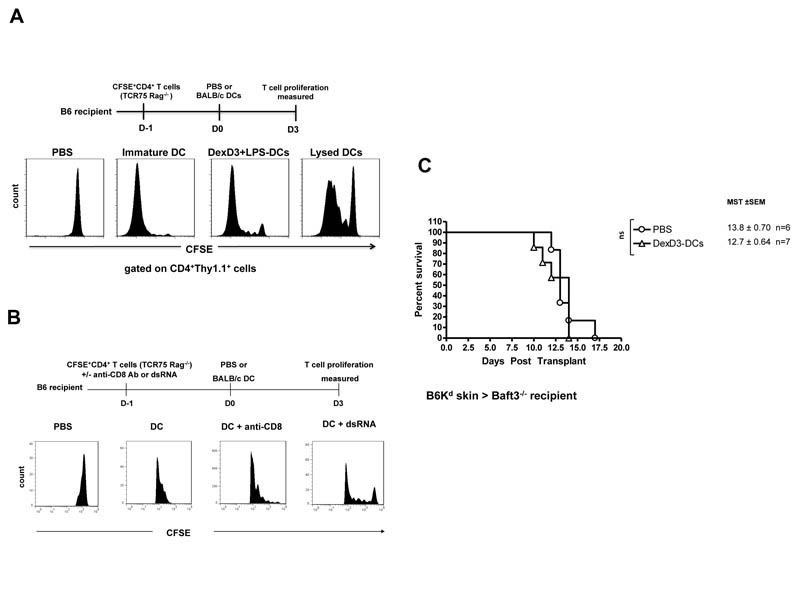
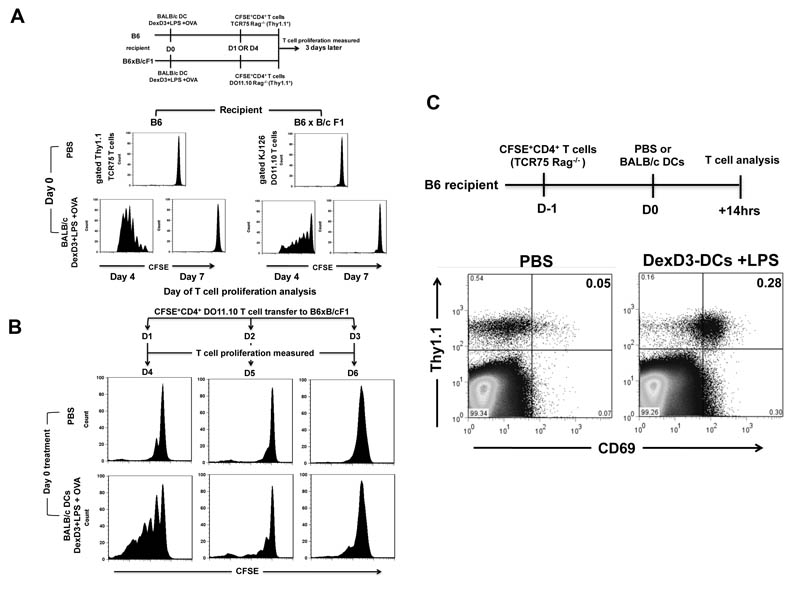
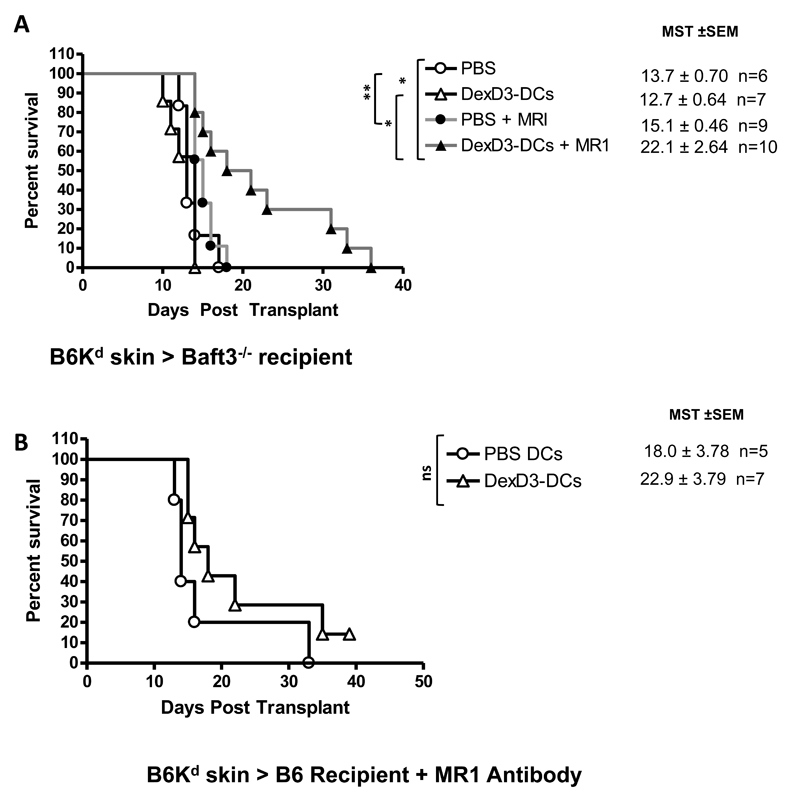
Modification of allogeneic dendritic cells (DCs) through drug treatment results in DCs with in vitro hallmarks of tolerogenicity. Despite these observations, using murine MHC-mismatched skin and heart transplant models, donor-derived drug-modified DCs not only failed to induce tolerance but also accelerated graft rejection. The latter was inhibited by injecting the recipient with anti-CD8 Ab, which removed both CD8(+) T cells and CD8(+) DCs. The discrepancy between in vitro and in vivo data could be explained, partly, by the presentation of drug-modified donor DC MHC alloantigens by recipient APCs and activation of recipient T cells with indirect allospecificity, leading to the induction of alloantibodies. Furthermore, allogeneic MHC molecules expressed by drug-treated DCs were rapidly processed and presented in peptide form by recipient APCs in vivo within hours of DC injection. Using TCR-transgenic T cells, Ag presentation of injected OVA-pulsed DCs was detectable for ≤ 3 d, whereas indirect presentation of MHC alloantigen by recipient APCs led to activation of T cells within 14 h and was partially inhibited by reducing the numbers of CD8(+) DCs in vivo. In support of this observation when mice lacking CD8(+) DCs were pretreated with drug-modified DCs prior to transplantation, skin graft rejection kinetics were similar to those in non-DC-treated controls. Of interest, when the same mice were treated with anti-CD40L blockade plus drug-modified DCs, skin graft survival was prolonged, suggesting endogenous DCs were responsible for T cell priming. Altogether, these findings highlight the risks and limitations of negative vaccination using alloantigen-bearing "tolerogenic" DCs.


Figures

Figure 1
Figure 1. DexD3-DCs are refractory to maturation and are inefficient APCs
BALB/c-DCs were grown in the presence or absence of Dex and D3 (DexD3-DCs) for 7 days. LPS, TNFα or anti-CD40 antibody were added for the last 24 hours of culture. Control drug treated DCs received no maturation stimuli. (A) DCs were stained for the expression of MHC class I, class II, CD40, CD80 and CD86 molecules using specific antibodies and analysed by flow cytometry. Isotype controls are shown as grey histograms. Untreated DexD3 treated DCs are shown as grey dashed lines whilst DexD3-DCs are shown as solid black lines. The MFI of both untreated (grey) and treated (black) is shown in the top right hand side of each panel. One representative experiment of 13 (LPS) and 3 (TNFα and anti-CD40 antibody) is shown. (B) Immature and DexD3-DCs were co-cultured for 18 hours, alone or with a CD40L-expressing cell line, supernatants from these co-cultures were used to detect production of IL-10 and IL-12p40/p70 by ELISA (*p<0.05). (C) DCs derived from BALB/c, treated or not with DexD3 and LPS [(LPS-matured DCs (closed circles), immature DCs (open diamonds), DexD3+LPS-DCs (closed triangles) and DexD3-DCs (closed squares)] were co-cultured with 1×10⁴ CD4+ T cells isolated from B6 mice at different ratios. T cell proliferation was measured after 72 hours following addition of 3H thymidine for the last 16 hours of culture. Proliferation is expressed as counts per minute (cpm) ± SD. One representative experiment is shown out of 3 performed. (D) DCs derived from B6Kd mice, treated or not with DexD3 and LPS [(LPS-matured DCs (closed circles), immature DCs (open diamonds), DexD3+LPS-DCs (closed triangles) and DexD3-DCs (closed squares)] were co-cultured with 1×10⁴ CD4+ T cells isolated from TCR75 Rag−/− mice at different ratios. T cell proliferation was measured after 72 hours following addition of 3H thymidine for the last 16 hours of culture. Proliferation is expressed as counts per minute (cpm) ± SD. One representative experiment is shown out of 3 performed.
Figure 2
Figure 2. CD4+ T cells co-cultured with allogeneic DexD3-DCs are hypo-responsive to alloantigen re-challenge in vitro and preferentially expand CD4+25+ T cells
(A) CD4+ T cells (2 × 10⁵) from CBA mice were co-cultured with BALB/c derived DCs treated or not with DexD3 in the presence or absence of LPS [(LPS-matured DCs (closed circles), immature DCs (open diamonds), DexD3+LPS-DCs (closed triangles) and DexD3-DCs (closed squares)]. On day 6 of culture the CD4+ T cells were purified and re-stimulated with immature BALB/c DCs at different ratios. T cell proliferation was measured after 72 hours by addition of 3H thymidine for the last 16 hours. Proliferation is expressed as counts per minute (cpm) +/− SD. One representative experiment is shown out of 5 performed. (B) BALB/c DCs treated with or without DexD3 in the presence or absence of LPS were co-cultured with total CD4+ T cells (1×10⁶), derived from B6 mice, at a ratio of 1:10 in the presence of rIL-2 (200U/ml). On day 5, T cells were harvested and analysed for expression of CD4, CD25 and FoxP3 by flow cytometry. Data plotted is the mean percentage of FoxP3+ T cells detected after co-culture with DCs in 4 independent experiments. *** denotes p<0.001. (C) CFSE labelled total CD4+ T cells, or CD4+ T cells depleted of CD25+ cells (CD4+CD25) derived from B6 mice, were cultured with BALB/c DCs preparations as described in (B). On day 5, T cells were stained for expression of CD25 and FoxP3, and also analysed for CFSE dilution by flow cytometry. Data shown is representative of 3 independent experiments and shows the expansion (CD4+ T cells, top panels) and induction (CD4+CD25 T cells, bottom panels) of Foxp3+ Tregs after 5 days of co-culture with DCs.
Figure 3
Figure 3. DexD3-DCs pre-treatment enhances skin allograft rejection
(A) B6 mice were given 2×10⁶ B6Kd DCs treated or not with DexD3 in the presence or absence of LPS, or Kd-pulsed B6 DCs [DexD3-DCs Kd pulsed), via i.v. injection. Control mice received PBS. Seven days later these mice received a B6Kd skin transplant. In addition, some mice were treated with 250μgs of YTS169, an anti-CD8 depleting antibody, one day before and one day after the transplant (filled symbols). Mice were monitored daily and rejection was deemed to have occurred when no viable skin remained. The mean survival time (MST) + SEM is shown (*p<0.05 **p<0.01** p<0.001) and the number of animals per condition (n=). Data shown is representative of 2 independent experiments. (B) B6 mice were given 2×10⁶ DCs Kbm1 treated with DexD3 via i.v. injection. Control mice received PBS. Seven days later these mice received a Kbm1 skin transplant. Mice were monitored daily and rejection was deemed to have occurred when no viable skin remained. The mean survival time (MST) + SEM is shown and the number of animals per condition (n=5). (C) Mice treated with two doses of 250μgs of anti-CD8 antibody are depleted of both CD8+ T cells and also CD8+ DC subsets. Data shows analysis of total splenocytes, using flow cytometry after CD8 and CD11c staining, 2 days after the last anti-CD8 treatment and is representative of 2 independent experiments.
Figure 4
Figure 4. DexD3-DCs pre-treatment enhances heart allograft rejection
(A) B6 mice were given 2×10⁶ B6D2F1 DCs treated with DexD3 in the presence or absence of LPS or PBS via i.v. injection, followed by a B6D2F1 heart transplant 7 days later. Some mice received 250μg anti-CD8 antibody one day before and after the transplant. Results plotted show the mean survival time of allografts ±SEM, and are pooled data from 2 independent experiments. (B) B6 mice were injected with DexD3-BALB/c DCs or PBS before receiving a heart BALB/c transplant 7 days later. Some mice received 250μg anti-CD8 antibody one day before and after the transplant. Results plotted show the mean survival time of allografts ±SEM and n= number of mice.
Figure 5
Figure 5. Demonstration of in vivo priming of T cell responses with indirect allospecificity induced by DexD3-DC
(A) B6 mice received DexD3-BALB/c DCs or PBS (2×10⁶). Ten days later, 2×10⁴ CD4+ T cells isolated from recipient mice were stimulated with 1× 10⁴ DCs from BALB/c, B6Kd or CBA/Ca mice. Proliferation was measured on days 3, 5 and 7 of culture by addition of 3H thymidine for the last 16 hours. Proliferation is expressed as counts per minute (cpm) ± SD (* and + denote p < 0.05 c.f PBS and mature DCs respectively). One representative experiment is shown out of 3 performed. (B) B6 mice were injected with B6Kd DCs (2×10⁶) treated with DexD3 and sera collected after 7, 14, 21 and 30 days. Antibody production was evaluated by flow cytometric analysis using BALB/c splenocytes as target cells (black line) and B6 splenocytes as control ones (shaded histograms). The MFI of Ab response to BALB/c splenocytes (black) is shown in the top right hand side of each panel. Experiment represents one of two experiments.
Figure 6
Figure 6. Allogeneic “tolerogenic” DCs injected in vivo provide alloantigens for T cells with indirect allospecificity
(A) B6 mice received 2×10⁶ CFSE labelled CD4+ T cells isolated from TCR75 Rag−/− mice. 24 hours later these mice received 2×10⁶ of immature, DexD3+LPS-BALB/c DCs, lysed BALB/c DCs or PBS. 3 days later CD4+ T cells were isolated from spleen and LNs and stained with anti-Thy1.1 antibody to identify the adoptively transferred T cells. Cells were analysed by flow cytometry. Data represents the expression of Thy1.1 and CFSE on CD4+ T cells. One representative experiment is shown out of 4 performed. (B) The same protocol as above with the additional treatment of B6 mice either with 500μgs of anti-CD8 antibody or 100ngs of dsRNA the day prior to DC injection. (C) Baft3−/− mice were given 2×10⁶ B6Kd DCs treated with DexD3 via i.v. injection. Control mice received PBS. Seven days later mice were transplanted with skins derived from B6Kd mice. Mice were monitored daily and rejection was deemed to have occurred when no viable skin remained. The mean survival time (MST) + SEM is shown and the number of animals per condition (n). Data shown is representative of 2 independent experiments.
Figure 7
Figure 7. Tolerogenic donor DCs have a short life in vivo and are processed by recipient APC
(A) Recipient B6 and (B6xB/c) F1 mice were injected with DexD3+LPS-BALB/c DCs (2×10⁶) pulsed with 5μg/ml of OVA peptide. Control mice received PBS only. CD4+ T cell isolated from TCR75 Rag−/− or D011.10 Rag−/− mice were CFSE labelled and adoptively transferred (1.5×10⁶) on day 1 or day 4 following DC challenge into B6 or F1 mice, respectively. T cell proliferation was measured 3 days after T cells injection by flow cytometry. Histograms represent proliferation of CD4+ T cells identified using Thy1.1 (TCR75 Rag−/−) or KJ126 (D011.10 Rag−/−) specific antibodies (left and right panels respectively). One representative experiment is shown out of 3 performed. (B) Recipient F1 mice were injected with DexD3+LPS-BALB/c DCs (2×10⁶) pulsed with 2μgs/ml of OVA peptide. Controls received just PBS. CD4+ T cell isolated from D011.10 Rag−/− mice were CFSE labelled and adoptively transferred (4×10⁶) on day 1, 2 and 3 following DC challenge. T cell proliferation was measured 3 days later by flow cytometry. Histograms represent proliferation of CD4+ T cells identified using KJ126 specific antibodies. One representative experiment is shown out of 2 performed. (C) B6 mice received 2×10⁶ CD4+ T cells isolated from TCR75 Rag−/− mice. 24 hours later these mice received 2×10⁶ DexD3+LPS-DCs. Controls received PBS only. 14 hours later CD4+ T cells were isolated from spleen and LNs and stained with Thy1.1, to identify the adoptively transferred T cells, and CD69. Cells were analysed by flow cytometry. Data represents the expression of Thy1.1 and CD69 on CD4+ T cells. One representative experiment out of 3 performed.
Figure 8
Figure 8. Tolerogenic donor DCs induce skin transplant survival when recipient mice that lack CD8+ DCs are treated with anti-CD40L antibody therapy
Baft3−/− (A) and B6 (B) mice received 2×10⁶ B6Kd DCs treated with DexD3. Control mice received PBS. Seven days later mice received a B6Kd skin transplant. In addition, some mice were treated with 500μgs of MR1 4 and 7 days prior to, and on the day of transplantation (filled symbols). Mice were monitored daily and rejection was deemed to have occurred when no viable skin remained. The mean survival time (MST) + SEM is shown (*p<0.05 **p<0.01** p<0.001) and the number of animals per condition (n). Data shown represents 3 and 2 independent experiments, respectively.

Similar articles

Cited by

References

    1. Lechler RI, George AJT. Transplantation and Rejection. In: Male D, Brostoff J, Roth DB, Roitt I, editors. Immunology. 7th ed Mosby Elsevier; Philadelphia: 2006. pp. 383–399.
    1. Long E, Wood KJ. Regulatory T Cells in Transplantation: Transferring Mouse Studies to the Clinic. Transplantation. 2009;88:1050–1056. - PubMed
    1. Feng G, Chan T, Wood KJ, Bushell A. Donor reactive regulatory T cells. Curr Opin Organ Transplant. 2009;14:432–438. - PubMed
    1. Silk KM, Fairchild PJ. Harnessing dendritic cells for the induction of transplantation tolerance. Curr Opin Organ Transplant. 2009;14:344–350. - PubMed
    1. Hackstein H, Thomson AW. Dendritic cells: emerging pharmacological targets of immunosuppressive drugs. Nat Rev Immunol. 2004;4:24–34. - PubMed

MeSH terms