. 2013 Jun;87(11):6441-54.
doi: 10.1128/JVI.00040-13. Epub 2013 Mar 27.

HIV-1 Gag associates with specific uropod-directed microdomains in a manner dependent on its MA highly basic region

Affiliations

HIV-1 Gag associates with specific uropod-directed microdomains in a manner dependent on its MA highly basic region

G Nicholas Llewellyn et al. J Virol. 2013 Jun.

Abstract

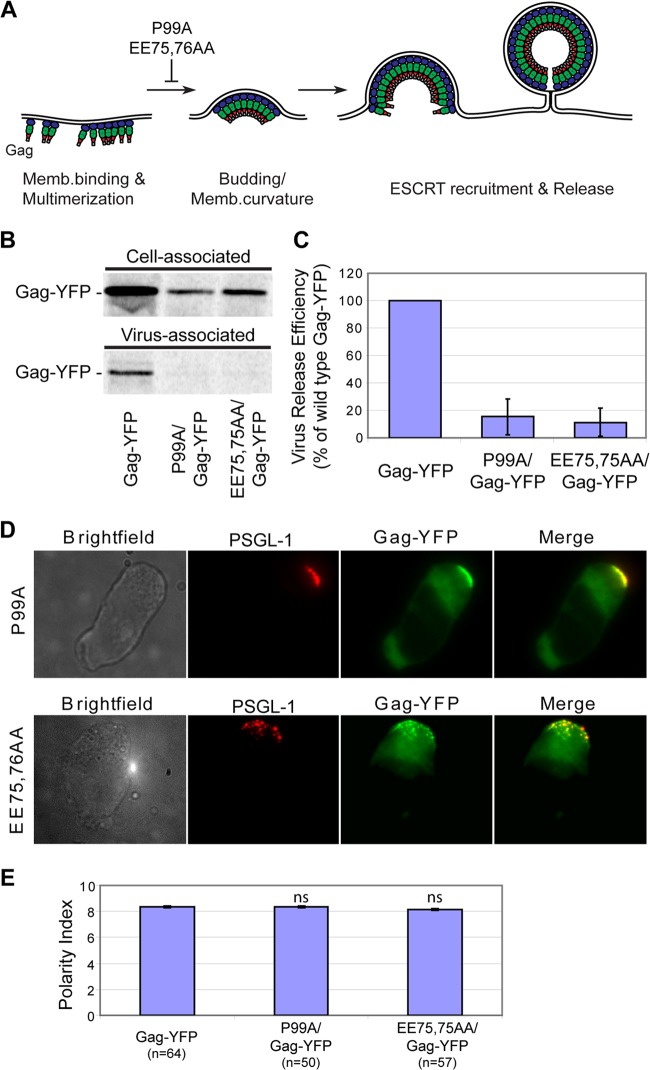
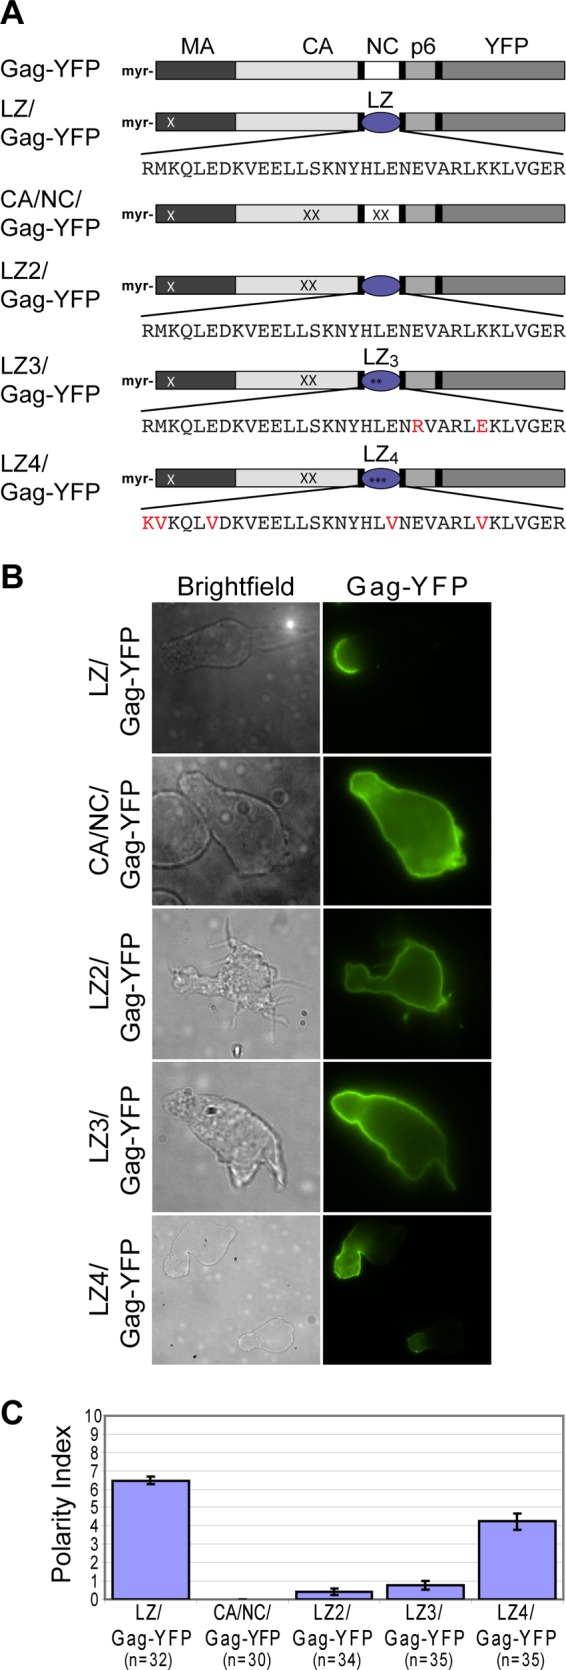
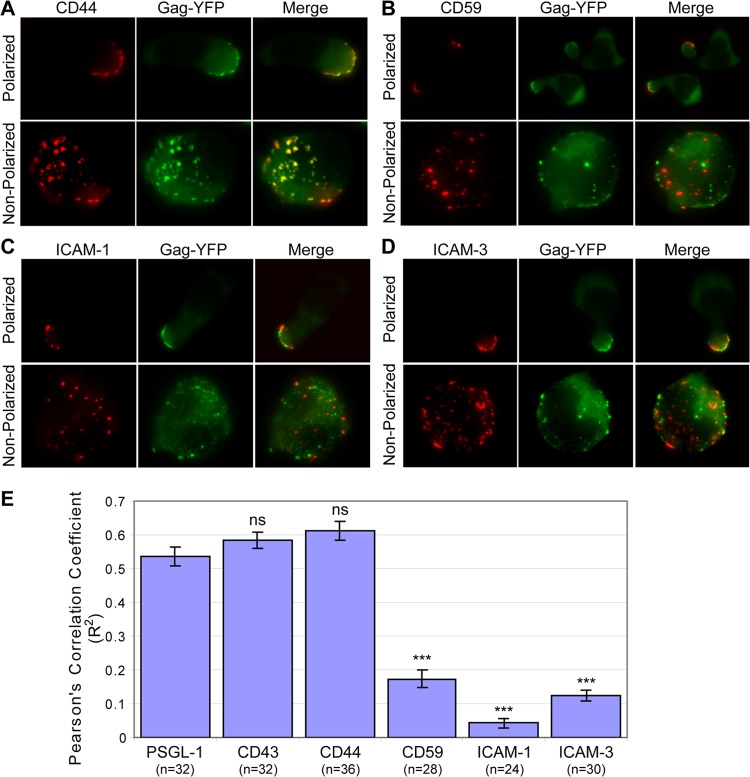
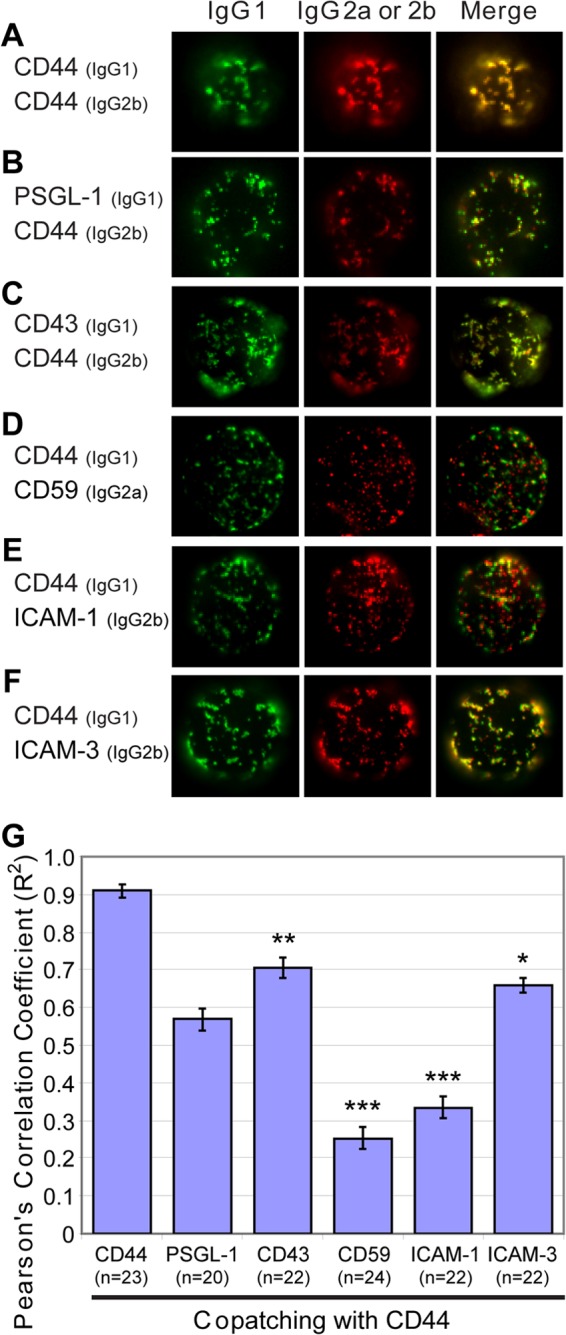
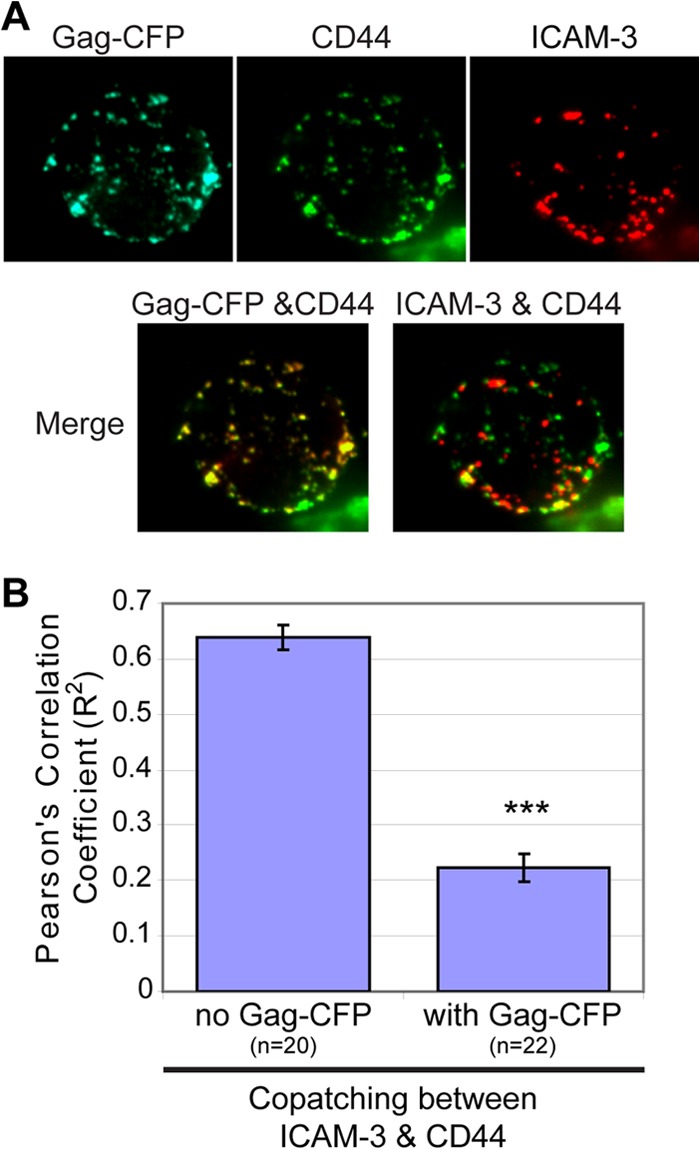
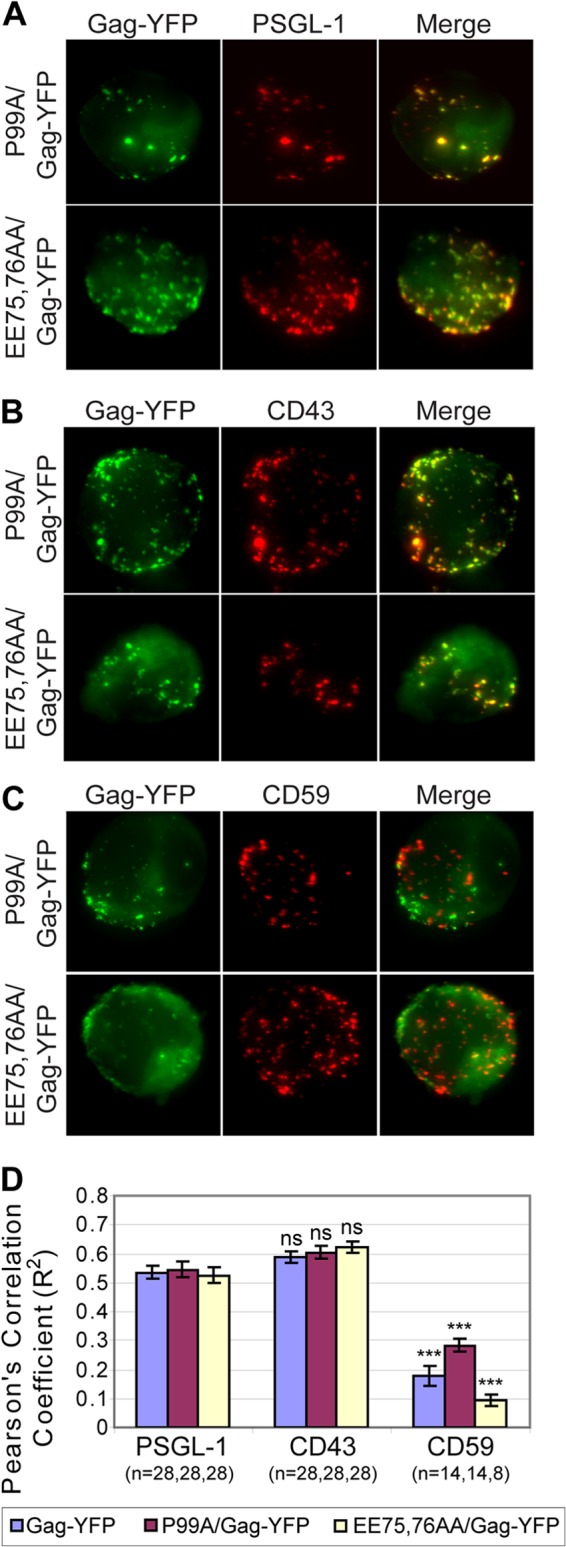
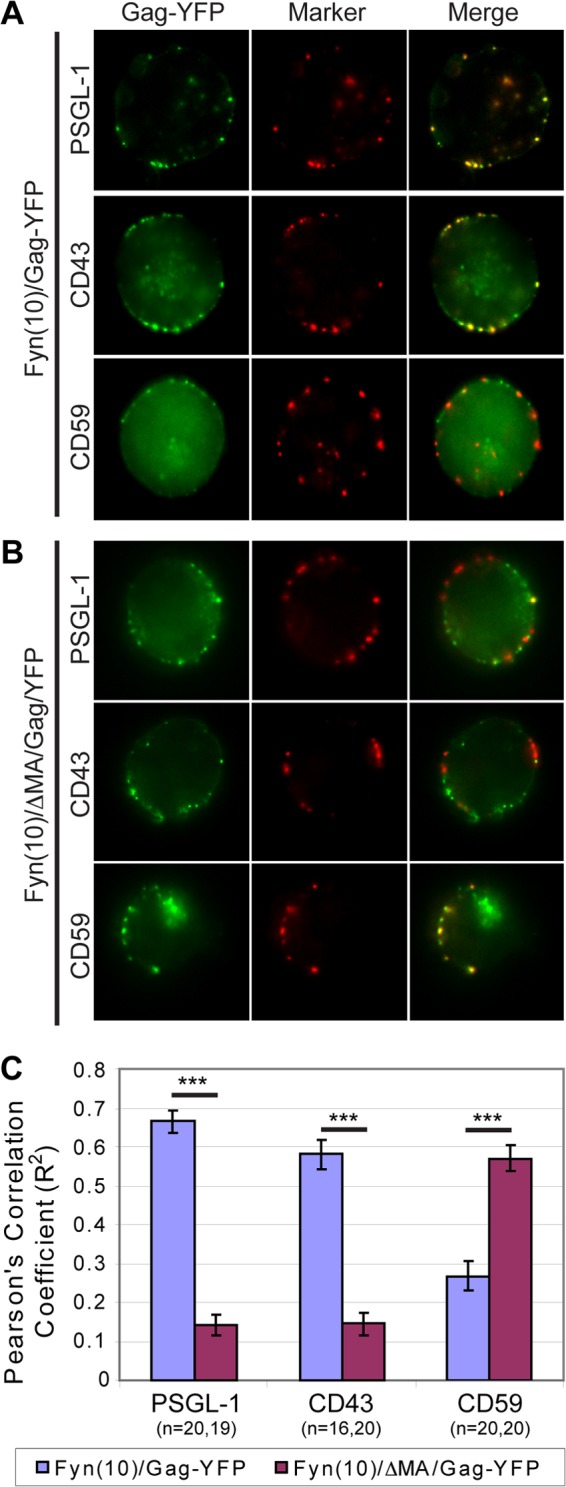
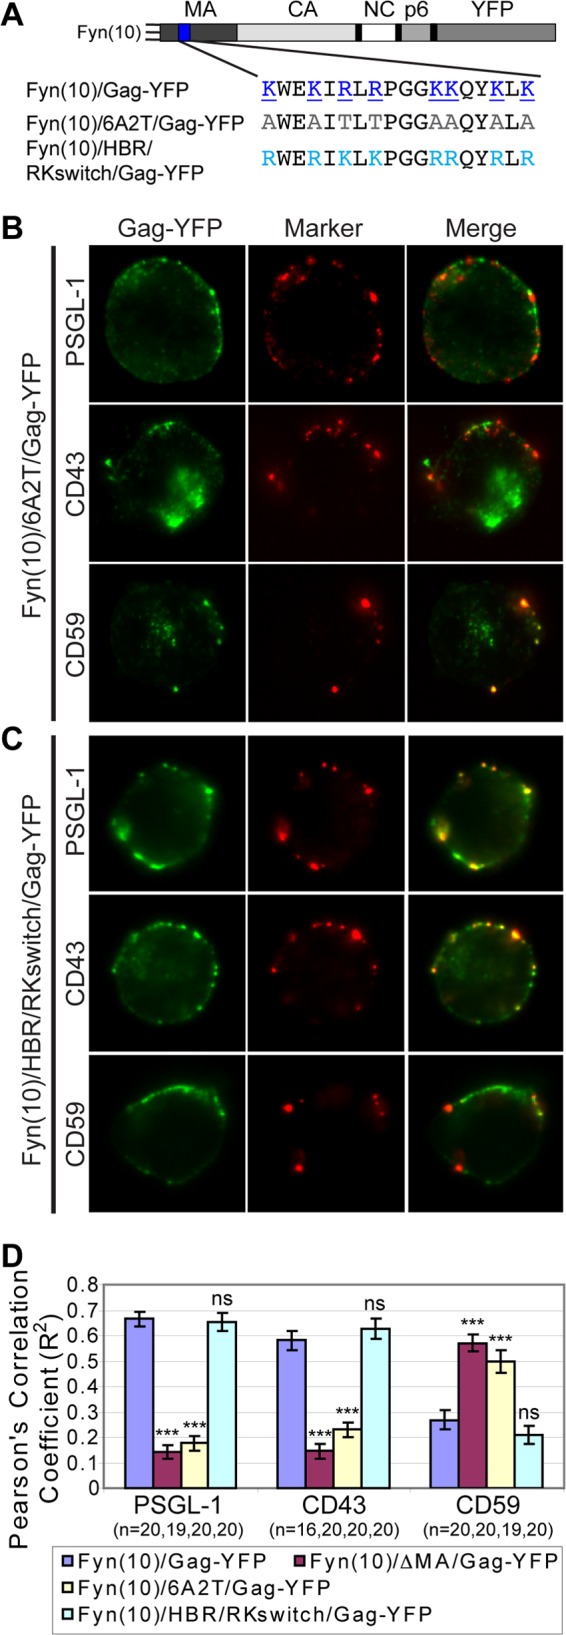
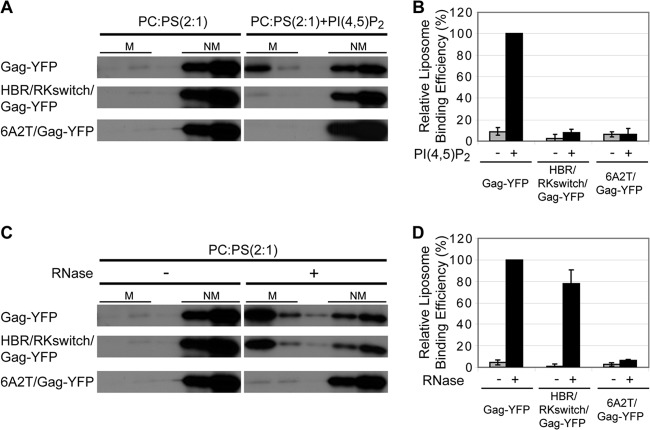
In polarized T cells, HIV-1 Gag localizes to a rear-end protrusion known as the uropod in a multimerization-dependent manner. Gag-laden uropods participate in formation of virological synapses, intercellular contact structures that play a key role in cell-to-cell HIV-1 transmission. Our previous observations suggest that Gag associates with uropod-directed microdomains (UDMs) that eventually comigrate with Gag to the uropod over the cell surface. However, the nature of Gag multimerization required for this movement, the composition of the UDMs, and the molecular determinants for Gag association with these microdomains remain unknown. In this study, we found that Gag multimerization prior to budding but beyond dimerization is necessary for Gag localization to the uropods, indicating that uropod localization occurs early in the assembly process. We also found that prior to membrane curvature, Gag multimers associate with a specific subset of UDMs containing PSGL-1, CD43, and CD44 but not ICAM-1, ICAM-3, or CD59. Notably, upon association, Gag excludes ICAM-3 from this subset of UDMs, revealing an active and selective reorganization of these microdomains by Gag. This specific association between Gag and UDMs is dependent on the highly basic region (HBR) in the Gag matrix (MA) domain. The overall positive charge of the HBR was needed for the interaction with the specific UDM subset, while the exact HBR sequence was not, unlike that seen for MA binding to the plasma membrane phospholipid phosphatidylinositol-(4,5)-bisphosphate [PI(4,5)P2]. Taken together, these findings revealed that HIV-1 Gag associates with specific microdomains present in polarized T cells in an MA-dependent manner, which results in modification of the microdomain constituents.


Figures

Fig 1
Fig 1
Membrane curvature or particle formation is not required for uropod localization. (A) An illustration indicating the virus assembly step that is inhibited by the CA mutations P99A and EE75,76AA. (B) P2 cells expressing P99A/Gag-YFP and EE75,76AA/Gag-YFP were examined for virus release efficiency as described in Materials and Methods. (C) Quantification of virus release efficiency. Data from three different experiments are shown as means ± standard deviations. (D) P2 cells were infected with VSV-G-pseudotyped viruses encoding P99A/Gag-YFP (upper panel) or EE75,76AA/Gag-YFP (lower panel) and immunostained for PSGL-1 before fixation. Uropod localization of Gag-YFP was assessed using PSGL-1 as a uropod marker. (E) Gag polarity index values for wild-type Gag-YFP, P99A/Gag-YFP, and EE75,76AA/Gag-YFP in polarized P2 cells were determined as described in Materials and Methods. n, the number of cells used for quantification. Error bars represent standard errors of the means. ns, not significant.
Fig 2
Fig 2
LZ4/Gag-YFP polarizes more extensively than CA/NC/Gag-YFP, LZ2/Gag-YFP, or LZ3/Gag-YFP. (A) Illustration of Gag derivatives containing leucine zipper (LZ) sequences in place of NC. LZ/Gag-YFP is a prototype LZ-containing Gag that multimerizes and forms particles efficiently. Red letters in LZ sequences and asterisks denote mutations that are expected to convert dimeric LZ into trimeric (LZ3) or tetrameric (LZ4) ones. The CA mutation, WM184,185AA (WMAA; denoted by XX in CA), which prevents CA-mediated dimerization, was introduced into the LZ2/Gag-YFP, LZ3/Gag-YFP, and LZ4/Gag-YFP constructs so that LZ sequences provide the only major Gag-Gag interaction activity in these constructs. In CA/NC/Gag-YFP, the 14A1G change was introduced into NC (all NC basic residues substituted with Ala or Gly; denoted by XX in NC) in addition to the WMAA change to eliminate major Gag-Gag interaction domains. All constructs contain the MA mutation 20LK (denoted by a white X in MA), which increases membrane binding. (B) CA/NC/Gag-YFP, LZ2/Gag-YFP, LZ3/Gag-YFP, LZ4/Gag-YFP, and LZ/Gag-YFP were expressed in P2 cells via infection with VSV-G-pseudotyped viruses encoding these Gag constructs. (C) The Gag polarity index was determined for the mutants in polarized P2 cells as described in Materials and Methods. n, the number of cells used for quantification. Error bars represent standard errors of the means.
Fig 3
Fig 3
Gag associates with a specific subset of uropod-directed microdomains in unpolarized P2 cells. (A to D) P2 cells were infected with a VSV-G-pseudotyped virus encoding Gag-YFP. Cells were immunostained before fixation for CD44 (A), CD59 (B), ICAM-1 (C), and ICAM-3 (D). Polarized cells were observed to confirm that the uropod proteins were enriched at the uropod (top rows). To determine copatching of Gag and uropod markers, which reflects copartitioning of the markers with Gag in the same microdomains, unpolarized cells were examined (bottom rows). For unpolarized cells, the top surface of cells is shown. (E) Copatching between Gag and uropod markers in unpolarized cells was quantified using the square of Pearson's correlation coefficient (R2). n, the number of cells used for quantification. Error bars represent standard errors of the means. P values were calculated based on comparisons between Gag copatching with PSGL-1 and other uropod markers. ***, P < 0.001; ns, not significant.
Fig 4
Fig 4
CD44 and other uropod-associated proteins copatch in the absence of Gag. (A to F) Uninfected P2 cells were immunostained prior to fixation using two antibodies differing in their isotypes, one antibody recognizing CD44 and the other recognizing CD44 (A), PSGL-1 (B), CD43 (C), CD59 (D), ICAM-1 (E), or ICAM-3 (F). The top surface of cells is shown. (G) The level of copatching between CD44 and uropod markers was quantified with the square of Pearson's correlation coefficient (R2). n, the number of cells used for quantification. Error bars represent standard errors of the means. P values were calculated based on comparisons between CD44 copatching with PSGL-1 and other uropod markers. ***, P < 0.001; **, P < 0.01; *, P < 0.05; ns, not significant.
Fig 5
Fig 5
Gag reorganizes UDMs by excluding ICAM-3. (A) P2 cells were infected with VSV-G-pseudotyped virus particles encoding Gag-CFP. Two days postinfection, cells were immunostained prior to fixation for CD44 and ICAM-3. (B) The level of copatching between CD44 and ICAM-3 in the absence or presence of Gag was quantified with the square of Pearson's correlation coefficient (R2). ***, P < 0.001.
Fig 6
Fig 6
Membrane curvature is not required for specific UDM association. (A to C) P2 cells were infected with VSV-G-pseudotyped virus particles encoding the budding-deficient mutants P99A/Gag-YFP (top rows) and EE75,76AA/Gag-YFP (bottom rows). These cells were immunostained for PSGL-1 (A), CD43 (B), or CD59 (C) prior to fixation. Maximum projections reconstructed from z-stack images of cells are shown. (D) Copatching between Gag and uropod markers was quantified with the square of Pearson's correlation coefficient (R2). n, the number of cells used for quantification. Error bars represent standard errors of the means. P values were calculated based on comparisons between Gag copatching with PSGL-1 and other uropod markers. ***, P < 0.001; ns, not significant.
Fig 7
Fig 7
The MA sequence promotes Gag association with specific UDMs. (A and B) P2 cells were nucleofected with molecular clones encoding Fyn(10)/Gag-YFP (A) or Fyn(10)/ΔMA/Gag-YFP (B). After 3 days, cells were immunostained for PSGL-1, CD43, or CD59 before fixation. The middle focal plane of cells is shown. Prominent cytoplasmic signals are observed in some cells. (C) The level of copatching between Gag and uropod markers was quantified with the square of Pearson's correlation coefficient (R2). To ensure that only plasma-membrane-associated Gag was quantified for colocalization, regions of interest corresponding to the cell periphery at the middle focal plane of the cell were used for quantification as described in Materials and Methods. n, the number of cells used for quantification. Error bars represent standard errors of the means. ***, P value < 0.001.
Fig 8
Fig 8
A positive charge of the MA HBR is required for specific UDM association. (A) Illustration depicting the MA HBR amino acid sequences and changes introduced in the MA mutants 6A2T and HBR/RKswitch. The basic amino acids of the wild-type HBR (blue, underlined) were changed to neutral amino acids (gray) in 6A2T or switched from R to K and from K to R (cyan) in HBR/RKswitch. (B and C) P2 cells were nucleofected with molecular clones encoding Fyn(10)/6A2T/Gag-YFP (B) or Fyn(10)/HBR/RKswitch/Gag-YFP (C). After 3 days, cells were immunostained before fixation for PSGL-1, CD43, or CD59. The middle focal plane of cells is shown. (D) Copatching between Gag and uropod markers was quantified with the square of Pearson's correlation coefficient (R2) as described for Fig. 7. n, the number of cells used for quantification. Error bars represent standard errors of the means. Data for Fyn(10)/Gag-YFP and Fyn(10)ΔMA/Gag-YFP from Fig. 7 are included for comparison. P values were calculated based on comparisons between Fyn(10)/Gag-YFP and its derivatives. ***, P < 0.001; ns, not significant.
Fig 9
Fig 9
Gag binding to PI(4,5)P2-containing liposomes requires the specific HBR amino acid sequence, whereas the overall positive charge of the HBR is sufficient for RNA binding and acidic lipid binding in the absence of RNA. (A) Liposome binding assays were performed to examine binding of wild-type Gag-YFP, HBR/RKswitch/Gag-YFP, and 6A2T/Gag-YFP to control liposomes that contain PC and PS in a 2:1 ratio [PC;PS (2:1)] or liposomes that contain 7.25 mol% PI(4,5)P2 in addition to PC:PS (2:1). M, membrane-bound Gag; NM, non-membrane-bound Gag. (B) The amount of labeled Gag in each fraction was quantified using a phosphorimager, and the percentage of labeled Gag in the membrane-bound fraction versus the total amount of labeled Gag was calculated. The relative liposome-binding efficiency for each condition was calculated in comparison to the binding efficiency of wild-type Gag-YFP with PI(4,5)P2-containing liposomes. Data from three different experiments are shown as means ± standard deviations. Liposome binding efficiency was quantified, with all conditions normalized to Gag-YFP binding to PI(4,5)P2-containing liposomes. (C) Liposome binding assays were performed to examine binding of wild-type Gag-YFP, HBR/RKswitch/Gag-YFP, and 6A2T/Gag-YFP to PC:PS (2:1) liposomes with or without RNase treatment. M, membrane-bound Gag; NM, non-membrane-bound Gag. (D) Liposome binding efficiency was quantified as described for panel B, and the relative liposome-binding efficiency for each condition was calculated in comparison to the binding efficiency of RNase-treated Gag-YFP with PC:PS (2:1) liposomes. Data from three different experiments are shown as means ± standard deviations. Note that results shown in panels A and C were obtained in the same experiment, and therefore the same gel images are shown for the negative-control conditions (left side).

Similar articles

Cited by

References

    1. Chen P, Hubner W, Spinelli MA, Chen BK. 2007. Predominant mode of human immunodeficiency virus transfer between T cells is mediated by sustained Env-dependent neutralization-resistant virological synapses. J. Virol. 81:12582–12595 - PMC - PubMed
    1. Dimitrov DS, Willey RL, Sato H, Chang LJ, Blumenthal R, Martin MA. 1993. Quantitation of human immunodeficiency virus type 1 infection kinetics. J. Virol. 67:2182–2190 - PMC - PubMed
    1. Hübner W, McNerney GP, Chen P, Dale BM, Gordon RE, Chuang FYS, Li XD, Asmuth DM, Huser T, Chen BK. 2009. Quantitative 3D video microscopy of HIV transfer across T cell virological synapses. Science 323:1743–1747 - PMC - PubMed
    1. Martin N, Welsch S, Jolly C, Briggs JAG, Vaux D, Sattentau QJ. 2010. Virological synapse-mediated spread of human immunodeficiency virus type 1 between T cells is sensitive to entry inhibition. J. Virol. 84:3516–3527 - PMC - PubMed
    1. Mazurov D, Ilinskaya A, Heidecker G, Lloyd P, Derse D. 2010. Quantitative comparison of HTLV-1 and HIV-1 cell-to-cell infection with new replication dependent vectors. PLoS Pathog. 6:e1000788 doi:10.1371/journal.ppat.1000788 - DOI - PMC - PubMed

Publication types

MeSH terms

Substances