. 2013 Jun;109(12):2866-82.
doi: 10.1152/jn.00021.2013. Epub 2013 Mar 27.

Postnatal development of synaptic properties of the GABAergic projection from the inferior colliculus to the auditory thalamus

Affiliations

Postnatal development of synaptic properties of the GABAergic projection from the inferior colliculus to the auditory thalamus

Yamini Venkataraman et al. J Neurophysiol. 2013 Jun.

Abstract

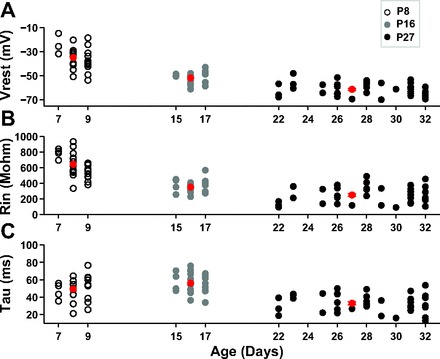
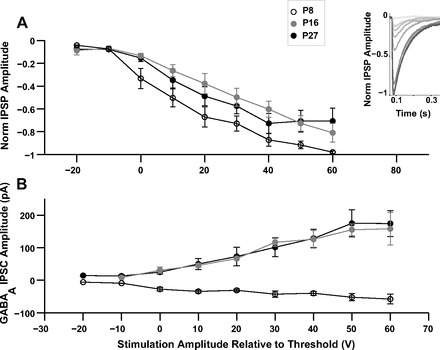
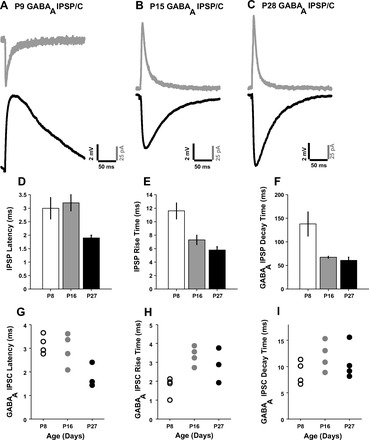
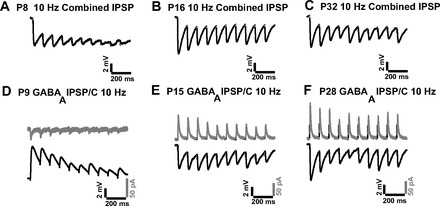
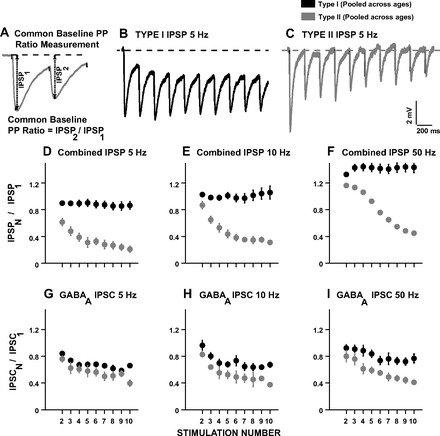
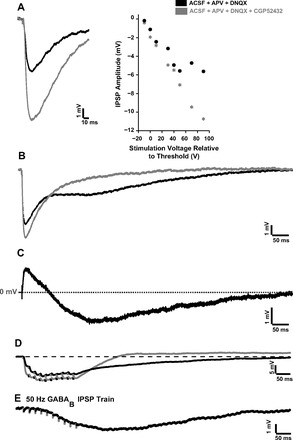
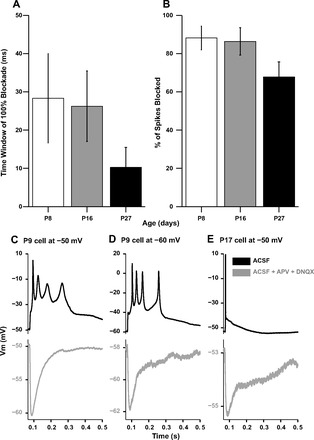
The development of auditory temporal processing is important for processing complex sounds as well as for acquiring reading and language skills. Neuronal properties and sound processing change dramatically in auditory cortex neurons after the onset of hearing. However, the development of the auditory thalamus or medial geniculate body (MGB) has not been well studied over this critical time window. Since synaptic inhibition has been shown to be crucial for auditory temporal processing, this study examined the development of a feedforward, GABAergic connection to the MGB from the inferior colliculus (IC), which is also the source of sensory glutamatergic inputs to the MGB. IC-MGB inhibition was studied using whole cell patch-clamp recordings from rat brain slices in current-clamp and voltage-clamp modes at three age groups: a prehearing group [postnatal day (P)7-P9], an immediate posthearing group (P15-P17), and a juvenile group (P22-P32) whose neuronal properties are largely mature. Membrane properties matured substantially across the ages studied. GABAA and GABAB inhibitory postsynaptic potentials were present at all ages and were similar in amplitude. Inhibitory postsynaptic potentials became faster to single shocks, showed less depression to train stimuli at 5 and 10 Hz, and were overall more efficacious in controlling excitability with age. Overall, IC-MGB inhibition becomes faster and more precise during a time period of rapid changes across the auditory system due to the codevelopment of membrane properties and synaptic properties.

Keywords: critical window; midbrain; paired pulse; tectothalamic; thalamocortical.


Figures

Fig. 1.
Fig. 1.
Development of membrane properties. A: resting membrane potential (Vrest; in mV) as a function of age. In A–C, the open circles show postnatal day (P)7–P9 neurons, gray circles show P15–P17 neurons, and filled circles show P22–32 neurons. Red symbols in A–C are means for each age group. B: input resistance (Rin; in MΩ) as a function of age. C: membrane time constant (τ; in ms) as a function of age.
Fig. 2.
Fig. 2.
Cell types based on synaptic responses to stimulation of inferior colliculus (IC) axons. Current-clamp responses to single synaptic stimuli are shown. The top traces in A–D show cells in standard artificial cerebrospinal fluid (aCSF). The bottom traces in A–D show the same cells when ionotropic glutamate receptors were blocked with dl-2-amino-5-phosphonopentanoic acid (APV) + 6,7-dinitroquinoxaline-2,3-dione (DNQX). A: a P29 cell with a purely inhibitory response type (IN/0 cell). B: a P16 mixed type cell where the inhibitory postsynaptic potential (IPSP) preceded the excitatory postsynaptic potential (EPSP) (IN/EX cell). C: a P17 mixed type cell where the EPSP preceded the IPSP (EX/IN cell). D: a P9 cell with a dominant excitatory component (EXDOM cell). E–G: proportions of cell types at P27 (E), P16 (F), and P8 (G).
Fig. 3.
Fig. 3.
Amplitude of IC-medial geniculate body (MGB) inhibition. A: mean normalized IPSP amplitude at increasing stimulation amplitudes at P8 (open circles), P16 (gray circles), and P27 (filled circles). 0 V on the x-axis represents the threshold stimulation voltage. The inset shows normalized IPSPs at increasing stimulation amplitudes for a P8 cell where the peak IPSP amplitude was −13.6 mV. B: mean GABAA inhibitory postsynaptic current (IPSC) amplitude at P8 (open circles), P16 (gray circles), and P27 (filled circles) at increasing stimulation amplitudes. Clamp potential was −70 mV for cells at P8 and −50 mV for cells at P27 and P16.
Fig. 4.
Fig. 4.
Temporal properties of IC-MGB inhibition to single shocks. GABAB and ionotropic glutamate receptors were blocked to isolate GABAA components. A: P9 neuron GABAA IPSC (gray trace, Vclamp = −70 mV) and GABAA IPSP [black trace, membrane potential (Vmem) = −72.4 mV]. B: P15 neuron GABAA IPSC (gray trace, Vclamp = −50 mV) and GABAA IPSP (black trace). C: P28 neuron GABAA IPSC (gray trace, Vclamp = −50 mV) and GABAA IPSP (black trace). In D–F, open bars indicate P8, gray bars indicate P16, and filled bars indicate P27. Error bars are SEs. D: mean IPSP latency at the ages shown. E: mean IPSP rise time. F: mean GABAA IPSP decay time. In G–I, each symbol represents a measurement from an individual neuron. G: GABAA IPSC latency. H: GABAA IPSC rise time. I: GABAA IPSC decay time.
Fig. 5.
Fig. 5.
Examples of inhibitory responses to repetitive shocks of IC axons. A–C: IPSP trains (recorded with aCSF + APV + DNQX) at P8 (A), P16 (B), and P32 (C). D–F: GABAB and ionotropic glutamate receptors were blocked to isolate GABAA components. Three pairs of GABAA IPSC trains (top traces) and GABAA IPSP trains (bottom traces) recorded at P9 (D; Vmem = −71.9 mV and Vclamp = −70 mV), P15 (E; Vclamp = −50 mV), and P28 (F; Vclamp = −50 mV). The same stimulation parameters were used for each pair in current-clamp and voltage-clamp modes.
Fig. 6.
Fig. 6.
Paired-pulse (PP) ratios computed using the individual baseline method. A: illustration of the PP ratio measurement with respect to an individual baseline for each IPSP, determined from the prestimulation artifact for that particular IPSP. In B–J, the open circles show mean P8 ratios, gray circles show mean P16 ratios, and filled circles show mean P27 ratios. B–D: mean PP ratios for combined IPSPs at 5 Hz (B), 10 Hz (C) and 50 Hz (D). n = 10, 15, and 12 cells for P8, P16, and P27, respectively. n values after PP2 were slightly lower at 5 and 10 Hz. PP ratios were lower at P8 at 5 and 10Hz, and PP ratios were lower at all ages at 50 Hz. E–G: mean PP ratios for GABAA IPSPs at 5 Hz (E), 10 Hz (F), and 50 Hz (G). n = 6, 8, and 6 cells for P8, P16, and P27, respectively. H–J: mean PP ratios for GABAA IPSCs at 5 Hz (H), 10 Hz (I), and 50 Hz (J). n = 4, 4, and 3 cells for P8, P16, and P27, respectively.
Fig. 7.
Fig. 7.
Type I and type II PP ratios computed using the common baseline method (data were pooled across ages for D–I). A: illustration of the PP ratio measurement with respect to a common baseline determined from the pretrain membrane potential in current-clamp mode. B: type I IPSP response in a P26 neuron at 5 Hz. C: type II IPSP response in a P25 neuron at 5 Hz. The dotted lines in B and C show the common baseline used for PP ratio calculation. D: mean pp ratios of combined IPSPs at 5 Hz for type I responses (filled circles, n = 24 cells across ages) and type II responses (gray circles, n = 7 cells across ages). Note that the average PP ratio for type I responses remained around 1, whereas type II neurons showed reduced PP ratios across the train. E: mean PP ratios of combined IPSPs at 10 Hz for type I responses (filled circles, n = 22 cells across ages) and type II responses (gray circles, n = 8 cells across ages). F: mean PP ratios of combined IPSPs at 50 Hz for type I responses (filled circles, n = 30 cells across ages). Only one type II response (gray circles) was observed at 50 Hz. G: mean PP ratios of GABAA IPSCs at 5 Hz for type I responses (filled circles, n = 6 cells) and type II responses (gray circles, n = 5 cells). H: mean PP ratios of GABAA IPSCs at 10 Hz for type I responses (filled circles, n = 9 cells) and type II responses (gray circles, n = 2 cells). I: mean PP ratios of GABAA IPSCs at 50 Hz for type I responses (filled circles, n = 8 cells) and type II responses (gray circles, n = 3 cells).
Fig. 8.
Fig. 8.
Histograms of PP ratios at the end of a stimulus train using the common baseline and individual baseline methods. A: histogram of cells (pooled across ages) based on IPSP10-to-IPSP1 (IPSP10/IPSP1) ratios measured using the common baseline method. An IPSP10/IPSP1 ratio of 0.5 was used to differentiate a type I response (IPSP10/IPSP1 ≥ 0.5) and a type II response (IPSP10/IPSP1 < 0.5). B: histogram of cells (pooled across ages) based on IPSP10/IPSP1 ratios measured using the individual baseline method.
Fig. 9.
Fig. 9.
Modulatory effects of GABAB. A: GABAB modulated peak IPSP amplitude. Left, responses of a P28 neuron at (threshold + 90) V stimulation in aCSF + APV + DNQX (black trace) to isolate the IPSP and in aCSF + APV + DNQX + CGP-52432 (gray trace) to block GABAB receptors. Right, responses of the same neuron at varying stimulation amplitudes. Note the increase of IPSP amplitude after GABAB blockade. B: GABAB modulated IPSP temporal properties. Shown is a P17 neuron at (threshold + 50) V stimulation in aCSF + APV + DNQX (black trace) and in ACSF + APV + DNQX + CGP-52432 (gray trace). C: difference waveform of the two traces shown in B. The positive component of the difference waveform corresponds to the increased GABAA IPSP peak amplitude when GABAB receptors are blocked. The negative longer-lasting component of the difference waveform corresponds to the postsynaptic GABAB IPSP that is eliminated with CGP-52432. D: GABAB modulated recovery after repetitive stimulation. P16 neuron responses at 50 Hz in aCSF + APV + DNQX (black trace) and aCSF + APV + DNQX + CGP-52432 (gray trace) are shown. E: GABAB response of a P17 neuron to a 50-Hz train isolated with aCSF + APV + DNQX + picrotoxin.
Fig. 10.
Fig. 10.
Potency of inhibition in suppressing spikes. A: time window of 100% action potential blockade by preceding IPSPs at P7–P9, P15–P17, and P22–P32, where the action potential was evoked by a depolarizing current pulse at varying intervals after synaptic stimulation. B: percentage of spikes blocked by IPSPs at P7–P9, P15–P17, and P22–P32, averaged over the time window of 0–50 ms preceding the current pulse onset. C: P9 neuron multiple spiking responses in normal aCSF (black trace, top) and in the presence of APV + DNQX (gray trace, bottom). D: the same P9 neuron as in C from a more hyperpolarized base potential. E: single spiking response of a P17 neuron in aCSF (black trace, top) and the underlying IPSP in aCSF + APV + DNQX (gray trace, bottom).

Similar articles

Cited by

References

    1. Aghajanian GK, Rasmussen K. Intracellular studies in the facial nucleus illustrating a simple new method for obtaining viable motoneurons in adult rat brain slices. Synapse 3: 331–338, 1989. - PubMed
    1. Ammer JJ, Grothe B, Felmy F. Late postnatal development of intrinsic and synaptic properties promotes fast and precise signaling in the dorsal nucleus of the lateral lemniscus. J Neurophysiol 107: 1172–1185, 2012. - PubMed
    1. Anderson LA, Linden JF. Physiological differences between histologically defined subdivisions in the mouse auditory thalamus. Hear Res 274: 48–60, 2011. - PMC - PubMed
    1. Antunes FM, Malmierca MS. Effect of auditory cortex deactivation on stimulus-specific adaptation in the medial geniculate body. J Neurosci 31: 17306–17316, 2011. - PMC - PubMed
    1. Antunes FM, Nelken I, Covey E, Malmierca MS. Stimulus-specific adaptation in the auditory thalamus of the anesthetized rat. PLos One 5: e14071, 2010. - PMC - PubMed

Publication types

MeSH terms

LinkOut - more resources