. 2013 Jun;109(12):2982-98.
doi: 10.1152/jn.01080.2012. Epub 2013 Mar 27.

Responses of single corticospinal neurons to intracortical stimulation of primary motor and premotor cortex in the anesthetized macaque monkey

Affiliations

Responses of single corticospinal neurons to intracortical stimulation of primary motor and premotor cortex in the anesthetized macaque monkey

Marc A Maier et al. J Neurophysiol. 2013 Jun.

Abstract

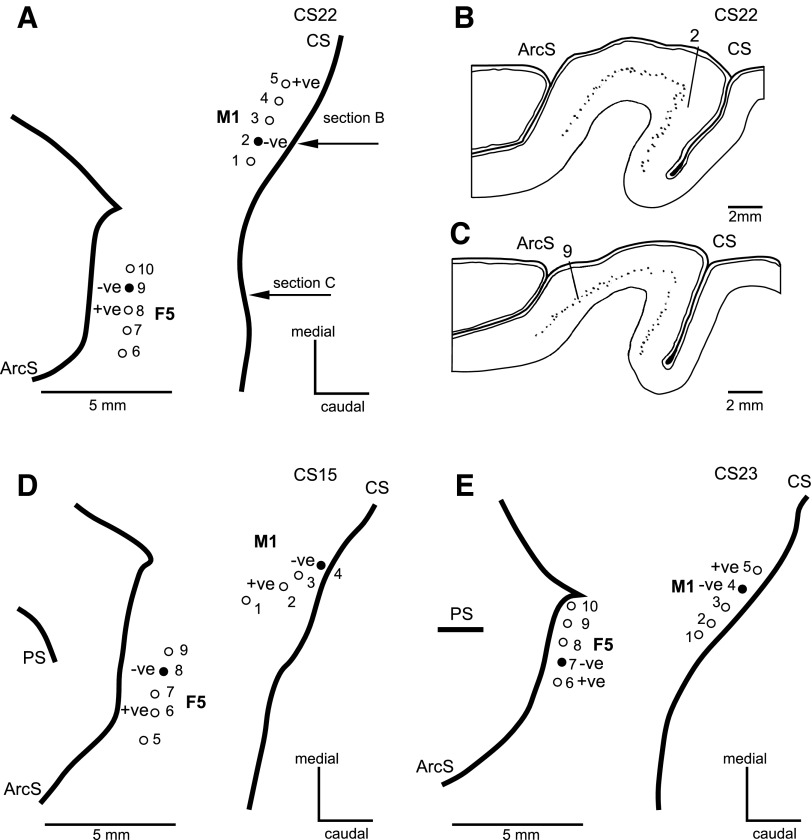
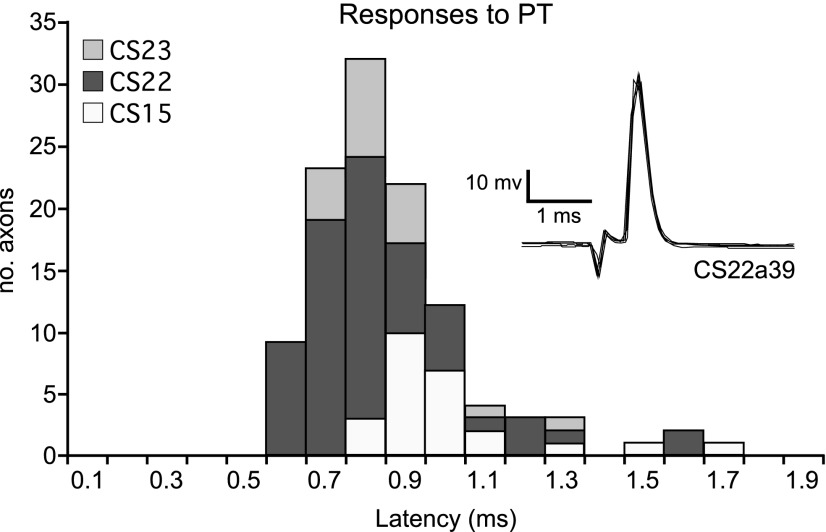
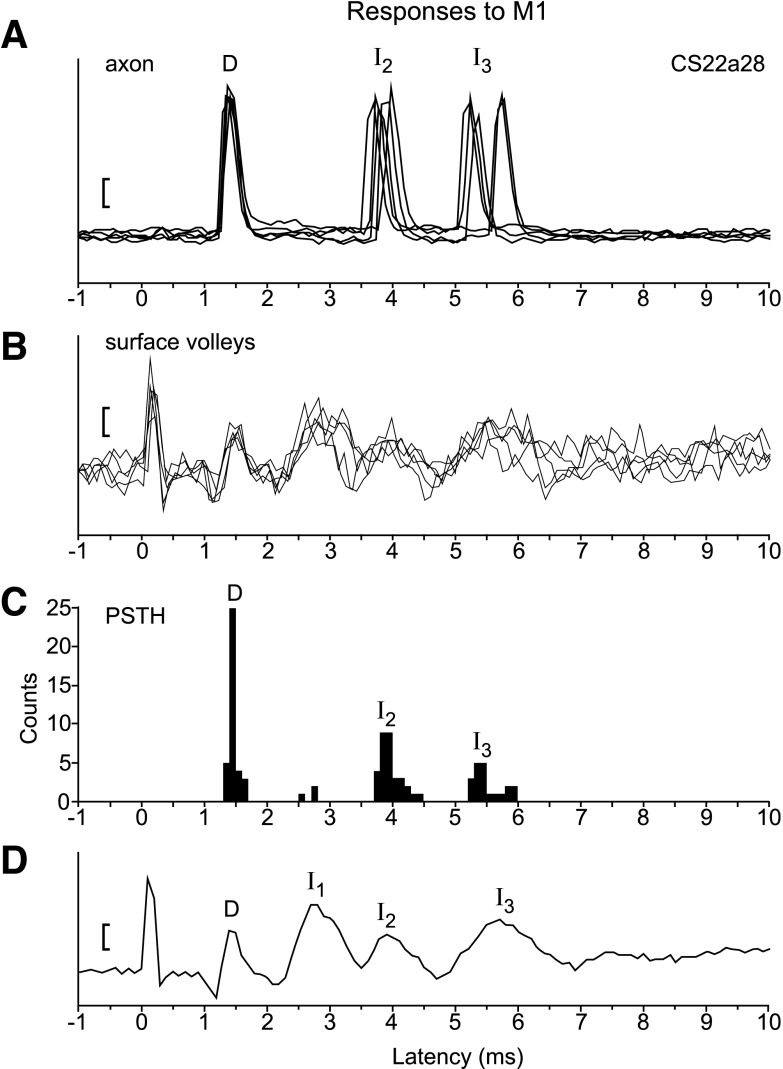
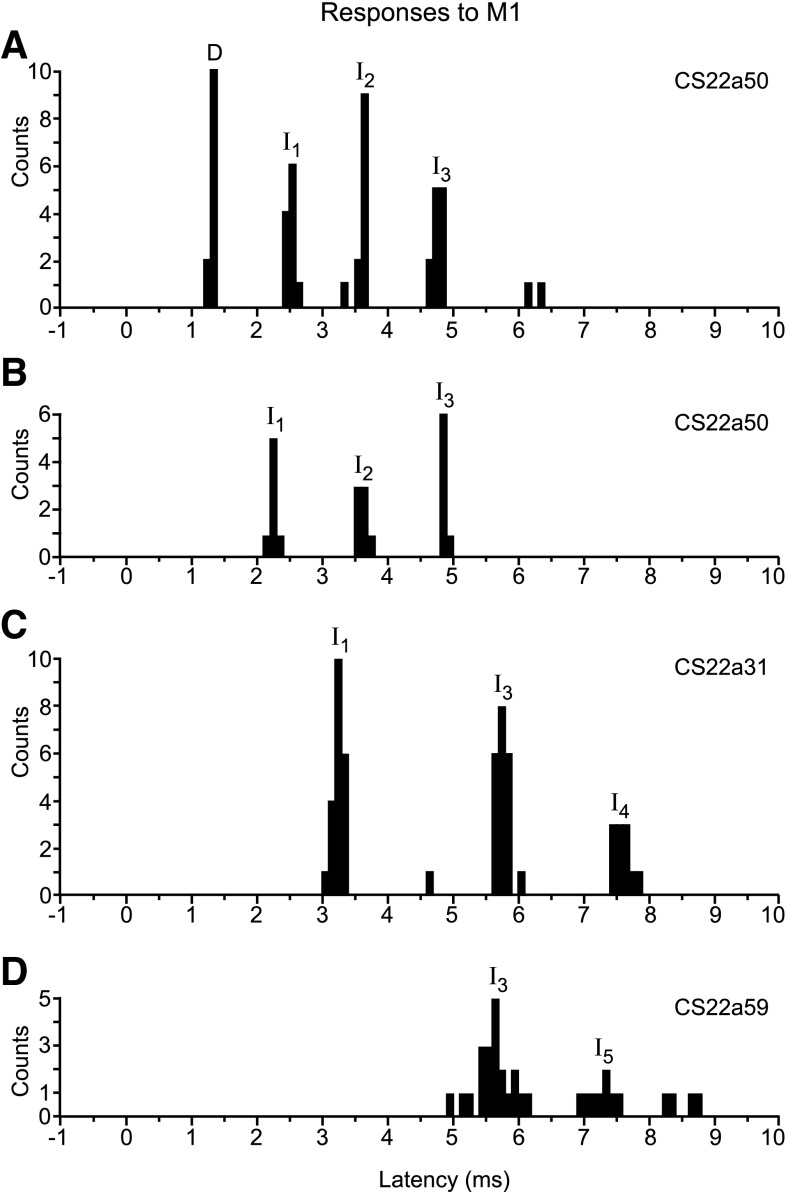
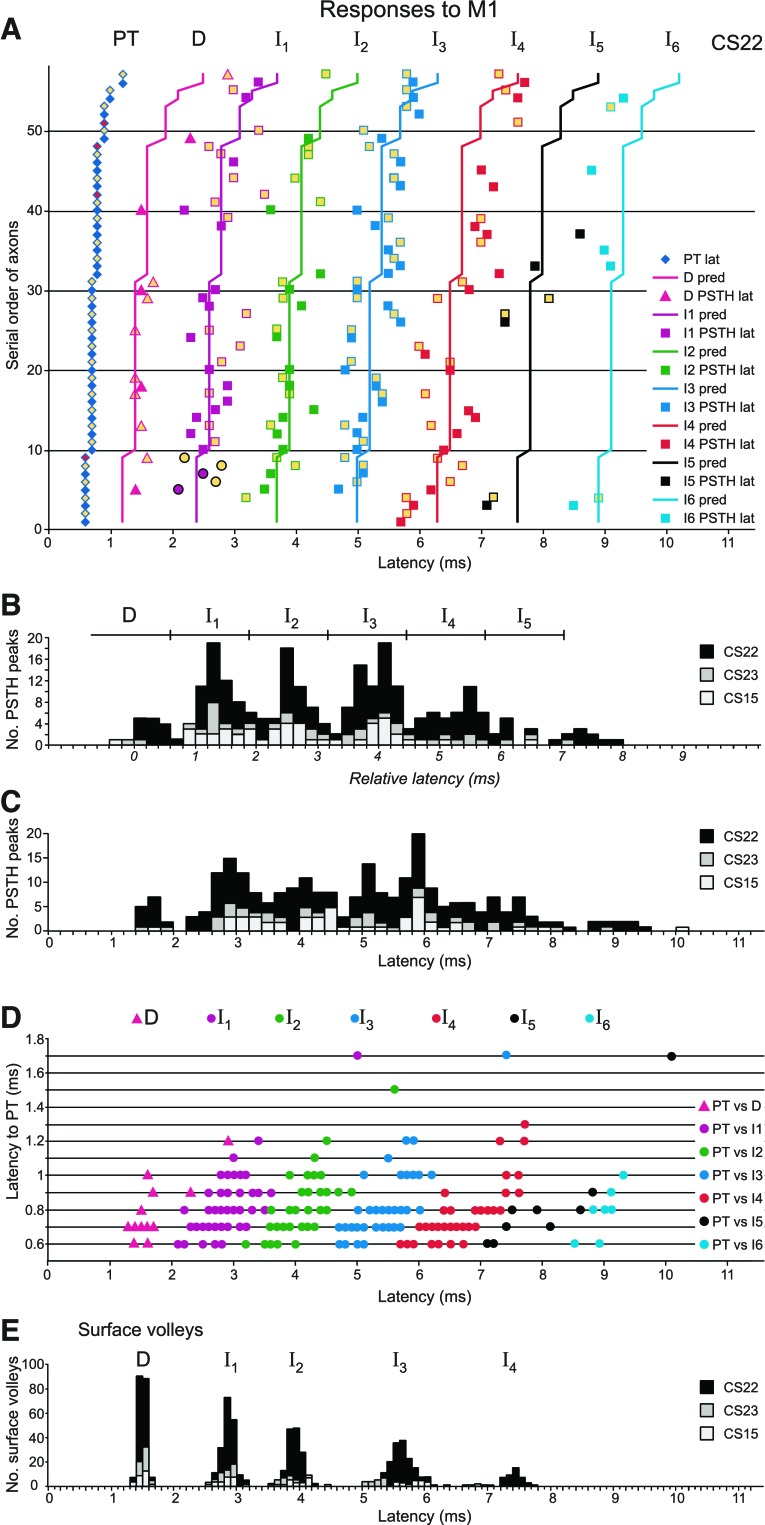
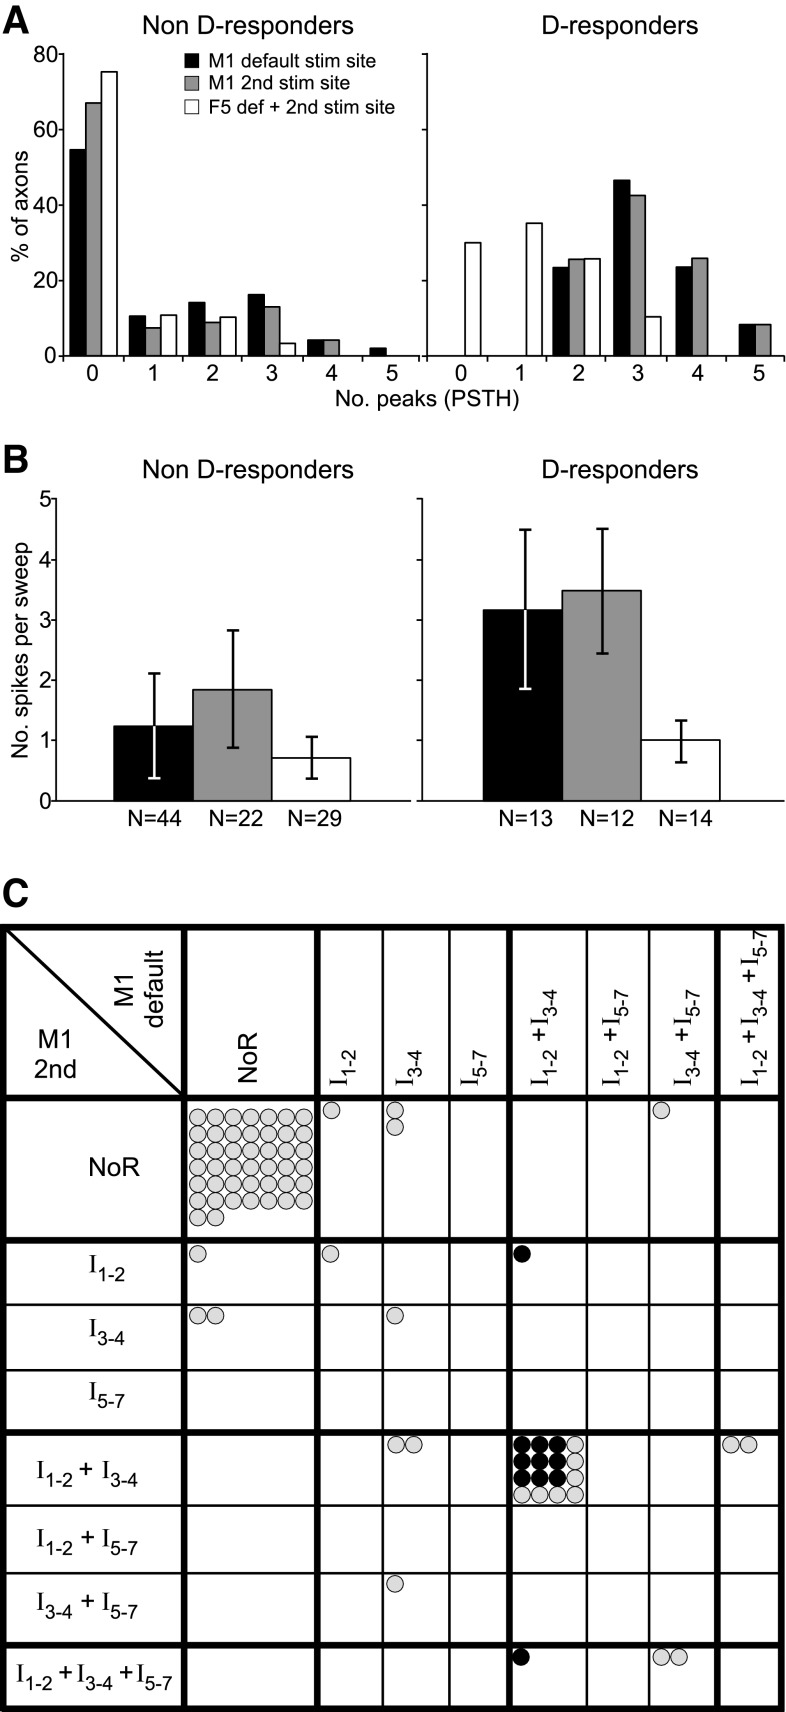
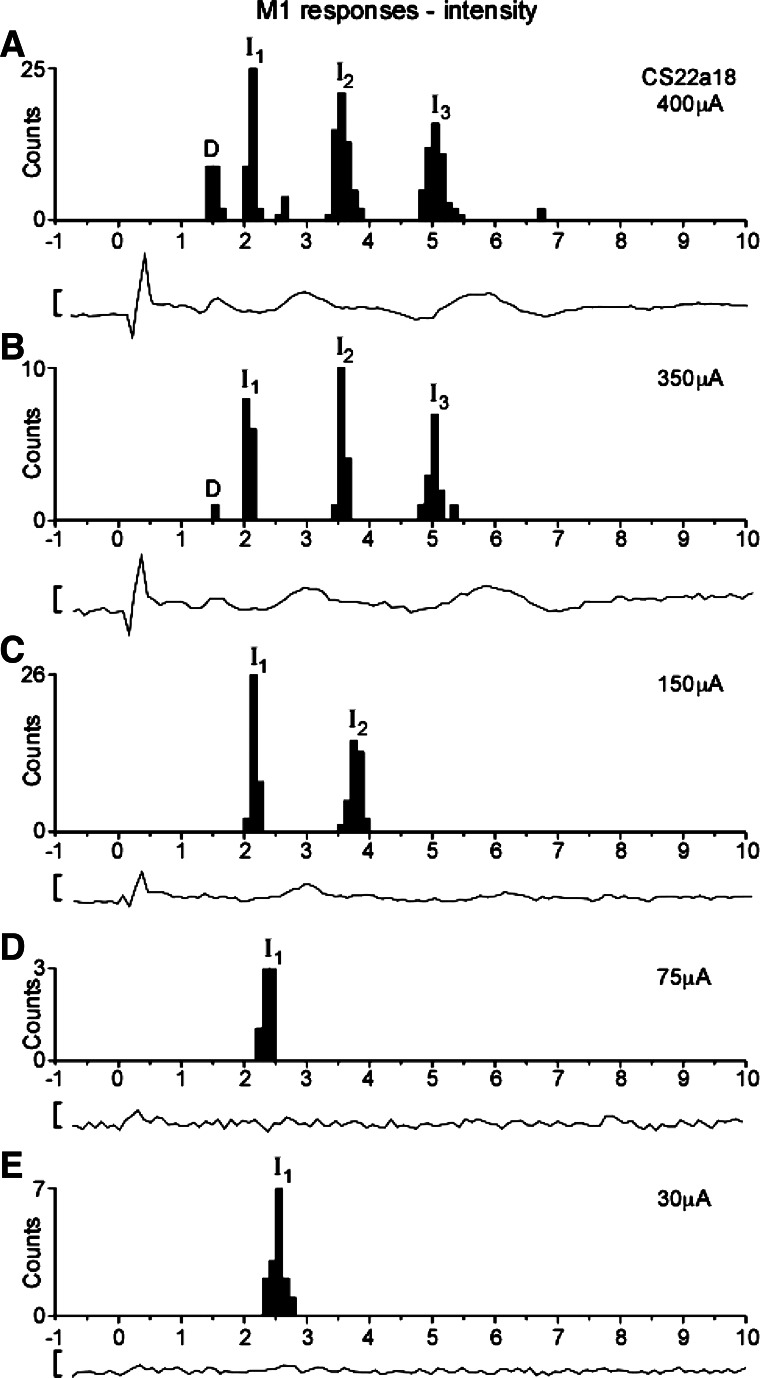
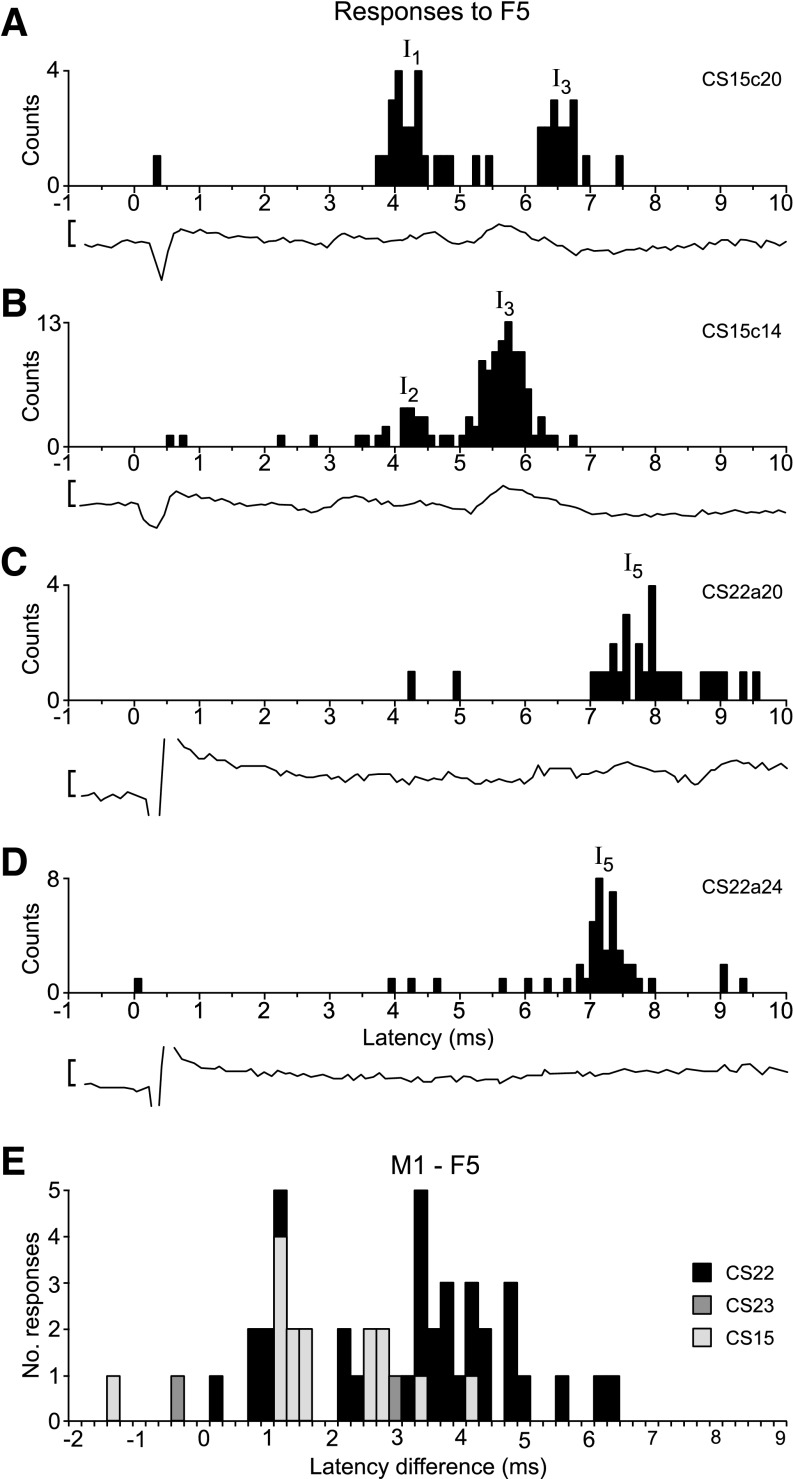
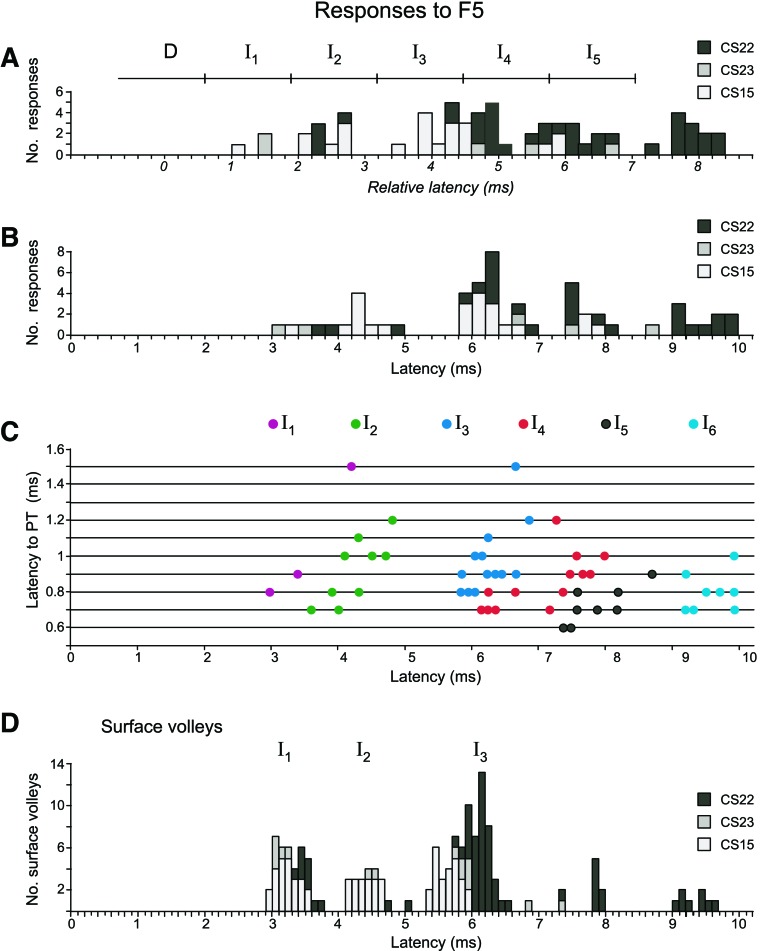
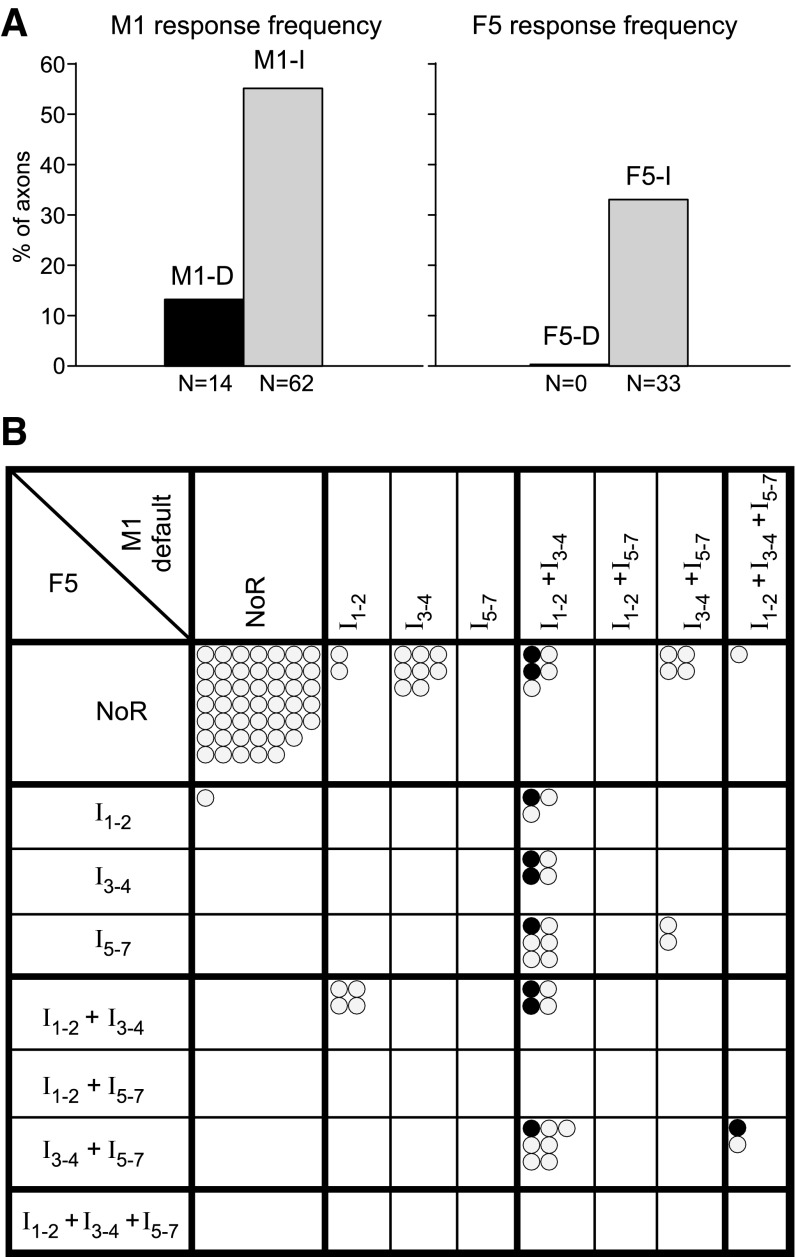
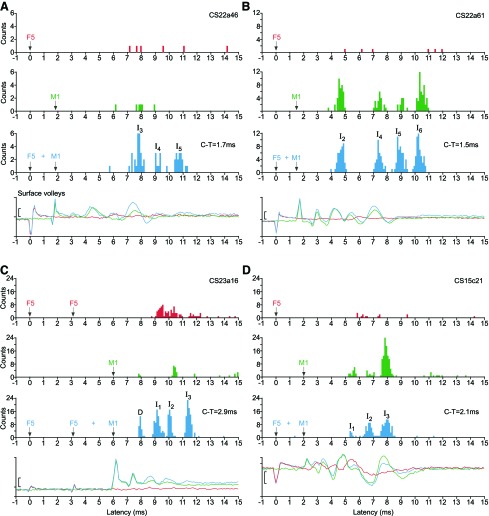
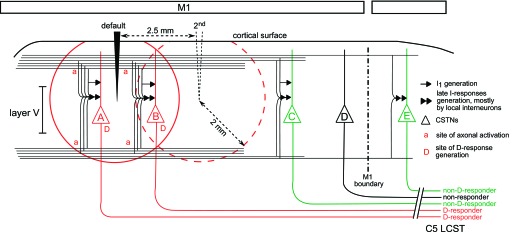
The responses of individual primate corticospinal neurons to localized electrical stimulation of primary motor (M1) and of ventral premotor cortex (area F5) are poorly documented. To rectify this and to study interactions between responses from these areas, we recorded corticospinal axons, identified by pyramidal tract stimulation, in the cervical spinal cord of three chloralose-anesthetized macaque monkeys. Single stimuli (≤400 μA) were delivered to the hand area of M1 or F5 through intracortical microwire arrays. Only 14/112 (13%) axons showed responses to M1 stimuli that indicated direct intracortical activation of corticospinal neurons (D-responses); no D-responses were seen from F5. In contrast, 62 axons (55%) exhibited consistent later responses to M1 stimulation, corresponding to indirect activation (I-responses), showing that single-pulse intracortical stimulation of motor areas can result in trans-synaptic activation of a high proportion of the corticospinal output. A combined latency histogram of all axon responses was nonperiodic, clearly different from the periodic surface-recorded corticospinal volleys. This was readily explained by correcting for conduction velocities of individual axons. D-responding axons, taken as originating in neurons close to the M1 stimulating electrodes, showed more I-responses from M1 than those without a D-response, and 8/10 of these axons also responded to F5 stimulation. Altogether, 33% of tested axons responded to F5 stimulation, most of which also showed I-responses from M1. These excitatory effects are in keeping with facilitation of hand muscles evoked from F5 being relayed via M1. This was further demonstrated by facilitation of test responses from M1 by conditioning F5 stimuli.

Keywords: axon; corticospinal; monkey; motor cortex.


Figures

Fig. 1.
Fig. 1.
Cortical M1 and F5 stimulation sites in the three monkeys. A, D, and E: surface maps of the left cortex in monkey CS22, CS15, and CS23, respectively. Entry points of the electrodes in each array are indicated by numbers 1–10. The cathode (−ve, filled circle) and anode (+ve) most commonly used for stimulation in M1 and F5 (default sites) are indicated. A: the second M1 site in CS22 involved electrodes 4 (−ve) and 3 (+ve), while in F5 it was 7 (−ve) and 6 (+ve). E: in CS23, these were 2 (−ve) and 1 (+ve) for M1 and 9 (−ve) and 8 (+ve) for F5. The arcuate sulcus (ArcS), central sulcus (CS), and principal sulcus (PS) are shown. B and C: parasaggital histological sections from cortex of CS22. Sections are taken at the level indicated by the horizontal arrows in A. B: section shows location of cathodal M1 electrode (no. 2). C: section shows location of cathodal F5 electrode (no. 9). Dots in sections indicate presence of large lamina V pyramidal cells.
Fig. 2.
Fig. 2.
Identification of single corticospinal axons from pyramidal tract (PT) stimulation. Latency data from all three animals (112 axons; 19, 68, and 25 from CS23, CS22, and CS15, respectively). Inset: five superimposed sweeps of a single-spike response to PT stimulation at 400 μA for axon CS22a39. PT stimulus onset was at downward inflexion. Latency was measured at the peak of the spike.
Fig. 3.
Fig. 3.
Typical spike and volley responses to M1 stimulation. A: five superimposed sweeps of intra-axonal spike recordings from axon CS22a28. M1 stimulation (400 μA) at time 0 is shown. Note little or no variation in latency for the D-response at 1.5 ms, and more jitter for the later I2- and I3-responses. Calibration bar: 2 mV. B: five corresponding sweeps of surface volleys; stimulation artifact at time 0. Calibration bar: 10 μV (also in D). C: poststimulus time histogram (PSTH) for this same axon, based on 39 sweeps at 400 μA. D, I2, and I3 peaks are at 1.5, 3.9, and 5.4 ms, respectively. Bin size: 0.1 ms. Note again: little jitter for the D-response (0.4 ms at the base), and more for the I-responses (0.8 ms at the base). The identity of the peaks as D, I2, I3, etc. in this figure and all succeeding ones was estimated from a procedure which took account of both the latency of the different peaks in the PSTH and the relative conduction velocity of the axon from which spikes were recorded (see text and Fig. 5). D: average of volleys from corresponding sweeps, with clearly visible D, I1, I2, and I3 peaks.
Fig. 4.
Fig. 4.
Examples of PSTHs of responses in single axons to M1 stimulation. A: response of CS22a50 to 2nd M1 stimulation site (12 sweeps). Responses were classified as D, I1, I2, and I3. B: response of same axon (CS22a50) to default M1 stimulation site (7 sweeps). Responses were classified as I1, I2, and I3; no D-response was present. C: response of CS22a31 to default M1 stimulation site (21 sweeps). Responses were classified as I1, I3, and I4. D: response of CS22a59 to default M1 stimulation site (23 sweeps). Responses were classified as I3 and I5. All responses were evoked with single 400-μA stimuli. See text for peak identification procedure.
Fig. 5.
Fig. 5.
Absolute and relative latencies of axon and surface volley responses to M1 stimulation. A: raster histogram of single-axon PSTH latencies to M1 stimulation at 400 μA for monkey CS22. Each symbol in a given row (except the leftmost) indicates the absolute latency of a PSTH response peak to M1 stimulation for a single axon (solid fill, default site; yellow fill, 2nd site). The leftmost symbol (diamond) indicates its latency to PT stimulation. Responses to an M1 default stimulation site are indicated in a row headed by a blue PT response and those for the same axon to the 2nd M1 stimulation site by the yellow PT response immediately above. Red PT responses indicate axons that were only tested for the 2nd M1 site. The 32 axons are ordered according to their PT latency: fastest axons appear in the lowest rows, slowest in the top rows of the raster. The colored lines represent the model predictions for D and I1 to I6 latencies, i.e., according to a particular value of k (see text). Peaks in the PSTH of each axon have been classified as D, I1, etc., according to these predictions and indicated by the color code shown at right. The five lowest points assigned as I1 responses (circles) are those that were used to fit the model. B: histogram of the M1 PSTH response latencies relative to their predicted D-response latency for all three monkeys. Responses to default and 2nd M1 stimulation sites are combined. Bin size: 0.2 ms. The responses at around 0 ms represent D-responses; those separated by multiples of about 1.3 ms represent clear clusters of I1, I2, I3, and I4 responses. Boundaries used to assign different PSTH subpeaks are indicated by tick marks on the horizontal bar. C: histogram of absolute M1 PSTH response latencies. Responses to default and 2nd M1 stimulation sites are combined. Note considerable overlap and weak clustering of the latencies compared with the relative latencies in B. Bin size: 0.2 ms. D: absolute latencies of PSTH responses plotted against their PT latencies, for all three monkeys. Responses to default and 2nd M1 stimulation sites are combined. Color code indicates response classification. Some of the points plotted involve overlap of two or more results, as follows: D, 16 responses (4 overlaps, 12 visible); I1, 61 responses (23 overlaps, 38 visible); I2, 49 responses (18 overlaps, 31 visible); I3, 69 responses (36 overlaps, 33 visible); I4, 41 responses (9 overlaps, 32 visible); I5, 11 responses (3 overlaps, 8 visible); and I6, 7 responses (no overlaps). E: histogram of latencies of waves in the volleys evoked from M1 for all three monkeys. Note very clear clustering of D-, I1-, I2-, I3-, and I4-waves. Bin size: 0.1 ms.
Fig. 6.
Fig. 6.
Indirect (I-wave) axon responses to M1 (and F5) stimulation. A: number of classified I peaks in PSTH responses per axon across all three monkeys using a 400-μA stimulus. These were counted separately for the M1 default site and for the 2nd M1 site. Data from default and 2nd F5 site are combined and included (white bars). Left: for non-D-responders; right: for D-responders. The majority of the non-D-responders showed no I-responses to M1 and to F5 stimulation, i.e., had zero I peaks. In contrast, the majority of D-responders showed M1 I-responses: all showed at least two I peaks to M1 stimulation. Similarly, F5 responses were far more frequent in D-responders. B: number of spikes in the PSTH response per sweep and axon (i.e., a measure independent of the I-response classification). Mean (±SD) are shown for all axons with PSTH responses of the three monkeys calculated separately for the M1 default site and for the 2nd M1 site. Data from the default and 2nd F5 site were combined. Note the two- to threefold increase in the M1 response strength in D-responders compared with non-D-responders. N: number of axons. C: comparison of the response type (indirect effects only) between the default and the 2nd M1 stimulation. A circle represents one axon: gray for non-D-responders, and black for D-responders. Note that most responses fall on or close to the diagonal, indicating a similarity of the responses to the two M1 sites in a given axon. See text for explanation of response categories. NoR, no response.
Fig. 7.
Fig. 7.
PSTHs of single-axon responses as a function of M1 stimulation strength. A: PSTH of responses from axon CS22a18 (D-responder) and (below) concomitant volley for 400-μA M1 stimulation (57 sweeps). PSTH response was classified as D, I1, I2, and I3. Volley shows a D, I1, I3, and a very weak I2 response. B: as in A, but 350-μA stimulation (15 sweeps). PSTH response was classified as D, I1, I2, and I3. C: as in A, but 150-μA stimulation (36 sweeps). PSTH response was classified as I1 and I2. Note absence of D volley. D: as in A, but 75-μA stimulation (7 sweeps). PSTH response was classified as I1. Note absence of volley response. E: as in A, but 30-μA stimulation (16 sweeps). PSTH response was classified as I1. Calibration bar for volleys: 20 μV. Note the very different number of sweeps used to construct the PSTHs for different stimulation intensities.
Fig. 8.
Fig. 8.
Examples of PSTHs of single-axon responses to F5 stimulation. A: response of CS15c20 to F5 stimulation (400 μA, 53 sweeps). Response was classified as I1 and I3. B: response of CS15c14 to F5 stimulation (250 μA, 123 sweeps). Response was classified as I2 and I3. This axon was one of the fastest conducting, whereas that in A was one of the slowest. C: response of CS22a20 to F5 stimulation (400 μA, 76 sweeps). Response was classified as I5. D: response of CS22a24 to F5 stimulation (400 μA, 61 sweeps). Response was classified as I5. All four axons showed I-responses to M1 stimulation, but only the axon shown in D showed a D-response. The average, surface-recorded volleys are shown below each PSTH: note that the volleys evoked by F5 stimulation, compared with those evoked from M1 (e.g., Figs. 3 and 7), were generally small and late. E: latency difference between PSTHs of earliest responses evoked from M1 and from F5 in a given axon, across the three monkeys. For axons with both an M1 and an F5 response, the difference was calculated between the first (earliest) F5 and first M1 PSTH I-response. Note: most F5-responses were later than those from M1 (positive lag). Calibration bar for volleys (A–D): 5 μV.
Fig. 9.
Fig. 9.
Absolute and relative latencies of axon and surface volley responses to F5 stimulation. A: histogram of the F5 PSTH response latencies relative to their predicted D-response latency for all three monkeys. Responses to default and 2nd F5 stimulation sites are combined (at 400 μA). Bin size: 0.2 ms. Boundaries used to assign different PSTH peaks are indicated by tick marks on the horizontal bar. B: absolute latencies of axons to F5 stimulation. C: absolute latencies of axon responses plotted against their PT latencies. Responses to default and 2nd F5 stimulation site are combined. Color code indicates response classification (color code as in Fig. 5A). Some of the points plotted involve overlap of two or more results, as follows: D, 0 responses; I1, 3 responses (no overlap); I2, 10 responses (1 overlap); I3, 15 responses (2 overlaps); I4, 16 responses (2 overlaps); I5, 9 responses (1 overlap); and I6, 12 responses (4 overlaps). D: histogram of latencies of waves in the F5 volleys, for all three monkeys. Responses to default and 2nd F5 stimulation site are combined. Bin size: 0.1 ms.
Fig. 10.
Fig. 10.
Comparison between axon responses evoked by stimulation of F5 and of M1. A: comparison of the responsiveness of axons to M1 and F5 stimulation. Note presence of D-responses (M1-D) from M1, but absence (F5-D) from F5 stimulation. Note generally lower incidence of F5 (33%) compared with M1 stimulation (55%). N: number of axons. B: comparison of the response type (indirect effects only) to M1 default and F5 stimulation. Format is as in Fig. 6C. A circle represents one axon: gray for non-D-responders and black for D-responders. Note that most responses do not lie on the diagonal, indicating a dissimilarity of the responses to M1 and to F5 stimulation in a given axon.
Fig. 11.
Fig. 11.
F5-M1 interaction effects in single axons and surface volleys. In each example, for both histograms and volleys, red indicates F5 stimulation alone; green, M1 stimulation alone; blue, conditioned response, i.e., M1 together with simultaneous or earlier F5 stimulation. Stimulus artifacts in volley recordings (and vertical arrows in PSTHs) show stimulus times. A: example showing a clear facilitatory effect on a single axon (CS22a46, non-D-responder). From top to bottom: F5 (400 μA): no clear response; M1 (200 μA): no clear response; F5 and M1 (C-T interval = −1.7 ms): significantly facilitated I3 and I5 responses. The conditioning of the I4-response did not reach statistical significance (73 sweeps/condition). Below, concomitant and superposed volley responses; conditioning facilitates the I3 volley. B: example showing a clear facilitatory effect on a single axon (CS22a61, non-D-responder). F5 (400 μA): no clear response; M1 (400 μA): clear I2-, I4-, I5-, and I6-responses; F5 and M1 (C-T interval = −1.5 ms): significantly facilitated I5-response. No significant conditioning effect in the I2-, I4-, and I6-responses, except a latency shift for I6 (218 sweeps/condition). Below: volley responses; very little conditioning effect on the volley. C: example showing a clear facilitatory effect on a single axon (CS22a16, D-responder). From top to bottom: F5 (2 × 250 μA): clear response, classified as I4 and I5; M1 (350 μA): a few D-responses followed by I2-responses; F5 and M1 (C-T interval = −3.1 ms): significantly facilitated D-, I1-, and I3-responses. No significant increase of the I2-response, but note latency shift (218 sweeps/condition). Below: volley responses. No responses to F5 shock double shock, but conditioned facilitation of I1-, I2-, and I3-waves, but not of the D-wave. D: example showing mixed suppression and facilitatory effect on a single axon (CS15c21, non-D-responder). F5: 400 μA, no clear response. M1: 300 μA, weak I1- and I2-, and clear I3-response. F5 and M1 (C-T interval = −2.9 ms): facilitation of I2-response, but not of I1 and a significant suppression of the I3-response (156 sweeps/condition). Below: volley responses. F5 alone gave both an I1 and later waves. Conditioning enhanced the later waves evoked from M1. Calibration bar for volleys: 10 μV (A–C), 5 μV (D).
Fig. 12.
Fig. 12.
Schematic diagram showing possible mechanisms underlying electrical excitation of D- and I-responses in corticospinal neurons. A highly diagrammatic representation of the possible mechanisms involved in the generation of responses in corticospinal tract neurons (CSTNs) by single-pulse intracortical stimuli delivered to M1 cortex is shown. Stimuli are delivered either through a default electrode, or through a 2nd electrode, 2.5 mm away. The tips of both electrodes are shown to lie within layer V. A 400-μA stimulus exerts its actions through activation of axons, not cell bodies: it excites directly large axons lying within 2 mm of the electrode tip (solid red circle for default site, dashed circle for 2nd site). Axons of CSTNs A and B (red) are excited directly from the default site, with a D-response being activated at the initial segment of their axons, marked “D”. CSTN B is also within range for direct excitation from the 2nd site, while A responds directly only to the default site. The stimulus also excites other intracortical axons (black horizontal lines), which mostly originate from local pyramidal neurons, but may also include cortical inputs from other brain regions. Bundles of these axons are shown running above and below layer V, and “a” indicates some sites of axonal activation. Impulses in axons that converge and terminate monosynaptically on CSTNs cause I1-responses (single arrowheads) (di Lazzaro and Ziemann 2013). Impulses convergent on local interneuronal circuits generate later, indirect (I) trans-synaptic responses (I2, I3, etc.) in CSTNs. These networks are indicated by double arrowheads. Networks near to the stimulating electrodes are most likely to be activated because more of their inputs are within the stimulated range, but also, within the networks, some of the thinner interneuron axons that are close to the electrodes may also be activated. Together, these provide a strong convergent input to D-responding CSTNS, like A and B, which also give multiple I-responses. Note that activation of any of the axons may involve various combinations of ortho- and antidromic conduction. More remote neurons, such as CSTN C (green), are beyond the range for direct activation, but do yield indirect responses. Axons emanating from this type of CSTN we have termed “non-D-responders” (green). Long-range corticocortical axons also excite some local interneuronal networks outside M1 (far right) to produce I-responses in a CSTNs such as CSTN E (another “non-D-responder”). Some CSTNs, such as CSTN D (black), receive little or no synaptic inputs excited by the stimulus; these are “nonresponders”. LCST, lateral corticospinal tract.

Similar articles

Cited by

References

    1. Amassian VE, Stewart M, Quirk GJ, Rosenthal JL. Physiological basis of motor effects of a transient stimulus to cerebral cortex. Neurosurgery 20: 74–93, 1987 - PubMed
    1. Borra E, Belmalih A, Gerbella M, Rozzi S, Luppino G. Projections of the hand field of the macaque ventral premotor area F5 to the brainstem and spinal cord. J Comp Neurol 518: 2570–2591, 2010 - PubMed
    1. Borchers S, Himmelbach M, Logothetis N, Karnath HO. Direct electrical stimulation of human cortex–the gold standard for mapping brain functions? Nat Rev Neurosci 13: 63–70, 2012 - PubMed
    1. Butovas S, Schwarz C. Spatiotemporal effects of microstimulation in rat neocortex: a parametric study using multielectrode recordings. J Neurophysiol 90: 3024–3039 200 - PubMed
    1. Cerri G, Shimazu H, Maier MA, Lemon RN. Facilitation from ventral premotor cortex of primary motor cortex outputs to macaque hand muscles. J Neurophysiol 90: 832–842, 2003 - PubMed

Publication types

LinkOut - more resources