. 2013;8(3):e57148.
doi: 10.1371/journal.pone.0057148. Epub 2013 Mar 11.

Bumetanide enhances phenobarbital efficacy in a rat model of hypoxic neonatal seizures

Affiliations

Bumetanide enhances phenobarbital efficacy in a rat model of hypoxic neonatal seizures

Ryan T Cleary et al. PLoS One. 2013.

Erratum in

  • PLoS One. 2013;8(8). doi:10.1371/annotation/48a011e6-e4d0-4706-9a28-857eba8cfb31. Berry, Gerard [corrected to Berry, Gerard T]

Abstract

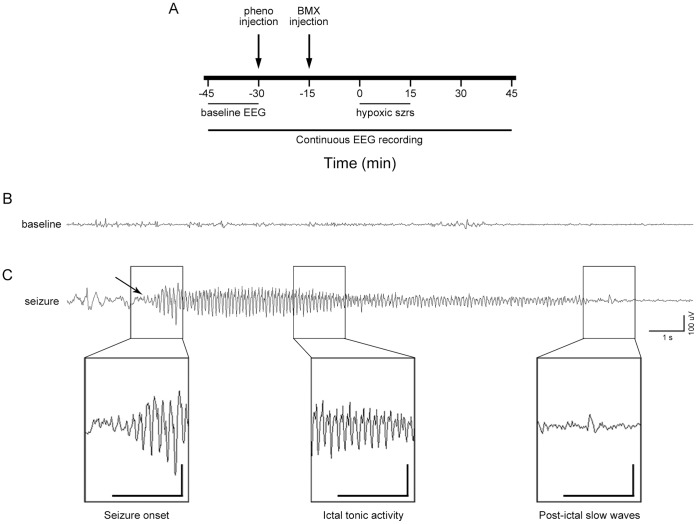
Neonatal seizures can be refractory to conventional anticonvulsants, and this may in part be due to a developmental increase in expression of the neuronal Na(+)-K(+)-2 Cl(-) cotransporter, NKCC1, and consequent paradoxical excitatory actions of GABAA receptors in the perinatal period. The most common cause of neonatal seizures is hypoxic encephalopathy, and here we show in an established model of neonatal hypoxia-induced seizures that the NKCC1 inhibitor, bumetanide, in combination with phenobarbital is significantly more effective than phenobarbital alone. A sensitive mass spectrometry assay revealed that bumetanide concentrations in serum and brain were dose-dependent, and the expression of NKCC1 protein transiently increased in cortex and hippocampus after hypoxic seizures. Importantly, the low doses of phenobarbital and bumetanide used in the study did not increase constitutive apoptosis, alone or in combination. Perforated patch clamp recordings from ex vivo hippocampal slices removed following seizures revealed that phenobarbital and bumetanide largely reversed seizure-induced changes in EGABA. Taken together, these data provide preclinical support for clinical trials of bumetanide in human neonates at risk for hypoxic encephalopathy and seizures.


Conflict of interest statement

Competing Interests: The authors have declared that no competing interests exist.

Figures

Figure 1
Figure 1. EEG recording schedule and representative electrographic seizure.
(A) After SWE implantation, continuous video-EEG was recorded from each rat for a total of 90 min. Recordings began 45 min before the start of hypoxia and ran an additional 30 min after the termination of hypoxia. Phenobarbital (pheno) was injected 30 min before hypoxia, and was followed by bumetanide (BMX) injection 15 min later. Epochs totaling 5 min were selected from the recording during hypoxia for EEG power analysis. Random selections from the baseline recording were used as controls. (B) Representative baseline EEG recording from a P10 rat prior to treatment and exposure to graded global hypoxia. (C) Typical electrographic seizure recorded from one hemisphere (other hemisphere not shown) in a P10 rat during the course of hypoxia. All electrographic seizures were accompanied by behavioral automatisms. Arrow indicates seizure onset. Insets of the EEG trace in an expanded time scale show seizure initiation, followed by a progressive buildup in spikes of increasing frequency and amplitude, regular tonic spike wave discharges, and post-ictal slowing following seizure termination.
Figure 2
Figure 2. Seizure number, cumulative duration, and EEG power attenuation in rats treated with phenobarbital and bumetanide.
The number of hypoxia-induced seizures (A), and cumulative seizure duration (B) were plotted for each treatment group. Vehicle-treated rats (n = 38) averaged 11.8±0.7 seizures, with an average cumulative seizure duration of 229±16.3 s. Treatment with phenobarbital (pheno) reduced seizure incidence by approximately 50% (n = 33, 6.8±1.0, 122±20.8 s), but did not completely attenuate activity. The combination of phenobarbital and 0.15 mg/kg bumetanide (pheno +0.15 mg/kg BMX) reduced seizure incidence by approximately 75% compared to vehicles (n = 35, 3.8±0.9, 61.3±16.1 s), and was more effective than phenobarbital alone. The higher dose (pheno +0.3 mg/kg BMX) was even more effective, decreasing seizure activity by ∼85% from vehicles (n = 25, 1.6±0.6, 38.5±17.0 s), and ∼75% from phenobarbital. (C) FFT analysis revealed increased spectral power between 4–12 Hz during seizures (vehicle). The average summed power between 4–12 Hz was plotted for each treatment group. Treatment with phenobarbital (n = 5, 56.8±8.1 µV), bumetanide (low dose: n = 3, 45.84±7.4 µV; high dose: n = 5, 47.1±5.5 µV), and the combination of phenobarbital and low dose bumetanide (n = 3, 30.0±9.4 µV) had little effect on summed power at these frequencies. However, in rats treated with the high dose combination (n = 4, 24.6±3.0 µV) summed power was reduced to levels similar to pre-hypoxia baseline EEG recordings (control). Mean ± SEM. Error bars indicate SEM. *p<0.05, **p<0.01, ***p<0.001.
Figure 3
Figure 3. Phenobarbital and bumetanide, singly or in combination, did not increase constitutive cell death in P10 rat pups.
Representative photomicrographs and magnified insets of TUNEL staining on 16 µm coronal sections of parietal cortex 48 h after treatment with (A) MK801 (positive control), (B) vehicle (DMSO in 0.9% saline) (n = 10), (C) phenobarbital (n = 11), (D) high dose bumetanide (n = 11), or (E) combined phenobarbital and high dose bumetanide (n = 8). Sections were lightly counterstained with methyl green. Pictures were taken at low power to maximize scoring, and magnified insets show detail. Other regions examined were amygdala, caudate-putamen, hippocampus, and thalamus. Apoptotic cells can be seen as dark pyknotic nuclei (arrows denote examples). No treatment significantly increased constitutive apoptosis compared to vehicle when analyzed within each region or in the total area (p = 0.129). A P7 rat pup treated with MK801 served as a positive control, and showed numerous apoptotic neurons clustered in layer II but also in other cortical layers. Scale bar = 200 µm (inset scale bar = 35 µm).
Figure 4
Figure 4. Bumetanide serum and brain levels, and brain:serum concentration ratios in control and hypoxic rats.
Serum bumetanide levels in rats after hypoxia-induced seizures (HS, B) and in littermate controls (A) were plotted for the low (0.15 mg/kg) and high (0.3 mg/kg) bumetanide doses. In controls, average elimination half-lives of 29.9 min (low dose) and 31.6 min (high dose) were calculated using GraphPad Prism. Best-fit values were calculated assuming a one-phase exponential decay. Brain levels for control (C) and HS (D) rats were plotted for the low and high bumetanide doses. Plots of the brain:serum concentration ratios (E, F) show that bumetanide was eliminated more slowly from the brain than from serum. Mean ± SEM. Error bars indicate SEM.
Figure 5
Figure 5. Seizure-induced alterations in NKCC1 and KCC2 protein levels.
Using Western Blot, NKCC1 and KCC2 protein levels were assessed in cortical and hippocampal tissue obtained from P10 rats at 1, 12, 24, 48, and 168 hr after hypoxia-induced seizures (HS), and compared to age-matched littermate controls. Optical densities for NKCC1 and KCC2 were normalized to actin, averaged for each time point, and then the average expression in hypoxic animals was normalized to that in control animals. NKCC1 (A) and KCC2 (B) expression was plotted as a percent of control (dotted line). NKCC1 increased transiently at 24 hr post-HS (n = 8, 138±10.5% control, p = 0.005) in cortex, but showed no significant change in hippocampus. KCC2 expression increased early at 1 hr post-HS (n = 4, 140±9.6% control, p = 0.004) in hippocampus, with a later cortical increase 24 hr post-HS (n = 8, 81±6.7% control, p = 0.025). The normalized ratio of NKCC1 to KCC2 (C) was then calculated as a measure of changes in the relative expression of NKCC1 and KCC2 from normal expression patterns. In the cortex, the ratio of NKCC1 to KCC2 initially decreased 1 hr after seizures (n = 7, 0.66±0.09 fold, p = 0.003), and then increased at 12 and 24 hr (12 hr: n = 7, 1.71±0.27 fold, p = 0.046; 24 hr: n = 8, 1.83±0.26 fold, p = 0.008), as compared to controls. In the hippocampus, NKCC1/KCC2 was significantly higher at 12 hr (n = 8, 1.39±0.09 fold, p = 0.016), as compared to controls. (D) Representative western blot images for NKCC1, KCC2, and actin protein levels in cortex (top) and hippocampus (bottom). C = control; HS = hypoxic seizures. Mean ± SEM. Error bars indicate SEM.*p<0.05, **p<0.01.
Figure 6
Figure 6. Hypoxic seizures induce a positive shift in EGABA in hippocampal CA1 pyramidal neurons.
Representative recordings of GABA-evoked currents in CA1 neurons from normoxic control hippocampal slices (A1) versus slices removed at 24 hr post-hypoxic seizures in vivo at P10 (A2). (B) Current–voltage curves for the recordings shown in A1 and 2. The data points were fitted with a straight line. (C) Summary of the reversal potential of the GABA-evoked currents in CA1 pyramidal neurons in slices removed after hypoxic seizures (n = 9, −58.58±2.72 mV) compared with control slices (n = 7, −67.70±3.26 mV). Error bars indicate SEM. *p<0.05.
Figure 7
Figure 7. The combination of phenobarbital and bumetanide alter EGABA in CA1 neurons from slices removed at 24 hr post-hypoxic seizures.
GABA-evoked currents were measured from hippocampal slices taken from rats (n = 6) 24 hr after hypoxia-induced seizures. (A) Typical examples of GABA-evoked currents in CA1 neurons at various holding potentials after application of phenobarbital (PB, 100 mM), and phenobarbital in combination with bumetanide (PB+BM). Treatment effects were compared to normal conditions (HS) prior to drug administration. (B) Current–voltage curves for the recordings shown in A. The data points were fitted with a straight line. (C) Summary of the reversal potential of GABA-evoked currents under different recording conditions: control (HS, −58.61±1.28 mV), phenobarbital only (PB, −58.46±1.58 mV), and phenobarbital in combination with bumetanide (PB+BM, −64.53±2.30 mV). Error bars indicate SEM. *p<0.05.

References

    1. Ronen GM, Buckley D, Penney S, Streiner DL (2007) Long-term prognosis in children with neonatal seizures: a population-based study. Neurology 69: 1816–1822. - PubMed
    1. Sankar R, Painter MJ (2005) Neonatal seizures: After all these years we still love what doesn’t work. Neurology 64: 776–777. - PubMed
    1. Scher MS, Alvin J, Gaus L, Minnigh B, Painter MJ (2003) Uncoupling of EEG-clinical neonatal seizures after antiepileptic drug use. PediatrNeurol 28: 277–280. - PubMed
    1. Glykys J, Dzhala VI, Kuchibhotla KV, Feng G, Kuner T, et al. (2009) Differences in cortical versus subcortical GABAergic signaling: a candidate mechanism of electroclinical uncoupling of neonatal seizures. Neuron 63: 657–672. - PMC - PubMed
    1. Silverstein FS, Jensen FE (2007) Neonatal seizures. AnnNeurol 62: 112–120. - PubMed

Publication types

MeSH terms