. 2013;8(3):e58276.
doi: 10.1371/journal.pone.0058276. Epub 2013 Mar 11.

Transcriptome analysis of spermatogenically regressed, recrudescent and active phase testis of seasonally breeding wall lizards Hemidactylus flaviviridis

Affiliations

Transcriptome analysis of spermatogenically regressed, recrudescent and active phase testis of seasonally breeding wall lizards Hemidactylus flaviviridis

Mukesh Gautam et al. PLoS One. 2013.

Abstract

Background: Reptiles are phylogenically important group of organisms as mammals have evolved from them. Wall lizard testis exhibits clearly distinct morphology during various phases of a reproductive cycle making them an interesting model to study regulation of spermatogenesis. Studies on reptile spermatogenesis are negligible hence this study will prove to be an important resource.

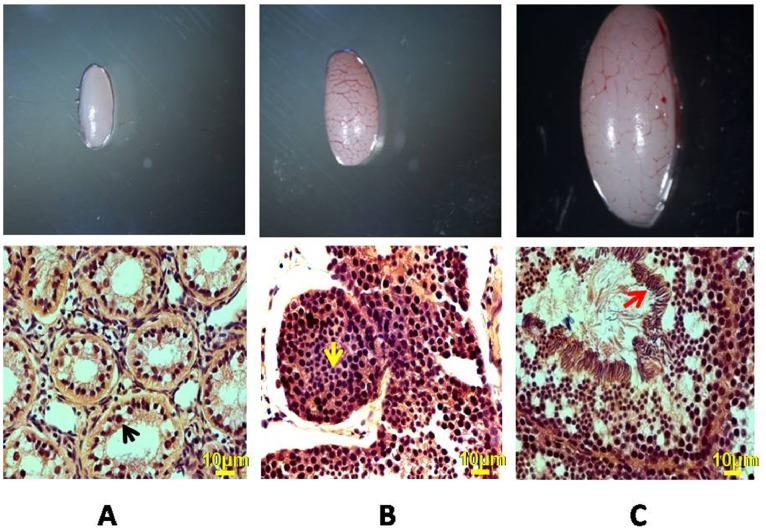
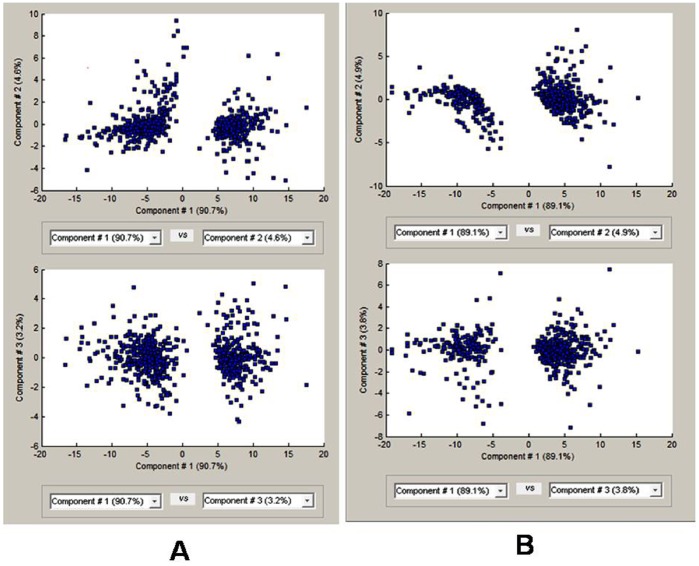
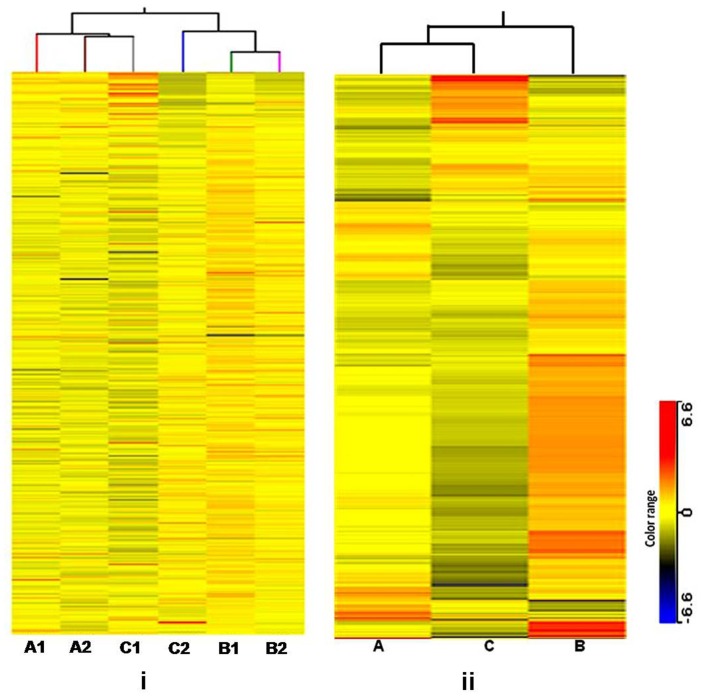
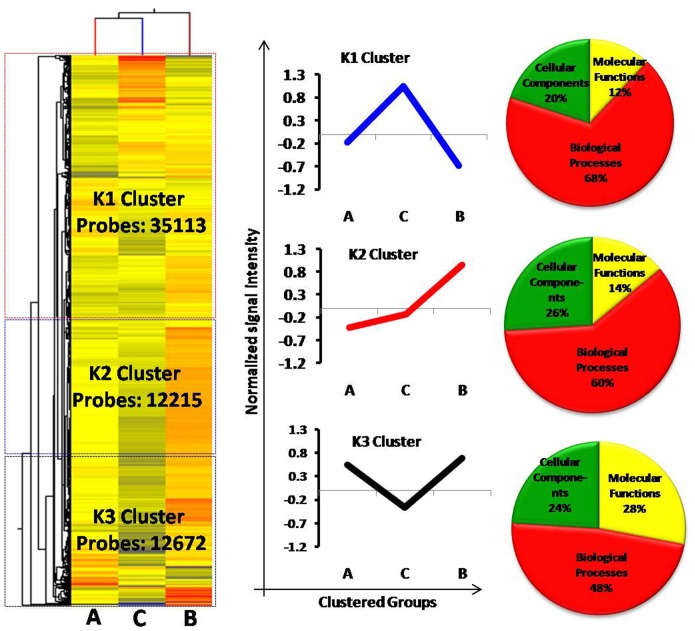
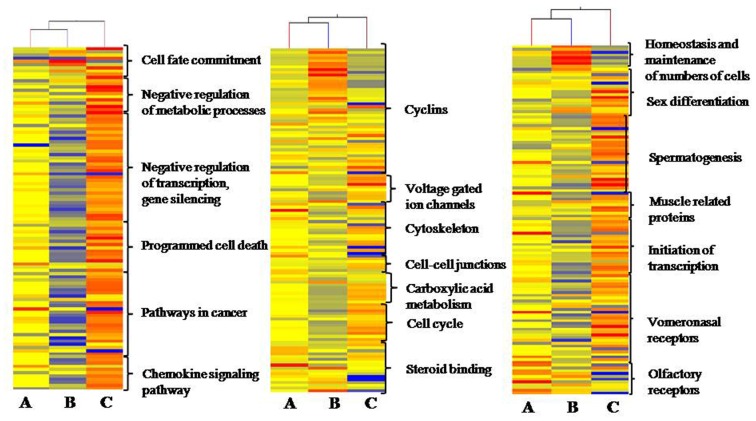
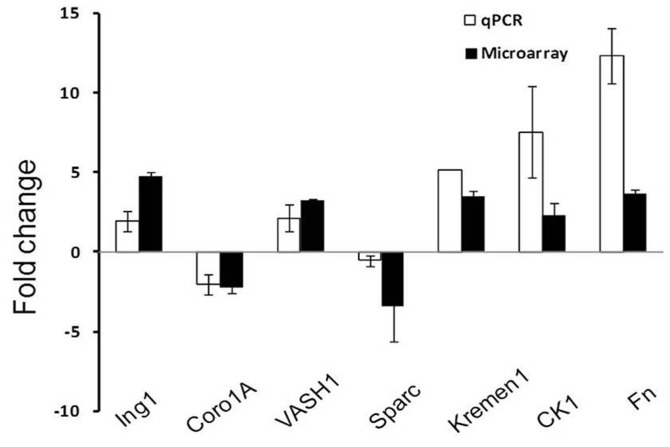
Methodology/principal findings: Histological analyses show complete regression of seminiferous tubules during regressed phase with retracted Sertoli cells and spermatognia. In the recrudescent phase, regressed testis regain cellular activity showing presence of normal Sertoli cells and developing germ cells. In the active phase, testis reaches up to its maximum size with enlarged seminiferous tubules and presence of sperm in seminiferous lumen. Total RNA extracted from whole testis of regressed, recrudescent and active phase of wall lizard was hybridized on Mouse Whole Genome 8×60 K format gene chip. Microarray data from regressed phase was deemed as control group. Microarray data were validated by assessing the expression of some selected genes using Quantitative Real-Time PCR. The genes prominently expressed in recrudescent and active phase testis are cytoskeleton organization GO 0005856, cell growth GO 0045927, GTpase regulator activity GO: 0030695, transcription GO: 0006352, apoptosis GO: 0006915 and many other biological processes. The genes showing higher expression in regressed phase belonged to functional categories such as negative regulation of macromolecule metabolic process GO: 0010605, negative regulation of gene expression GO: 0010629 and maintenance of stem cell niche GO: 0045165.

Conclusion/significance: This is the first exploratory study profiling transcriptome of three drastically different conditions of any reptilian testis. The genes expressed in the testis during regressed, recrudescent and active phase of reproductive cycle are in concordance with the testis morphology during these phases. This study will pave the way for deeper insight into regulation and evolution of gene regulatory mechanisms in spermatogenesis.


Conflict of interest statement

Competing Interests: The authors have declared that no competing interests exist.

Figures

Figure 1
Figure 1. Size and cross section of wall lizard testis.
A Very small seminiferous tubules, retracted Sertoli cells and only spermatognia are seen in regressed phase testis, black arrow. B Testis from recrudescence phase shows large seminiferous tubules, normal Sertoli cells and advanced germ cells, yellow arrow. C Testis from active phase is largest in size and sperm in seminiferous lumen can be noticed, red arrow. Bar = 10 µm. Note A = active phase; B = recrudescent phase and C = regressed phase.
Figure 2
Figure 2. Principal Component Analysis.
The PCA of genes differentially expressed between active and regressed phase. Upper panel shows PCA between component 1 and component 2 whereas lower panel shows PCA between component 1 and component 3 shown in A, while PCA of genes differentially expressed between recrudescence and regressed phase shown in B. Upper panel shows PCA between component 1 and component 2 whereas lower panel shows PCA between component 1 and component 3.
Figure 3
Figure 3. Unsupervised hierarchical clustering.
The two-way representation of unsupervised HCA of the expression levels, in logarithmic scale, of all the target probes/genes, Y-axis, in each sample, each column, and their clustering based on expressional distance Pearson correlation coefficient between samples in dendrogram formation, X-axis. Heat map shows the gene expression pattern in defined colour range. i Represents the unsupervised HCA of the all 6 samples, 2 samples each from active, recrudescence and regressed phases and ii showed the semi-unsupervised hierarchical clustering analysis and heat map of average expression of the replicates in all three groups. Note A = active phase; B = recrudescent phase and C = regressed phase.
Figure 4
Figure 4. Entity based K-mean cluster analysis of entire 60 K probe sets.
Entire data was divided in 3 clusters namely K1, K2 and K3. The trend of average expression has been shown by bar graph and Gene Ontology GO analysis has been represented by pie charts describing distribution of data enriching biological processes, molecular functions and cellular components. Note A = active phase; B = recrudescent phase and C = regressed phase.
Figure 5
Figure 5. Volcano plot and Venn analysis of differentially expressed genes.
A Volcano plot, whose X axis represents the fold change, log transformed, and Y axis, the p value, log transformed. If the intensity ratio of a gene in between control and target is more than 2 fold or less than 2 fold having p value less than 0.05, considered as a differentially expressed gene. The genes lying in red colored area are satisfying the differential change criteria and are identified as differentially expressed genes in between two conditions. B Venn diagram representing the distribution of differentially expressed, Fold change ≥2 and p-value ≤0.05, genes obtain in active Vs recrudescent phase, active Vs regressed phase and recrudescent Vs regressed phase testis samples analysis. Note that the areas shown in distribution analysis are not strictly in scale.
Figure 6
Figure 6. Functional clustering of biologically important genes.
Heat map showing changes in expression of genes related to some biologically important functional categories during active, recrudescent and regressed phase of wall lizard reproductive cycle. Heat maps were constructed using average of raw signals for each gene in microarray data.
Figure 7
Figure 7. Interactome and networks.
Interaction of three transcription factors, HNF-4, c-Myc and Sp1, with other important pathway candidate genes. These three transcription factors are prominently expressed commonly in both recrudescent and active phase.
Figure 8
Figure 8. Validation of microarray genes by quantitative Real Time PCR, qPCR.
Similar trends with high degree of concordance are represented in between Q-PCR and array data. Filled black bar represent the microarray data while hollow bar is for qPCR data.

References

    1. Fountaine TM, Benton MJ, Dyke GJ, Nudds RL (2005) The quality of the fossil record of Mesozoic birds. Proc Biol Sci 272: 289–294. - PMC - PubMed
    1. Unsicker K, Burnstock G (1975) Myoid cells in the peritubular tissue (Lamina propria) of the reptilian testis. Cell Tissue Res 163: 545–560. - PubMed
    1. Reddy PR, Prasad MR (1970) Hormonal control of the maintenance of spermatogenesis and sexual segment in the Indian house lizard Hemidactylus flaviviridis Ruppell. Gen Comp Endocrinol 14: 15–24. - PubMed
    1. Rai U, Haider S (1995) Effects of cyproterone acetate on FSH and testosterone influenced spermatogenesis, steroidogenesis and epididymis in the Indian wall lizard, Hemidactylus flaviviridis (Ruppell). Eur J Morphol 33: 443–455. - PubMed
    1. Small CL, Shima JE, Uzumcu M, Skinner MK, Griswold MD (2005) Profiling gene expression during the differentiation and development of the murine embryonic gonad. Biol Reprod 72: 492–501. - PMC - PubMed

Publication types