. 2013;8(3):e59517.
doi: 10.1371/journal.pone.0059517. Epub 2013 Mar 25.

Identification and Characterisation CRN Effectors in Phytophthora capsici Shows Modularity and Functional Diversity

Affiliations

Identification and Characterisation CRN Effectors in Phytophthora capsici Shows Modularity and Functional Diversity

Remco Stam et al. PLoS One. 2013.

Abstract

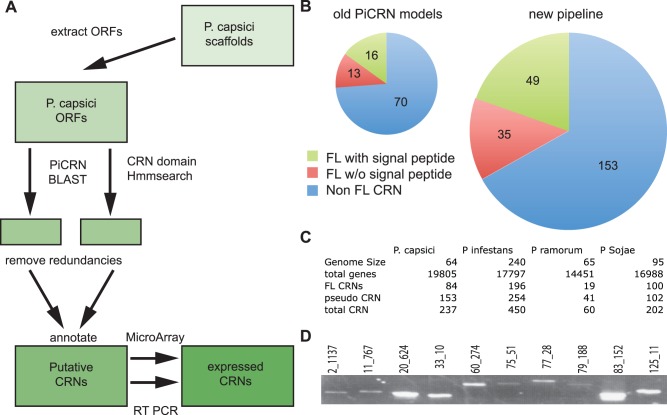
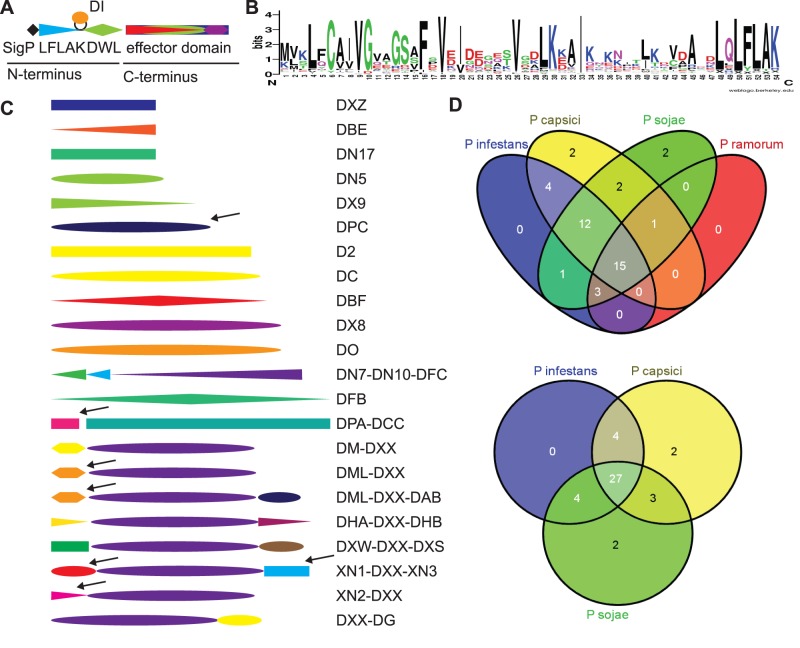
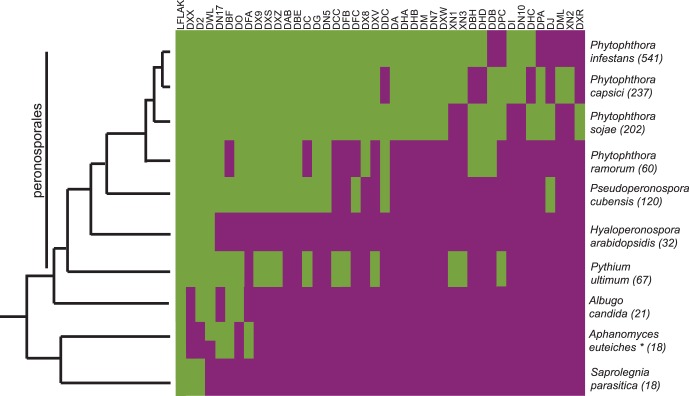
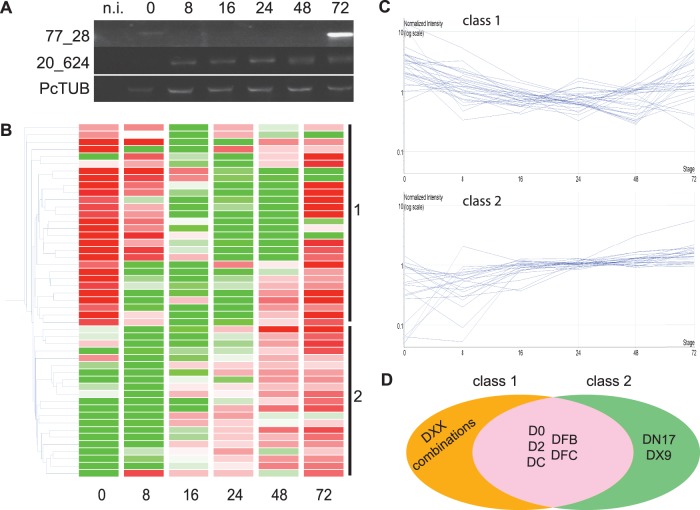
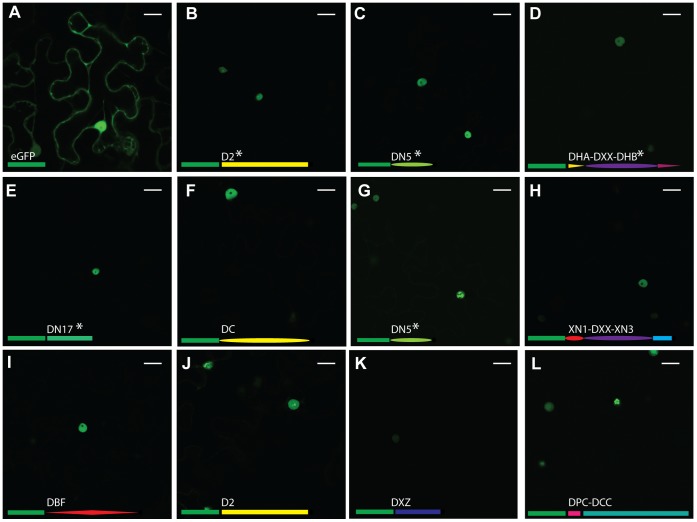
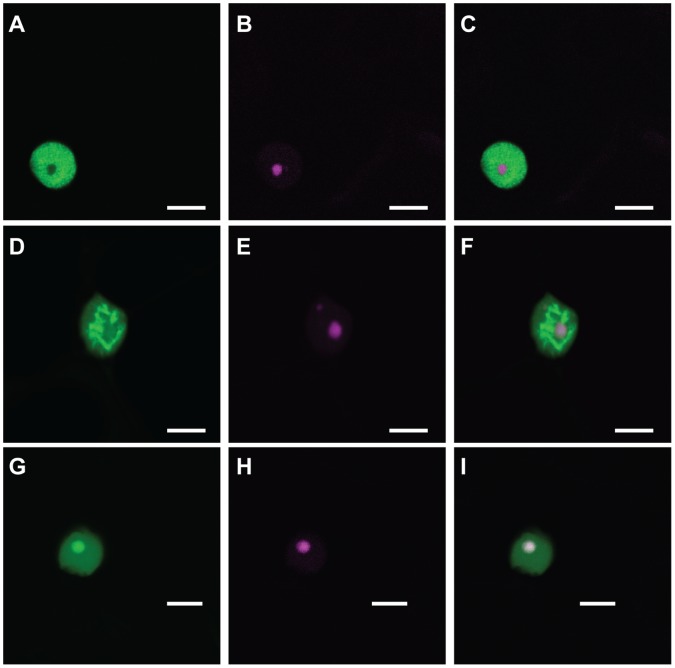
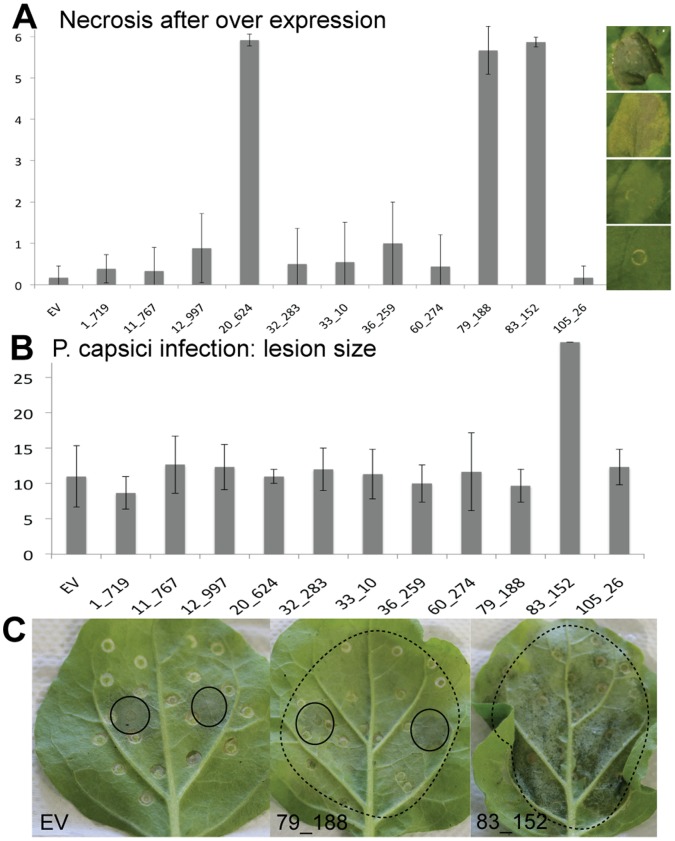
Phytophthora species secrete a large array of effectors during infection of their host plants. The Crinkler (CRN) gene family encodes a ubiquitous but understudied class of effectors with possible but as of yet unknown roles in infection. To appreciate CRN effector function in Phytophthora, we devised a simple Crn gene identification and annotation pipeline to improve effector prediction rates. We predicted 84 full-length CRN coding genes and assessed CRN effector domain diversity in sequenced Oomycete genomes. These analyses revealed evidence of CRN domain innovation in Phytophthora and expansion in the Peronosporales. We performed gene expression analyses to validate and define two classes of CRN effectors, each possibly contributing to infection at different stages. CRN localisation studies revealed that P. capsici CRN effector domains target the nucleus and accumulate in specific sub-nuclear compartments. Phenotypic analyses showed that few CRN domains induce necrosis when expressed in planta and that one cell death inducing effector, enhances P. capsici virulence on Nicotiana benthamiana. These results suggest that the CRN protein family form an important class of intracellular effectors that target the host nucleus during infection. These results combined with domain expansion in hemi-biotrophic and necrotrophic pathogens, suggests specific contributions to pathogen lifestyles. This work will bolster CRN identification efforts in other sequenced oomycete species and set the stage for future functional studies towards understanding CRN effector functions.


Conflict of interest statement

Competing Interests: The authors have declared that no competing interests exist.

Figures

Figure 1
Figure 1. CRN annotation in P. capsici A) Pipeline used to re-annotate P. capsici CRN genes.
ORFs were extracted from genome scaffolds. Known P. infestans CRNs and CRN HMM profiles were used to find putative CRNs. Candidates were filtered, annotated and verified via several methods. B) Visualisation of the different numbers of CRN-like genes identified using the predicted protein models of our new pipeline. Diameter of the circle represents the number of CRNs. C) Table showing gene size, gene number and number of (FL) CRNs for all sequenced Phytophthora spp. D) RT PCR on randomly selected CRN genes confirms presence on cDNA.
Figure 2
Figure 2. CRN domains in P. capsici A) Graphical representation of a CRN gene.
A typical CRN gene has an N-terminus consisting of a Signal Peptide, LFLAK domain, containing the LxLFLAK-motif containing domain and DWL domain, containing the HVLVVVP-motif, in some cases a small DI domain is inserted between LFLAK and DWL domains. The C-terminus contains the effector domain and shows large variation in domain structure. B) Sequence logo representing P. capsici LFLAK domain. This LFLAK domain shows very close homology to the one from P. infestans. C) Variation of C-terminal domains found in full length CRNs of P. capsici. Arrows indicate domains that are unique in full length genes in P. capsici. D) Venn diagrams showing the distribution of CRN domains amongst different Phytophthora spp.
Figure 3
Figure 3. Occurrence of CRN domains in different oomycete species.
Green = domain present, purple = domain absent. Total number of CRN-like genes is given between brackets. The tree left is adapted from Blair et al and Thines and Kamoun .
Figure 4
Figure 4. CRN gene expression upon infection A) RT-PCR on cDNA from tomato infected with P. capsici.
Samples were collected on selected timepoints (hours post infection). B) Heat map showing expression pattern for full length P. capsici CRN genes. Green is down regulated, Red is upregulated compared to the median of each sample. Gene classes are indicated on the right. Numbers at the bottom indicate the time after infection that the samples were taken. C) Expression profiles for CRN genes group in two different classes. Class 1 show genes that are upregulated compared to their mean expression values directly upon inoculation and after downregulation increase in expression in the later time points. Class 2 genes have upon inoculation expression values lower than their mean, but expression goes up during the course of infection, generally in the latest stages. D) Venn diagram showing the composition of both expression classes. Genes with DXX domain (combinations) all sit in class 1.
Figure 5
Figure 5. Localisation of GFP-tagged CRN C-termini.
A) shows localisation of free GFP. B-L) show a diverse range of GFP-tagged CRN C-termini. B = 1_719, C = 11_767, D = 12_997, E = 20_624, F = 32_283, G = 33_10, H = 36_259, I = 60_274, J = 79_188, K = 83_152, L = 105_26. All tested CRN fusions localise to the nucleus of the cell. Different subnuclear localisations can be observed for some CRNs (B, G, J, L). The domain organisations of the C-termini are represented as fused to GFP (green rectangle) for each image. NLS are predicted to be present in the genes marked with *. Scale bar = 25 µm.
Figure 6
Figure 6. Different subnuclear localisations can be observed for CRN C-termini.
First column shows GFP-tagged CRNs, second column shows RFP-tagged fibrillarin in the nucleolus and cajal body (Panel E). Third column shows overlay image. Scale bar = 10 µm.
Figure 7
Figure 7. Phenotypic and functional analyses of CRN effector domains in planta.
A) Only three CRNs caused necrosis after over-expression in plants. Bars show average values for at least three independent infiltration events with four or more infiltration sites per construct per event. B) One CRN had a direct effect on virulence of P. capsici. Lesion size for all other CRNs was similar to that of the empty vector (EV) control. Error bars show standard deviations within the samples. Lesion size was measured during three independent infection events using four infection sites per construct. C) Onset of necrosis was not responsible for increased virulence. Panel 2 shows necrosis onset (dotted circles) for 79_188, but no increase in P. capsici lesion size (full circles) as seen for 83_152 (Panel 3). Panel A, X-axis: necrosis score as defined by picture panels on the right, Panel B X-Axis, Lesion size in mm.

References

    1. Bozkurt TO, Schornack S, Banfield MJ, Kamoun S (2012) Oomycetes, effectors, and all that jazz. Current Opinion in Plant Biology 15: 9. - PubMed
    1. Lamour KH, Stam R, Jupe J, Huitema E (2012) The oomycete broad-host-range pathogen Phytophthora capsici. Molecular Plant Pathology 13: 329–337. - PMC - PubMed
    1. Birch PR, Rehmany AP, Pritchard L, Kamoun S, Beynon JL (2006) Trafficking arms: oomycete effectors enter host plant cells. Trends Microbiol 14: 8–11. - PubMed
    1. Kamoun S (2007) Groovy times: filamentous pathogen effectors revealed. Curr Opin Plant Biol 10: 358–365. - PubMed
    1. Stassen JHM, Van den Ackerveken G (2011) How do oomycete effectors interfere with plant life? Current Opinion in Plant Biology 14: 407–414. - PubMed

Publication types

MeSH terms

LinkOut - more resources