

doi: 10.1186/gb-2013-14-3-r30.
CRAC: an integrated approach to the analysis of RNA-seq reads
- PMID: 23537109
- PMCID: PMC4053775
- DOI: 10.1186/gb-2013-14-3-r30
Item in Clipboard
CRAC: an integrated approach to the analysis of RNA-seq reads
Genome Biol.
.
Abstract
A large number of RNA-sequencing studies set out to predict mutations, splice junctions or fusion RNAs. We propose a method, CRAC, that integrates genomic locations and local coverage to enable such predictions to be made directly from RNA-seq read analysis. A k-mer profiling approach detects candidate mutations, indels and splice or chimeric junctions in each single read. CRAC increases precision compared with existing tools, reaching 99:5% for splice junctions, without losing sensitivity. Importantly, CRAC predictions improve with read length. In cancer libraries, CRAC recovered 74% of validated fusion RNAs and predicted novel recurrent chimeric junctions. CRAC is available at http://crac.gforge.inria.fr.
Figures
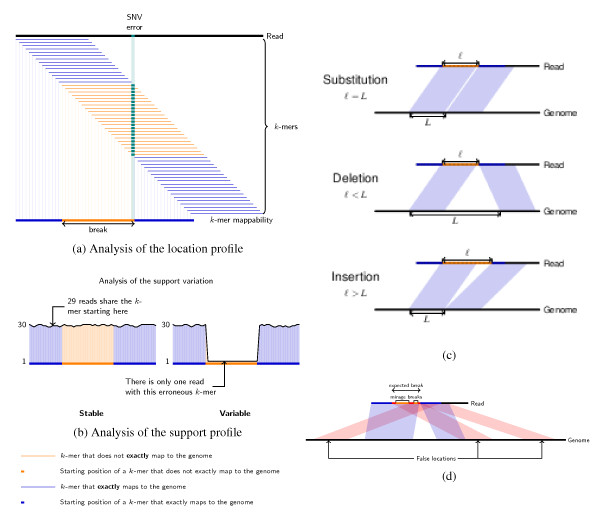
The CRAC algorithm. (a) Illustration of a break in the location profile. We consider each k-mer of the read and locate it exactly on the genome. In all figures, located k-mers are shown in blue, and unmapped k-mers in light orange. If the read differs from the genome by, for example an SNV or an error, then the k-mers containing this position are not located exactly on the genome. The interval of positions of unmapped k-mers is called a break. The end position of the break indicates the error or SNV position. (b) The support profile. The support value of a k-mer is the number of reads from the collection in which this k-mer appears at least once. The two plots show the support profile as a black curve on top of the location profile (in blue and orange). The support remains high (left plot) over the break if many reads covering this region are affected by a biological difference (for example, a mutation); it drops in the region of the break when the analyzed read is affected by a sequencing error; in this case, we say the support is dropping. (c) Rules for differentiating a substitution, a deletion, or an insertion depending on the break. Given the location profile, one can differentiate a substitution, a deletion, or an insertion by computing the difference between the gap in the genome and the gap in the read between k-mers starting before and after the break. (d) False locations and mirage breaks. When false locations occur inside or at the edges of a break they cause mirage breaks. False locations are represented in red. The break verification and break merging procedures correct for the effects of false locations to determine the correct break boundaries (and for example the correct splice junction boundaries) to avoid detecting a false chimera (Rule 2a) instead of a deletion. SNV: single nucleotide variant
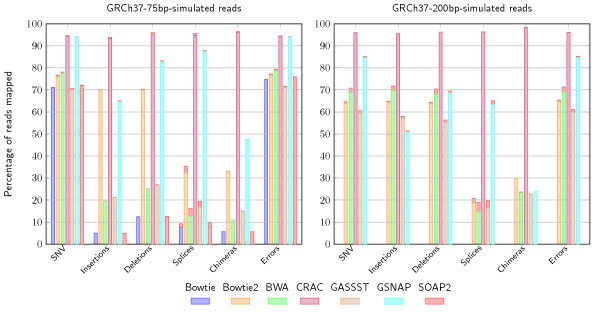
Comparison of mapping results by category for seven tools. The figure shows the mapping by event category on simulated RNA-seq against the human genome on datasets with short and long reads (left 42M, 75 nt; right 48M, 200 nt) for seven different mapping tools: Bowtie, Bowtie2, BWA/BWA-SW, CRAC, GASSST, GSNAP, and SOAP2. We consider six categories of reads depending on whether they contain an SNV, an insertion, a deletion, a junction, a sequence error, or a chimeric splice junction (a chimera). In each category, the bar is the percentage of those reads mapped at a unique location by the corresponding tool. The red tip at the top of the bar is the percentage of incorrectly mapped reads. With 75 nt reads, CRAC is better than the other tools, reaching a sensitivity >90% and a precision >95% whatever the category. The other tools except GSNAP are below 50% sensitivity for mapping reads in categories where spliced alignments are needed (for which they are not intended) and for reads containing insertions or deletions. With 200 nt reads, CRAC remains by far the most sensitive and specific tool; the difference between CRAC and GSNAP and Bowtie2 increased in all categories. Compared to short reads, the other tools had a better mapping of insertion and deletion containing reads. SNV: single nucleotide variant
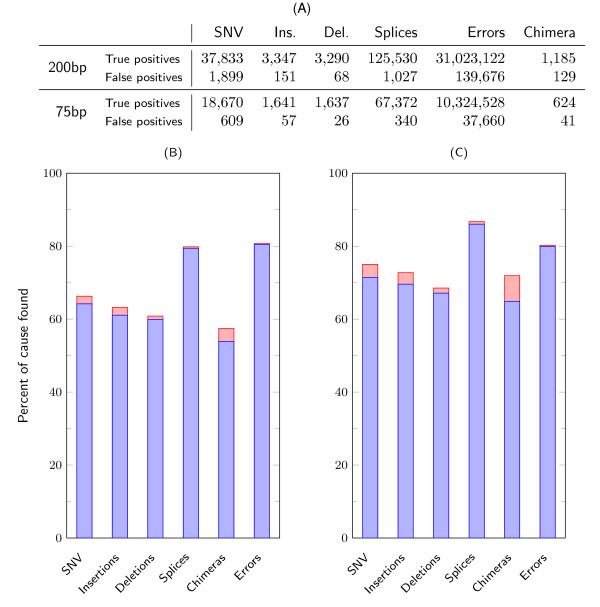
Sensitivity and precision of CRAC predictions by category for human simulated data. (A) Absolute numbers of true and false positives reported by CRAC. These figures are the number of distinct events, say SNVs, reported by CRAC, not the number of reads containing the same SNV. False positives represent a small fraction of its output, thereby indicating a high level of precision. (B) and (C) For each category, the figure shows the proportion of events found by CRAC for the 75 nt and 200 nt datasets. The blue bars are the true positives, while the red bars on top are the false positives. The height of a blue bar gives CRAC's sensitivity, and the relative height of the red part of the bar gives the precision. For the two read lengths, for all categories the sensitivity increases with longer reads, while the precision in each category varies only a little. SNV: single nucleotide variant
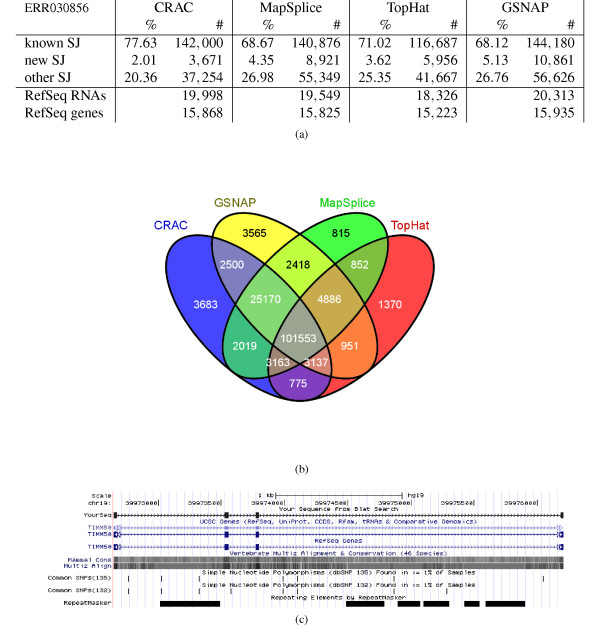
Splice junction detection using human real RNA-seq: comparison and agreement. The figure shows the detection of splice junctions by CRAC, MapSplice, TopHat, and GSNAP for a human six-tissue RNA-seq library of 75M 100 nt reads (ERR030856). (a) Number and percentage of known, new, and other splice junctions detected by each tool with +/−3 nt tolerance for ERR030856. (b) Venn diagram showing the agreement among the tools on known RefSeq splice junctions (KJs). Additional file 4 has pending data for novel junctions (NJs) and RefSeq transcripts. (c) A read spanning four exons (2 to 5) and three splice junctions of the human TIMM50 gene displayed by the UCSC genome browser. The included exons, numbers 3 and 4, measure 32 and 22 nt, respectively. So exon 3 has exactly the k-mer size used in this experiment. KJ: known splice junction; SJ: splice junction
References
-
- Mitelman F, Johansson B, Mertens F. Mitelman database of chromosome aberrations and gene fusions in cancer. 2013. http://cgap.nci.nih.gov/Chromosomes/Mitelman
Publication types
MeSH terms
Substances
LinkOut - more resources
Full Text Sources
Other Literature Sources
Molecular Biology Databases
Miscellaneous
