. 2013 Mar 27:12:24.
doi: 10.1186/1476-4598-12-24.

Short-term single treatment of chemotherapy results in the enrichment of ovarian cancer stem cell-like cells leading to an increased tumor burden

Affiliations

Short-term single treatment of chemotherapy results in the enrichment of ovarian cancer stem cell-like cells leading to an increased tumor burden

Khalid Abubaker et al. Mol Cancer. .

Abstract

Over 80% of women diagnosed with advanced-stage ovarian cancer die as a result of disease recurrence due to failure of chemotherapy treatment. In this study, using two distinct ovarian cancer cell lines (epithelial OVCA 433 and mesenchymal HEY) we demonstrate enrichment in a population of cells with high expression of CSC markers at the protein and mRNA levels in response to cisplatin, paclitaxel and the combination of both. We also demonstrate a significant enhancement in the sphere forming abilities of ovarian cancer cells in response to chemotherapy drugs. The results of these in vitro findings are supported by in vivo mouse xenograft models in which intraperitoneal transplantation of cisplatin or paclitaxel-treated residual HEY cells generated significantly higher tumor burden compared to control untreated cells. Both the treated and untreated cells infiltrated the organs of the abdominal cavity. In addition, immunohistochemical studies on mouse tumors injected with cisplatin or paclitaxel treated residual cells displayed higher staining for the proliferative antigen Ki67, oncogeneic CA125, epithelial E-cadherin as well as cancer stem cell markers such as Oct4 and CD117, compared to mice injected with control untreated cells. These results suggest that a short-term single treatment of chemotherapy leaves residual cells that are enriched in CSC-like traits, resulting in an increased metastatic potential. The novel findings in this study are important in understanding the early molecular mechanisms by which chemoresistance and subsequent relapse may be triggered after the first line of chemotherapy treatment.


Figures

Figure 1
Figure 1
Morphological features of OVCA433 and HEY cell lines under normal culture conditions (control) and after treatment with chemotherapy. (A) OVCA 433 cell line was treated with cisplatin (5 μg/ml) for five days, paclitaxel (2 ng/ml) for three days and combination of cisplatin and paclitaxel (2.5 μg/ml cisplatin and 1 ng/ml paclitaxel) for three days. (B) HEY cell line was treated with cisplatin (1 μg/ml) for five days, paclitaxel (1 ng/ml) for three days and combination of cisplatin and paclitaxel ( 1 μg/ml cisplatin and 1 ng/ml paclitaxel) for three days. The images were assessed by phase contrast microscope. Magnification- 100x, scale bar = 10 μm.
Figure 2
Figure 2
Expression and immunolocalization of (A) ERCC1 and (B) β-tubulin isotype III in HEY cell line in response to cisplatin, paclitaxel and combination treatment. The images were evaluated using mouse monoclonal (green) and rabbit polyclonal (red) antibodies as described in the Materials and methods section. Cellular staining was visualized using secondary Alexa 488 (green) and Alexa 590 (red) fluorescent labelled antibodies. Nuclear staining was visualized using DAPI (blue) staining. Images are representative of three independent experiments. Magnification 200x; scale bar = 10 μM. (C) The mean fluorescence intensity was quantified using Cell-R software (Olympus Soft Imaging Solutions). Significant variations between the groups are indicated by ** P < 0.01, *** P < 0.001.
Figure 3
Figure 3
The effects of cisplatin, paclitaxel and combination treatments on the expression of CSC-like markers in HEY cells. Untreated or chemotherapy treated cells were incubated with either control IgG or relevant primary antibodies against the respective CSC-like markers followed by secondary goat anti-mouse IgG conjugated with phycoerythrin. The filled histogram in each figure is control IgG, black lines indicate protein expression in control cells while broken lines demonstrate protein expression in treated cells. Results are representative of 3–4 independent experiments.
Figure 4
Figure 4
mRNA expression of EpCAM, Nanog, CD44, CD117 and Oct4 in HEY cell line in response to chemotherapy treatments (cisplatin, paclitaxel and combination). Cells were treated with or without chemotherapy, RNA was extracted, cDNA was prepared and qPCR was performed as described in the Materials and methods section. The resultant mRNA levels were normalized to 18S mRNA. The experiments were performed using four independent HEY samples in triplicate. Significant intergroup variations are indicated by *P <0.05, ** P < 0.01, *** P < 0.001.
Figure 5
Figure 5
Effects of chemotherapy on the sphere forming ability of HEY cells. (A) The sphere-forming assay was performed on low attachment plates as described in the Material and methods section. The total number of spheres was counted in the 24 well plates after 21 days as described in the Methods and materials. The experiment was performed three times in triplicate. Images are representative of a section of a 24 well plate. Black arrows indicate disaggregating cells in control spheres in 21 days. Magnification 200x; scale bar = 10 µM. (B) Significantly different from control untreated cells indicated by *P<0.05, *** P<0.001.
Figure 6
Figure 6
Tumor burden of mice injected with untreated control and chemotherapy treated HEY cells. (A) Total tumor burden obtained from mice 6 weeks after ip injection of control and chemotherapy treated HEY cells. 5x10⁶ cells were inoculated in each case. (B) Average percentage of tumor debulked from mice 6 weeks post ip injection of control and chemotherapy treated HEY cells. The average tumor weight was standardised to total mouse body weight. Data has been extrapolated from a minimum of n = 6 mice in each group. Significant increase in tumor burden in cisplatin and paclitaxel treated HEY cell derived tumors compared to control untreated group, *P < 0.05. Images represent tumors debulked from one mouse in each group.
Figure 7
Figure 7
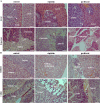
H and E staining of control and chemotherapy treated HEY cell derived tumor associated infiltrated organs in mice. 5 x 10⁶ cells were injected ip in each mouse. (A) Histological images of liver and pancreas showing infiltration of control and chemotherapy treated HEY cells in mice. (B) Histological images of mice kidney and colon injected with control and chemotherapy treated cells. Control cells surround the kidney with no invasion. Cisplatin treated cells do not invade kidney. Arrows indicate tumor cells invading the respective organs. Magnification 200X, scale bar = 10 μm.
Figure 8
Figure 8
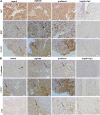
(A-B) Immunohistochemistry images of mouse tumors generated from ip transplantation of control, cisplatin and paclitaxel-treated HEY cells. Tumor sections were stained with antibodies specific for cyt7, Ki67, CA125, E-cadherin, CD117 and Oct4 as described in the Methods and material section. Magnification 200X, scale bar = 10 μm. Black arrows indicate specific antigen expression in respective tumor sections.
Figure 9
Figure 9
Mouse model of chemoresistance and associated recurrence in ovarian cancer. Control untreated and residual HEY cells after treatment with cisplatin or paclitaxel in vitro were injected (ip) into nude mice (n = 18, n = 6/group) and followed for 5–7 weeks. Cisplatin and paclitaxel treated cells enriched in CSC-like markers generated significantly increased tumor burden as well as xenografts with enhanced expression of CD117, Oct4, CA125, Ki67 and E-cadherin compared to tumors derived from non treated HEY cells. This suggests that chemotherapy treatment promotes CSC-dependent enhanced tumor progression in a mouse model of ovarian cancer.

References

    1. Lengyel E. Ovarian cancer development and metastasis. Am J Pathol. 2010;177:1053–1064. doi: 10.2353/ajpath.2010.100105. - DOI - PMC - PubMed
    1. McGuire WP, Hoskins WJ, Brady MF, Kucera PR, Partridge EE, Look KY, Clarke-Pearson DL, Davidson M. Cyclophosphamide and cisplatin compared with paclitaxel and cisplatin in patients with stage III and stage IV ovarian cancer. N Engl J Med. 1996;334:1–6. doi: 10.1056/NEJM199601043340101. - DOI - PubMed
    1. Judson PL, Watson JM, Gehrig PA, Fowler WC Jr, Haskill JS. Cisplatin inhibits paclitaxel-induced apoptosis in cisplatin-resistant ovarian cancer cell lines: possible explanation for failure of combination therapy. Cancer Res. 1999;59:2425–2432. - PubMed
    1. Jekunen AP, Christen RD, Shalinsky DR, Howell SB. Synergistic interaction between cisplatin and taxol in human ovarian carcinoma cells in vitro. Br J Cancer. 1994;69:299–306. doi: 10.1038/bjc.1994.55. - DOI - PMC - PubMed
    1. Brown R, Clugston C, Burns P, Edlin A, Vasey P, Vojtesek B, Kaye SB. Increased accumulation of p53 protein in cisplatin-resistant ovarian cell lines. Int J Cancer. 1993;55:678–684. doi: 10.1002/ijc.2910550428. - DOI - PubMed

Publication types

MeSH terms