. 2013 May;13(5):459-64.
doi: 10.1016/S1473-3099(12)70314-6. Epub 2013 Mar 25.

Community viral load as a measure for assessment of HIV treatment as prevention

Affiliations

Community viral load as a measure for assessment of HIV treatment as prevention

William C Miller et al. Lancet Infect Dis. 2013 May.

Abstract

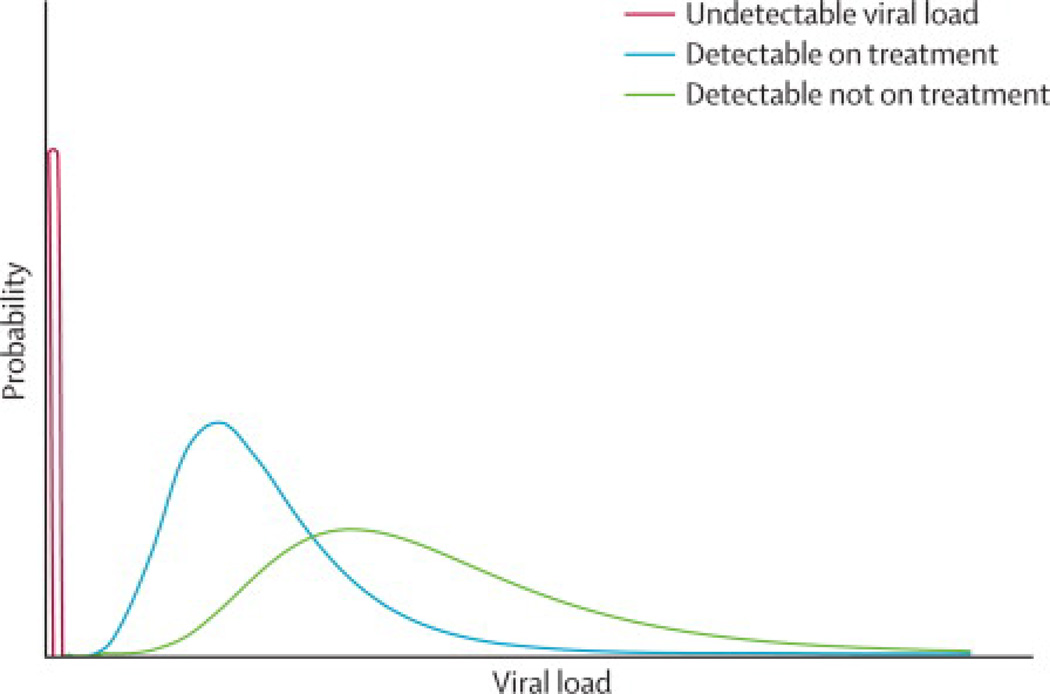
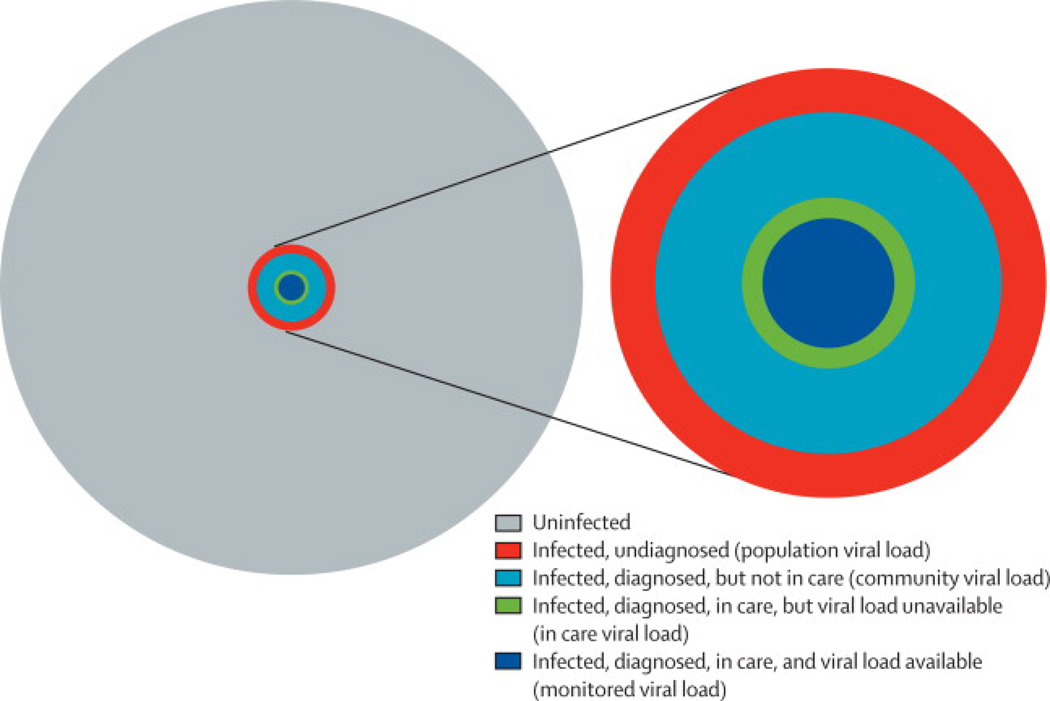
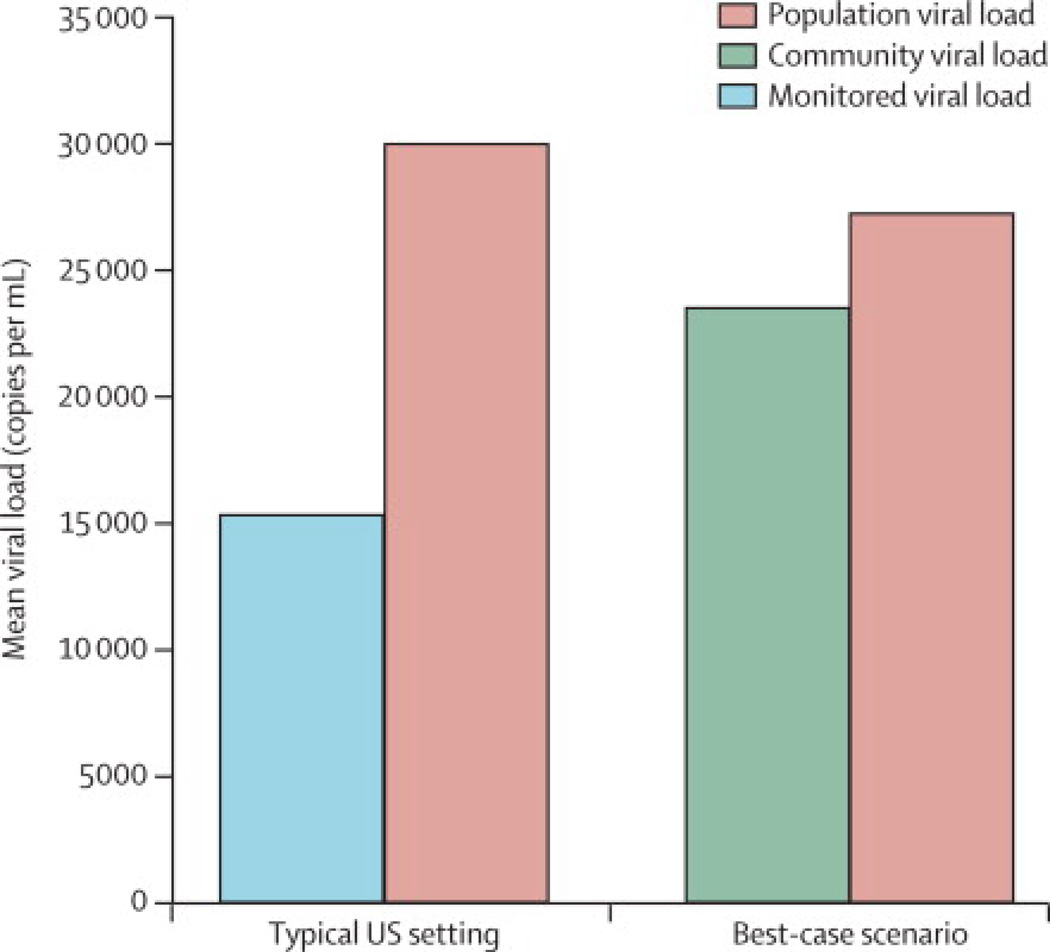
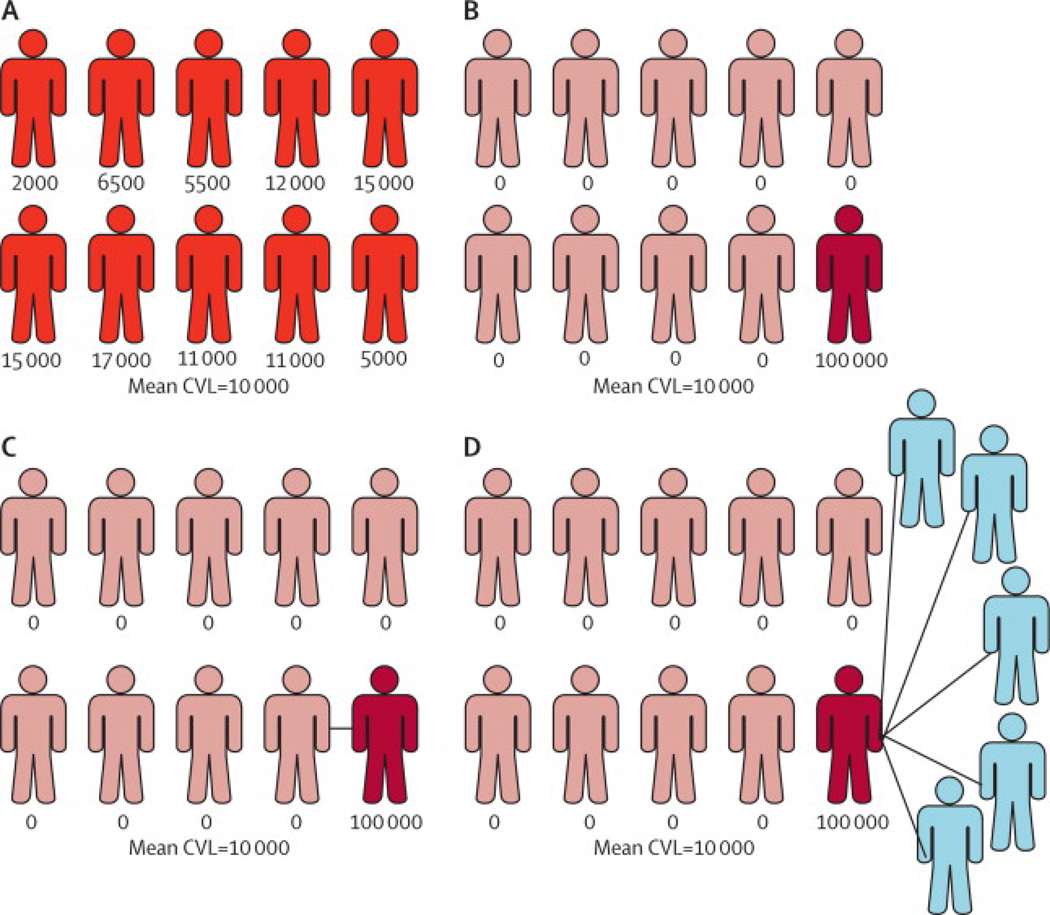
Community viral load, defined as an aggregation of individual viral loads of people infected with HIV in a specific community, has been proposed as a useful measure to monitor HIV treatment uptake and quantify its effect on transmission. The first reports of community viral load were published in 2009, and the measure was subsequently incorporated into the US National HIV/AIDS Strategy. Although intuitively an appealing strategy, measurement of community viral load has several theoretical limitations and biases that need further assessment, which can be grouped into four categories: issues of selection and measurement, the importance of HIV prevalence in determining the potential for ongoing HIV transmission, interpretation of community viral load and its effect on ongoing HIV transmission in a community, and the ecological fallacy (ie, ecological bias). These issues need careful assessment as community viral load is being considered as a public health measurement to assess the effect of HIV care on prevention.


Figures

Figure 1
Figure 1. Schematic representation of viral load distribution in a hypothetical HIV-infected population
Any population of HIV-infected persons will consist of individuals with undetectable viral loads (red curve), individuals with detectable viral loads who are receiving treatment (blue curve), and individuals with detectable viral loads who are not receiving treatment (green curve). Diagram provides qualitative representation of expected viral load distribution; actual distribution will be specific to a particular population.
Figure 2
Figure 2. Relationship between population subgroups and CDC-defined aggregate measures of viral load
In the set of concentric circles representing an entire hypothetical population (gray) and various population sub-groups (each a different color), subpopulations represented by a given, smaller circle belong to all groups represented by larger, surrounding circles. The size of each circle is proportional to the size of a given sub-group, assuming 15% HIV prevalence (hypothetical), 79% of cases diagnosed, 50% of diagnosed cases in care, and 75% of cases in care with viral loads available (hypothetical). For each CDC-defined viral load metric listed on the right side of the figure, the origin of the corresponding arrow indicates the sub-population (including all smaller sub-populations) contributing to the metric. Notably, none of the proposed metrics accounts for the size of the uninfected population (i.e., 1 – prevalence).
Figure 3
Figure 3. Estimated mean values of true population viral load, community viral load, and monitored viral load as defined by CDC
Population viral load = mean viral load among all HIV-infected individuals (theoretical; currently unobserved). Monitored viral load = estimated mean viral load as measurable in settings with VL data available only for persons in care. Community viral load = estimated mean viral load for persons in and out of care, excluding undiagnosed, as measured in a best-case setting (based on San Francisco data). A detailed description of the methods used in generating the figure is contained in the supplemental material. Briefly, figure assumptions and calculations were based on published estimates of the proportions of HIV-infected populations in key subgroups along the HIV care cascade (ref [1] for San Francisco, ref [14] for the US overall), proportions of infection-unaware persons with acute infection [18, 19], and mean viral loads in each sub-group [1, 18, 20].
Figure 4
Figure 4. Representation of populations with identical prevalence and community viral loads, but different potential for ongoing transmission
A) Viral loads distributed between 2000 and 20,000; B) Viral loads <50 in 9 persons and 100,000 in 10th person; C) Population B with person with high viral load in monogamous relationship with HIV-infected, suppressed person; D) Population B with person with high viral load with multiple uninfected partners.

References

    1. Das M, Chu PL, Santos GM, et al. Decreases in community viral load are accompanied by reductions in new HIV infections in San Francisco. PLoS ONE. 2010;5:e11068. - PMC - PubMed
    1. Wood E, Kerr T, Marshall BD, et al. Longitudinal community plasma HIV-1 RNA concentrations and incidence of HIV-1 among injecting drug users: prospective cohort study. BMJ. 2009;338:b1649. - PMC - PubMed
    1. Montaner JS, Lima VD, Barrios R, et al. Association of highly active antiretroviral therapy coverage, population viral load, and yearly new HIV diagnoses in British Columbia, Canada: a population-based study. Lancet. 2010;376:532–539. - PMC - PubMed
    1. Castel AD, Befus M, Willis S, et al. Use of the community viral load as a population-based biomarker of HIV burden. AIDS. 2012;26:345–353. - PubMed
    1. Jain V, Liegler T, Chamie G, et al. CROI. Seattle, WA: 2012. Mar 5–8, Assessment of community viral load using a fingerprick-based blood collection method: Uganda. 2012, 2012;

Publication types

Substances