. 2013 Jul;20(7):898-909.
doi: 10.1038/cdd.2013.17. Epub 2013 Mar 29.

Two hot spot mutant p53 mouse models display differential gain of function in tumorigenesis

Affiliations

Two hot spot mutant p53 mouse models display differential gain of function in tumorigenesis

W Hanel et al. Cell Death Differ. 2013 Jul.

Erratum in

Abstract

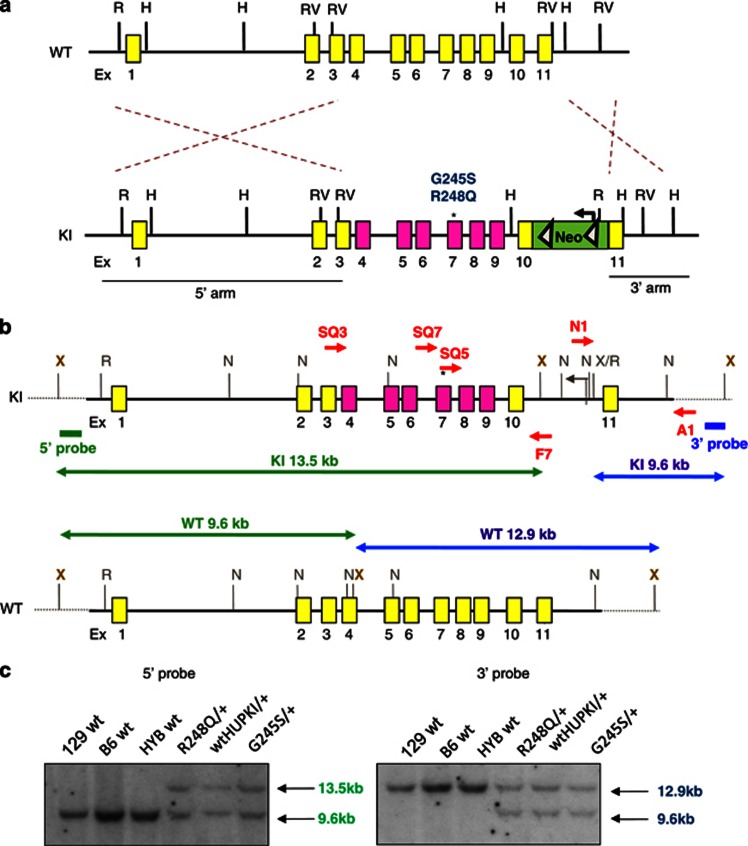
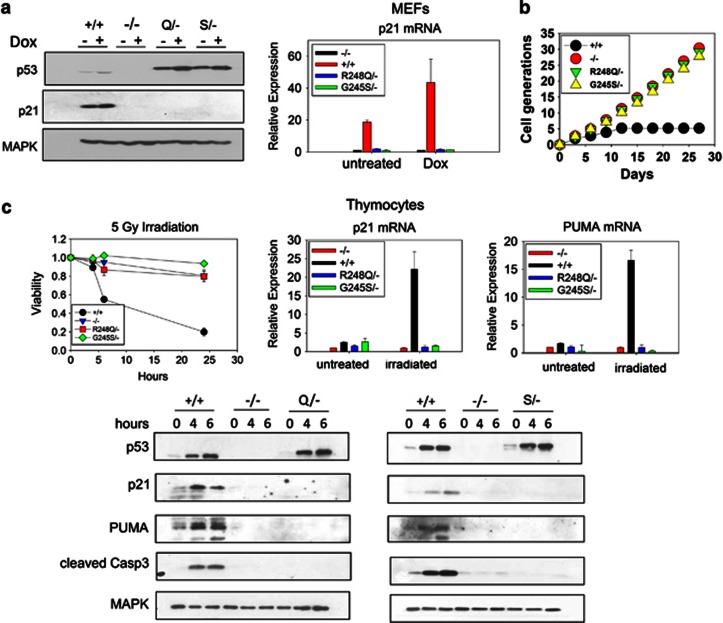
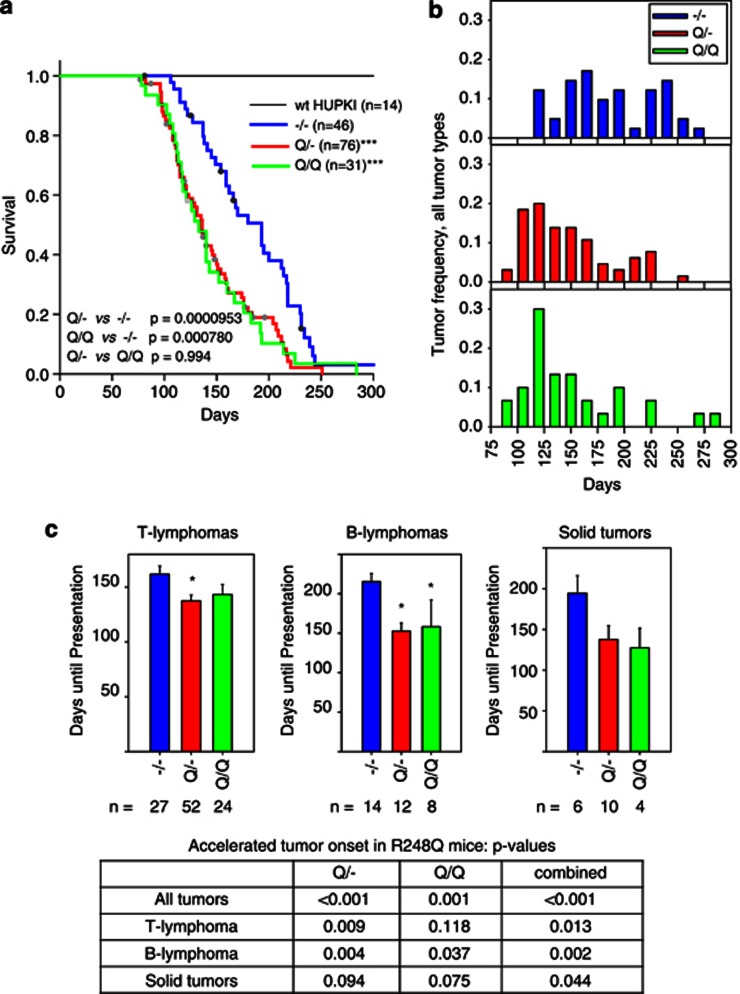
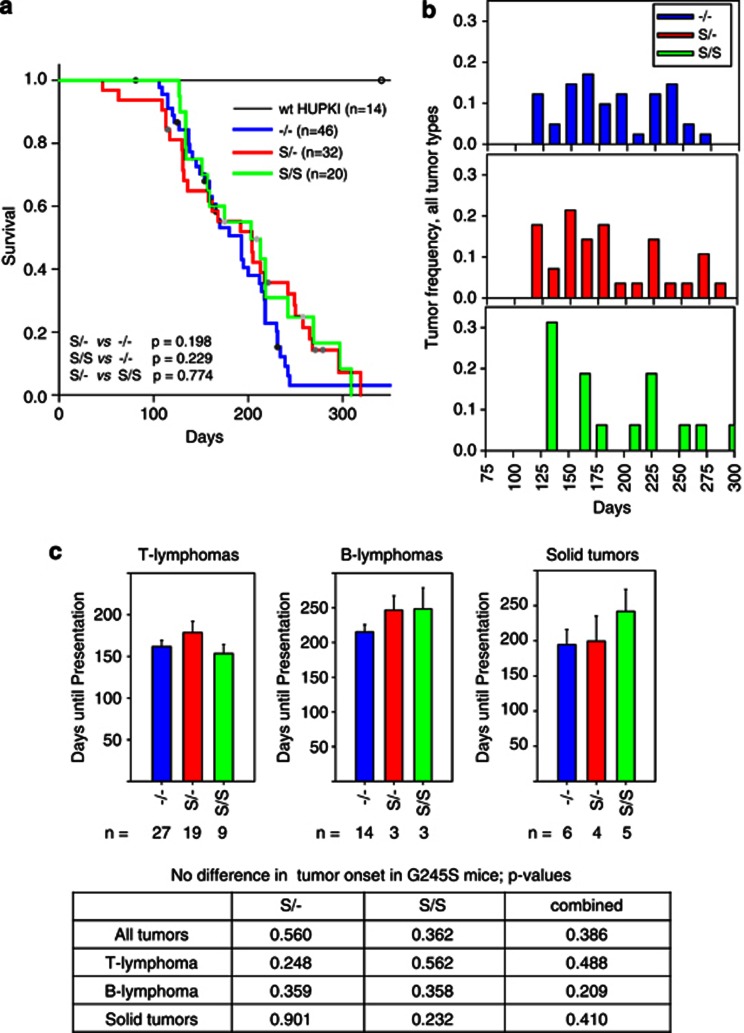
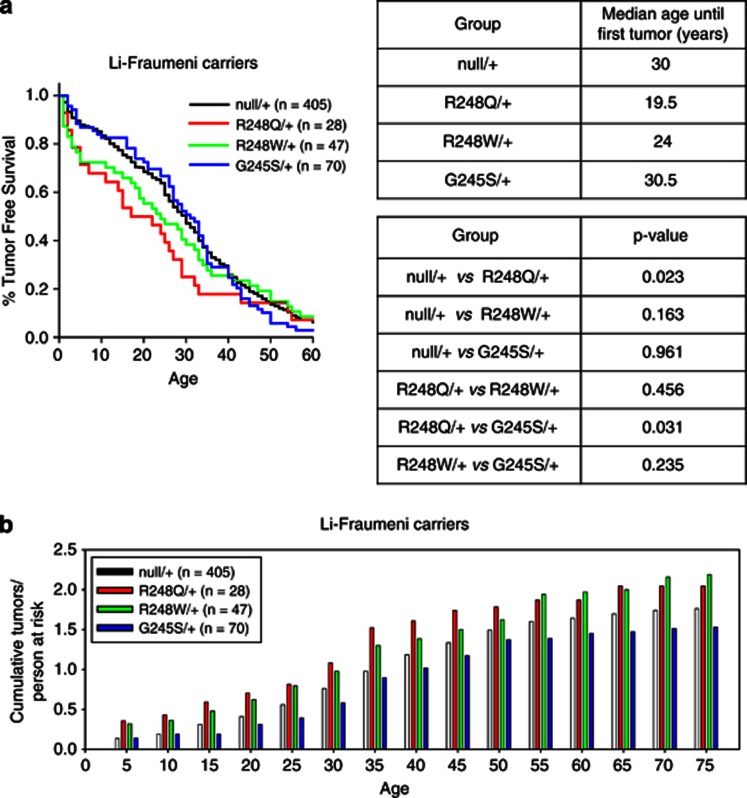
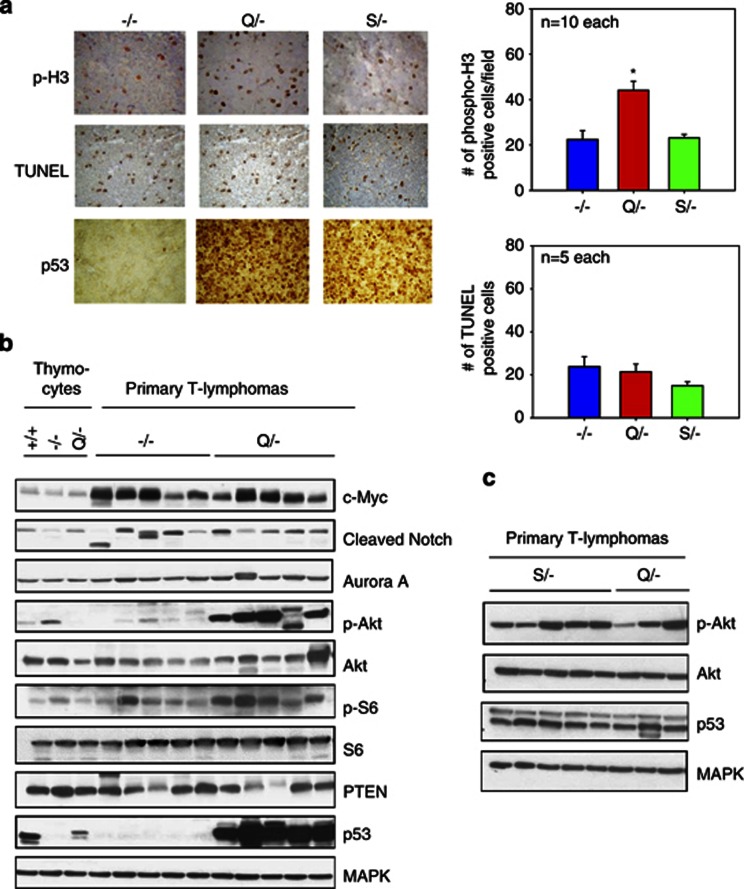
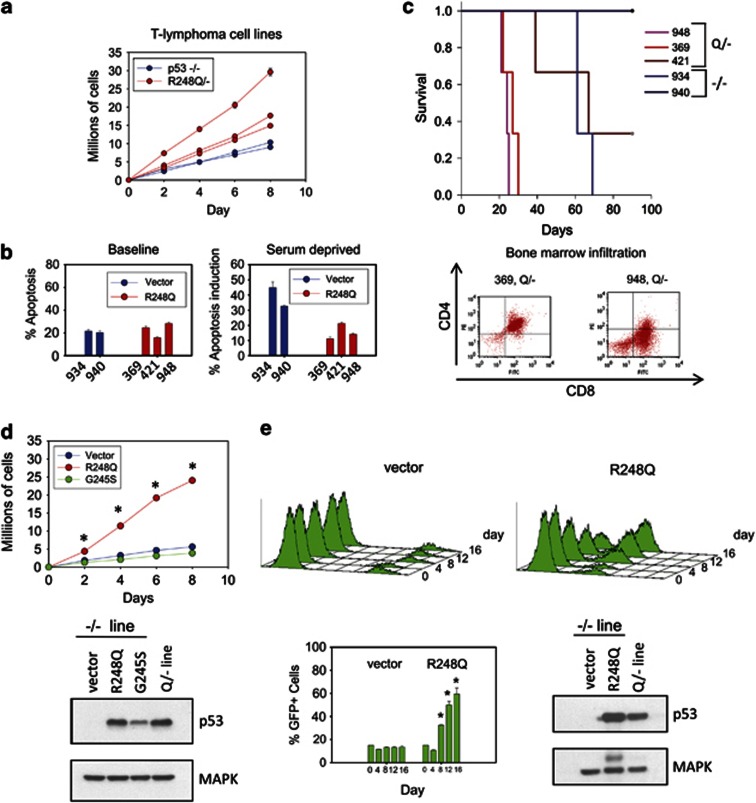
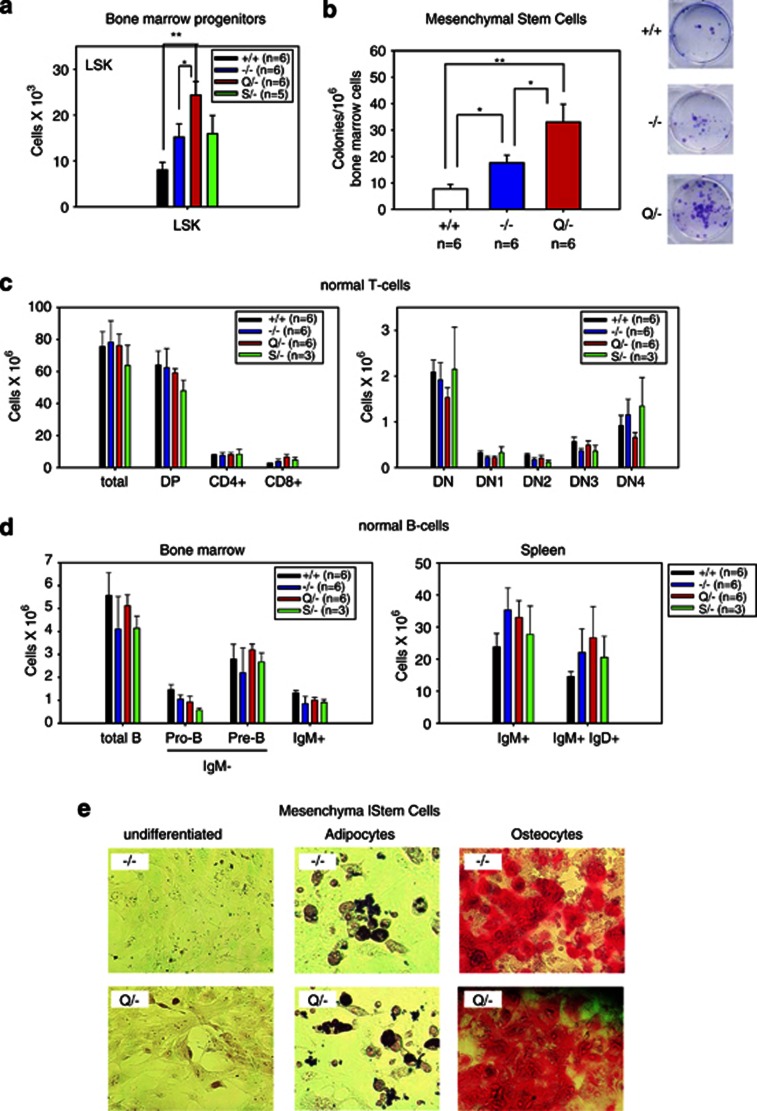
Mutant p53 proteins not only lose their tumor-suppressor function but some acquire oncogenic gain of function (GOF). The published mutp53 knock-in (KI) alleles (R172H, R270H, R248W) manifest GOF by broader tumor spectrum and more metastasis compared with the p53-null allele, but do not shorten survival. However, whether GOF also occurs with other mutations and whether they are all biologically equal is unknown. To answer this, we created novel humanized mutp53 KI mice harboring the hot spot alleles R248Q and G245S. Intriguingly, their impact was very different. Compared with p53-null mice, R248Q/- mice had accelerated onset of all tumor types and shorter survival, thus unprecedented strong GOF. In contrast, G245S/- mice were similar to null mice in tumor latency and survival. This was associated with a twofold higher T-lymphoma proliferation in R248Q/- mice compared with G245S/- and null mice. Moreover, R248Q/- hematopoietic and mesenchymal stem cells were expanded relative to G245S/- and null mice, the first indication that GOF also acts by perturbing pretumorous progenitor pools. Importantly, these models closely mirror Li-Fraumeni patients who show higher tumor numbers, accelerated onset and shorter tumor-free survival by 10.5 years when harboring codon R248Q mutations as compared with Li-Fraumeni patients with codon G245S mutations or p53 deletions/loss. Conversely, both KI alleles caused a modest broadening of tumor spectrum with enhanced Akt signaling compared with null mice. These models are the first in vivo proof for differential oncogenic strength among p53 GOF alleles, with genotype-phenotype correlations borne out in humans.


Figures

Figure 1
Figure 1
Construction of hot spot mutp53 R248Q and G245S HUPKI mouse models. (a) Diagram of the mutp53 HUPKI targeting vectors. Mouse genomic region spanning Ex4–9 was replaced with human genomic region Ex4–9 (HUPKI) containing either a p53 R248Q or G245S mutation (marked by *). This generates a chimeric p53 protein of mouse aa 1–32, human aa 33–332 and mouse aa 333–390. A deletable Neo selection box flanked by FRT sites (triangles) was inserted downstream of mouse Ex10. Yellow boxes represent mouse exons and pink boxes represent human exons. Restriction enzyme sites are indicated. H, HindIII; N, Not1; R, EcoRI; RV, EcoRV; X, Xho1. (b) Diagram of the knocked-in germline configuration of the two mutp53 HUPKI alleles. Primers F7/SQ7, F7/SQ5 and F7/SQ3 were used to amplify the mutated regions for sequence confirmation. The neomycin resistance cassette was deleted by transfecting recombinant ES lines with flp recombinase; deletion was confirmed by PCR. Southern blot probes are indicated. (c) Southern blot confirmation of neo-deleted recombinant ES clones. XbaI digestion was used for 5′ and 3′ probes. The expected band sizes for the 3′ probe are WT ∼12.9 kb; KI 9.6 kb. For the 5′ probe, expected band sizes are WT 9.6 kb; KI 13.5 kb. The untargeted ES line was a 129:B6 hybrid (HYB). The 129 and B6 ES lines are shown for comparison
Figure 2
Figure 2
p53 R248Q and G245S proteins have lost wtp53 transcriptional activity. (a) Early-passage MEFs of the indicated genotypes were treated with 250 nM Doxorubicin for 24 h. Cells were harvested and protein and RNA prepared. (a, left) Lysates were blotted for p53, p21 and MAPK (loading control). An antibody directed against a peptide sequence surrounding mouse p53 Serine 20 (clone 1C12), present as mouse sequence in both the wild-type (+/+) and HUPKI configurations, is used to compare p53 levels. There is a slight reduction in mobility of HUPKI proteins compared with mouse wtp53 because of the higher molecular weight of the HUPKI proteins. (a, right) p21 mRNA levels determined by qRT-PCR. Results are representative of three independent MEF preparations per genotype. (b) Early-passage MEFs of the indicated genotypes were passaged every 3 days at a density of 4 × 10⁵ per 10 cm dish. The total number of cell generations over 27 days was determined. Results are representative of two independent MEF preparations per genotype. (c) Thymocytes of the indicated genotypes were freshly isolated from 4-week-old mice and γ-irradiated (5 Gy). (c, left) Cell viability was determined by Annexin V/PI staining at 0, 4, 6 and 24 h. Percent viable cells in treated samples were normalized to untreated samples; n=3 mice per genotype. (c, right) qRT-PCR of p21 and Puma mRNA from thymocytes 6 h after irradiation. (c, bottom) Immunoblot analysis for p53, p21, PUMA, cleaved caspase 3 and MAPK (loading control) from irradiated thymocytes at the indicated time points
Figure 3
Figure 3
The p53 R248Q allele results in accelerated tumor onset and shorter survival compared with the p53-null allele. (a) Survival curves for mice of the indicated genotypes. The number of total mice in each group is indicated. Dots represent mice that were censored because of death from nontumor-related causes. ***P<0.0001 compared with null mice, log-rank analysis. (b) Tumor onset for all tumor types combined in the indicated genotypes. Tumor frequency was calculated by dividing the number of tumors occurring during 15-day time intervals by the total number of tumors occurring for each genotype. Number of mice is the same as in (a). (c) Mean days until first appearance of the indicated tumor types. Error bars indicate S.E. *P<0.05 compared with null mice. The bottom table summarizing P-values compared with null mice for Q/−, Q/Q and both genotypes combined. The solid tumor data are not significant, likely because of the small number of tumors of individual genotypes. However, when both R248Q/− and R248Q/R248Q genotypes are combined, they reach statistical significance, as shown in the table (P=0.044)
Figure 4
Figure 4
The p53 G245S allele has similar tumor onset and survival compared with the p53-null allele. (a) Survival curves for mice of the indicated genotypes. The number of total mice in each group is indicated. Dots represent mice that were censored because of deaths from nontumor-related causes. Log-rank analysis, P-values are indicated. (b) Tumor onset for all tumor types combined in the indicated genotypes. Tumor frequency was calculated by dividing the number of tumors occurring during 15-day time intervals by the total number of tumors occurring for each genotype. Number of mice is the same as in (a). (c) Mean days until first appearance of the indicated tumor types. Error bars indicate S.E. Bottom table summarizing P-values compared with null mice for S/−, S/S and both genotypes combined
Figure 5
Figure 5
Persons at risk harboring germline mutations in codon 248 exhibit faster tumor onset than persons at risk with codon G245 or p53-null mutations. (a, left) Kaplan–Meier survival analysis of tumor-free survival of Li–Fraumeni carriers of the indicated genotypes showing the percent of patients remaining tumor free as a function of age in years. The number of patients is indicated. Analysis of data from the latest p53 IARC database (version R15). (a, right top) Median age at first tumor appearance among the four genotypes. (a, right bottom) P-values (ranked sum test) comparing the median age at first tumor appearance between the various different genotypes. (b) Total number of tumors per person at risk as a function of age in years
Figure 6
Figure 6
R248Q/− lymphomas show increased in vivo proliferation compared with G245S/− and null lymphomas. Both mutant lymphomas show increased oncogenic signaling via the Akt pathway. (a, left) Immunohistochemical stainings for phospho-H3, TUNEL and p53 were performed on T lymphomas of null, R248Q/− and G245S/− tumors. (a, right) Quantitation of images shown on the left. Positive nuclei were counted in 10 random high-power fields ( × 40) per lymphoma. The mean of these averages for 10 (phospho-H3) and 5 (TUNEL) lymphomas per genotype are shown. Error bars indicate ±S.E. *P<0.05. (b) Primary normal thymocytes from 4-week-old p53+/+, p53−/− and p53 Q/− mice were compared with lysates from primary T lymphomas of the indicated genotypes. Immunoblot analysis for various signaling pathways. MAPK loading control. (c) Primary T-lymphoma lysates from G245S/− mice were compared with the first three T-lymphoma lysates from R248Q/− mice shown in (b). MAPK loading control
Figure 7
Figure 7
Cell lines derived from R248Q/− lymphomas confirm GOF activities in vitro and in vivo. (a) Cell lines derived from R248Q/− and p53-null T lymphomas were serially passaged every 2 days at a density of 5 × 10⁵ cells per ml. The cumulative number of cells were graphed. The mean±S.E. of three repeats per cell line is shown. (b) Baseline apoptosis under normal growth conditions and the apoptotic response after 24 h of serum starvation in cell lines from (a). Cell line identities are indicated. Bars represent mean±S.E. for three replicate experiments per line. (c, top) Allograft transplantations of cell lines from (a). Cells (1 × 10⁵) were injected into the tail vein of nude mice; mice were killed when moribund. Each curve represents three injections per cell line. (c, bottom) Bone marrow of nude mice was harvested at the time of death and analyzed for the presence of infiltrating leukemic cells identified by CD4+CD8+. (d, left) HUPKI mutp53 R248Q or G245S or empty vector was retrovirally introduced into a p53-null T-lymphoma line (934). Cells were plated in triplicate at a density of 5 × 10⁵ cells. The total cell number was quantified every second day. The average±S.E. of three independent experiments is shown. *P<0.05. (d, bottom) Immunoblot confirming comparable levels of ectopic mutp53 compared with the endogenous mutant p53 present in a Q/− lymphoma line (948). (e) p53-null T-lymphoma cells expressing HUPKI mutp53 R248Q protein outcompete vector control cells in co-culture. (e, top) p53-null lymphoma line (934) expressing retroviral vector-IRES-GFP or R248Q-IRES-GFP were added to the original uninfected p53-null line in a ratio of 15 GFP+/85% GFP− cells. Aliquots from three independent cultures were analyzed for GFP+ cells by FACS over 16 days. (e, bottom) The average percent of GFP+ cells is shown for each time point from three independent cultures. Error bars represent ±S.E. Immunoblot as in (d)
Figure 8
Figure 8
The R248Q allele causes expansion of bone marrow-derived hematopoietic progenitors and mesenchymal stem cell progenitors. (a) Total number of hematopoietic LSK (Lin−Sca1+c-Kit+) progenitors in the bone marrow from both femurs per mouse of 4–5-week-old mice of the indicated genotypes. *P<0.05, **P<0.01 (t-test). For (ad) averages +/− S.E. are shown for each cell population. (b) Total number of mesenchymal stem cell (MSC) colonies from bone marrow of 6–7-week-old mice of the indicated genotypes. Wild-type, n=6; null, n=6; R248Q/−, n=6. *P<0.05, **P<0.01 (t-test). (b, right) Examples of Giemsa-stained colonies in 96-well plates. (c and d) R248Q and S245G mutant bone marrow progenitors undergo normal differentiation. Subpopulations were determined by FACS analysis using the indicated markers. None of the comparisons reach statistical significance (t-test). (c) Total number of the indicated T-cell (sub)populations per thymus of 4–5-week-old mice of the indicated genotypes. There was a trend toward a decrease in the DN4 subset of R248Q thymocyte differentiation compared with the corresponding null and G245S subsets. (d) Total number of the indicated B-cell (sub)populations from bone marrow of both femurs per mouse and from spleen of 4–5-week-old mice of the indicated genotypes. (e) MSCs isolated from bone marrow of −/− and Q/− mice show similar differentiation into adipocytes and osteocytes. MSCs were placed in basal media (left), adipocyte differentiation media and osteocyte differentiation media. Adipocytes and osteocytes were stained with histochemical differentiation markers Oil Red O and Alizarin Red S, respectively

Comment in

References

    1. Hollstein M, Sidransky D, Vogelstein B, Harris CC. p53 mutations in human cancers. Science. 1991;253:49–53. - PubMed
    1. Vaseva AV, Moll UM. The mitochondrial p53 pathway. Biochim Biophys Acta. 2009;1787:414–420. - PMC - PubMed
    1. Oren M, Rotter V. Mutant p53 gain-of-function in cancer. Cold Spring Harb Perspect Biol. 2010;2:a001107. - PMC - PubMed
    1. Sigal A, Rotter V. Oncogenic mutations of the p53 tumor suppressor: the demons of the guardian of the genome. Cancer Res. 2000;60:6788–6793. - PubMed
    1. Freed-Pastor WA, Prives C. Mutant p53: one name, many proteins. Genes Dev. 2012;26:1268–1286. - PMC - PubMed

Publication types

MeSH terms

Substances