

Nonlinear frequency compression: effects on sound quality ratings of speech and music
- PMID: 23539261
- PMCID: PMC4040861
- DOI: 10.1177/1084713813480856
Nonlinear frequency compression: effects on sound quality ratings of speech and music
Abstract
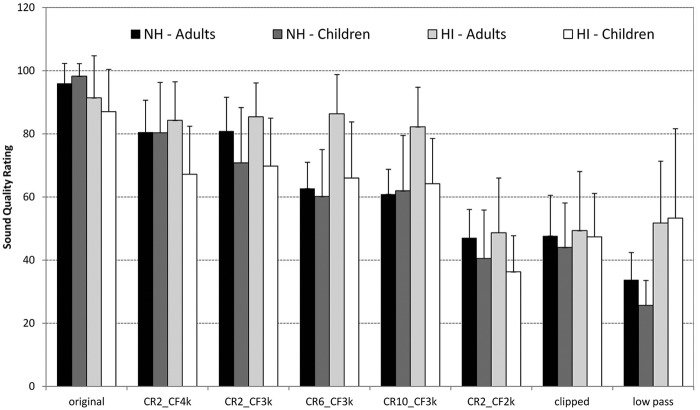
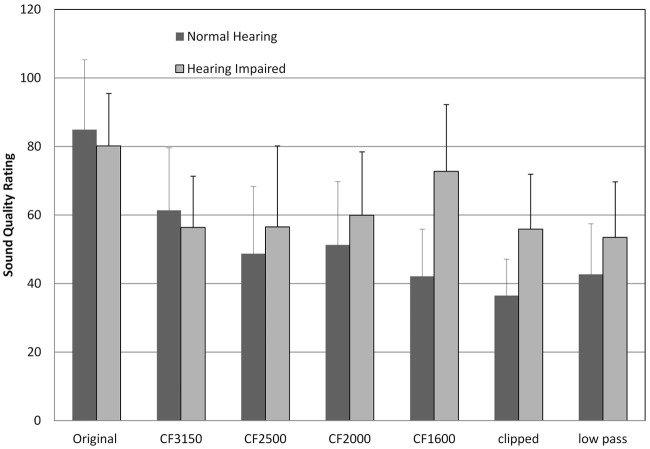
Frequency lowering technologies offer an alternative amplification solution for severe to profound high frequency hearing losses. While frequency lowering technologies may improve audibility of high frequency sounds, the very nature of this processing can affect the perceived sound quality. This article reports the results from two studies that investigated the impact of a nonlinear frequency compression (NFC) algorithm on perceived sound quality. In the first study, the cutoff frequency and compression ratio parameters of the NFC algorithm were varied, and their effect on the speech quality was measured subjectively with 12 normal hearing adults, 12 normal hearing children, 13 hearing impaired adults, and 9 hearing impaired children. In the second study, 12 normal hearing and 8 hearing impaired adult listeners rated the quality of speech in quiet, speech in noise, and music after processing with a different set of NFC parameters. Results showed that the cutoff frequency parameter had more impact on sound quality ratings than the compression ratio, and that the hearing impaired adults were more tolerant to increased frequency compression than normal hearing adults. No statistically significant differences were found in the sound quality ratings of speech-in-noise and music stimuli processed through various NFC settings by hearing impaired listeners. These findings suggest that there may be an acceptable range of NFC settings for hearing impaired individuals where sound quality is not adversely affected. These results may assist an Audiologist in clinical NFC hearing aid fittings for achieving a balance between high frequency audibility and sound quality.
Conflict of interest statement
Figures


References
-
- Arlinger S., Gatehouse S., Bentler R. A., Byrne D., Cox R. M., Dirks D. D., Willott J. F. (1996). Report of the Eriksholm Workshop on auditory deprivation and acclimatization. Ear and Hearing, 17(3S), 87S-90S - PubMed
-
- Bohnert A., Nyffeler M., Keilmann A. (2010). Advantages of a non-linear frequency compression algorithm in noise. European Archives of Oto-Rhino-Laryngology, 267, 1045-1053 - PubMed
-
- Cox R. M., Alexander G. C., Taylor I. M., Gray G. A. (1996). Benefit acclimatization in elderly hearing aid users. Journal of the American Academy of Audiology, 7, 428-441 - PubMed
-
- Gatehouse S. (1992). The time course and magnitude of perceptual acclimatization to frequency responses: Evidence from monaural fitting of hearing aids. Journal of the Acoustical Society of America, 92, 1258-1269 - PubMed
Publication types
MeSH terms
LinkOut - more resources
Full Text Sources
Other Literature Sources
Medical