. 2013 May;3(5):512-9.
doi: 10.1158/2159-8290.CD-12-0426.

Histone H3.3. mutations drive pediatric glioblastoma through upregulation of MYCN

Affiliations

Histone H3.3. mutations drive pediatric glioblastoma through upregulation of MYCN

Lynn Bjerke et al. Cancer Discov. 2013 May.

Abstract

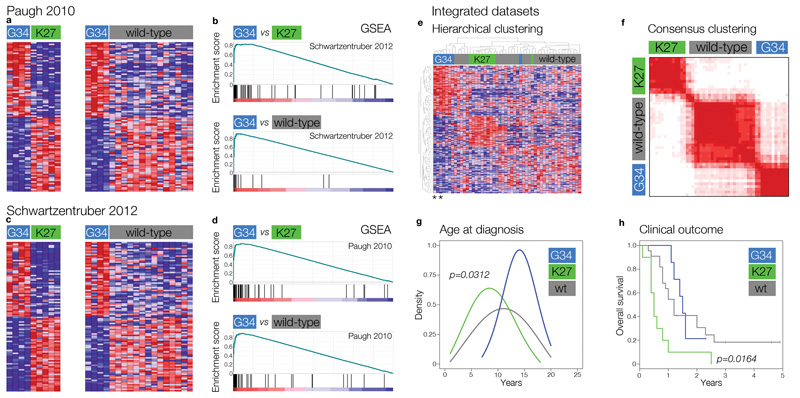
Children and young adults with glioblastoma (GBM) have a median survival rate of only 12 to 15 months, and these GBMs are clinically and biologically distinct from histologically similar cancers in older adults. They are defined by highly specific mutations in the gene encoding the histone H3.3 variant H3F3A , occurring either at or close to key residues marked by methylation for regulation of transcription—K27 and G34. Here, we show that the cerebral hemisphere-specific G34 mutation drives a distinct expression signature through differential genomic binding of the K36 trimethylation mark (H3K36me3). The transcriptional program induced recapitulates that of the developing forebrain, and involves numerous markers of stem-cell maintenance, cell-fate decisions, and self-renewal.Critically, H3F3A G34 mutations cause profound upregulation of MYCN , a potent oncogene that is causative of GBMs when expressed in the correct developmental context. This driving aberration is selectively targetable in this patient population through inhibiting kinases responsible for stabilization of the protein.

Significance: We provide the mechanistic explanation for how the fi rst histone gene mutation inhuman disease biology acts to deliver MYCN, a potent tumorigenic initiator, into a stem-cell compartment of the developing forebrain, selectively giving rise to incurable cerebral hemispheric GBM. Using synthetic lethal approaches to these mutant tumor cells provides a rational way to develop novel and highly selective treatment strategies


Figures

Figure 1
Figure 1. Distinct molecular and clinical correlates of H3F3A mutation subgroups
(a) Heatmap representing differential gene expression signatures between G34 versus K27, and G34 versus wild-type, paediatric GBM specimens from Paugh 2010. Top 100 differentially expressed genes are shown for each comparison. (b) Gene set enrichment analysis (GSEA) for differential gene expression signatures identified in Schwartzentruber 2012 versus those in Paugh 2010. Top – G34 versus K27: enrichment score (ES)=0.833, p (family-wise error rate (FWER))=0.0, q (false discovery rate (FDR))=0.0; Bottom – G34 versus wild-type: ES=0.94, FWER p=0.0, FDR q=0.0. (c) Heatmap representing differential gene expression signatures between G34 versus K27, and G34 versus wild-type, paediatric GBM specimens from Schwartzentruber 2012. Top 100 differentially expressed genes are shown for each comparison. (d) GSEA for differential gene expression signatures identified in Paugh 2010 versus those in Schwartzentruber 2012. Top – G34 versus K27: ES=0.88, FWER p=0.03, FDR q=0.04.; Bottom – G34 versus wild-type: ES=0.90, FWER p=0.0, FDR q=0.0. (e) Hierarchical clustering of the integrated gene expression datasets, highlighting specific clusters of G34 and K27 mutant tumours, distinct from a more heterogeneous group of wild-type cases. G34V tumours are represented by asterisks. (f) K-means consensus clustering finds the most stable number of subgroups to be three, marked by H3F3A mutation status. (g) K27 and G34 mutant paediatric GBM in our integrated dataset have distinct age incidence profiles, with K27 tumours peaking at 7 years in contrast to G34 at age 14. The two G34V tumours were diagnosed at age 14 and 20. (h) Kaplan-Meier plot for overall survival of paediatric GBM patients stratified by H3F3A status. K27 mutant tumours have significantly shorter survival than G34 (p=0.0164, log-rank test). A single G34V case for which data was available had an overall survival of 1.4 years.
Figure 2
Figure 2. Differential binding of H3K36me3 in G34 mutant KNS42 cells drives paediatric GBM expression signatures
(a) Sanger sequencing trace for KNS42 paediatric GBM cells reveals a heterozygous c.104G>T p.(Gly34Val) H3F3A mutation. (b) Western blot for mono-(me1), di-(me2) and tri-(me3) methylated histone H3 in G34 mutant KNS42 and wild-type paediatric glioma cell lines. Total H3 is used as an extracted histone loading control. (c) Circos plot representing the KNS42 genome, aligned with chromosomes 1 to X running clockwise from 12 o’clock. Outer ring - H3K36me3 ChIP-Seq binding. Grey: all binding; blue: differential binding in KNS42 versus SF188. Selected differentially bound developmental transcription factors and pluripotency genes are labelled. Inner ring – DNA copy number. Green points: copy number gain; black points: normal copy number; red points: copy number loss. Single base mutations in selected genes (H3F3A:G34V and TP53:R342*) are labelled inside the circle. (d) Correlation plot of RNA polymerase II versus H3K36me3 for 65 differentially trimethyl-bound regions by ChIP-Seq in KNS42 cells. R2=0.66, p<0.0001. (e) Heatmap representing a ranked list of differentially bound H3K36me3 and RNA polymerase II in G34V KNS42 versus wild-type SF188 cells, with top 20 genes listed. (f) GSEA for pre-ranked differentially bound genes identified in ChIP-Seq versus those in the integrated gene expression datasets. Top – G34 versus K27: ES=0.86, FWER p=0.03, FDR q=0.03.; Bottom – G34 versus wild-type: ES=0.84, FWER p=0.02, FDR q=0.04. (g) DAVID gene ontology analysis for pre-ranked list of differentially bound genes identified in ChIP-Seq. Fold enrichment of processes are plotted, and coloured by FDR q value. (h) Top: Mean expression of the G34 core enrichment signature in a temporal gene expression dataset of human brain development. Period 1, embryonal; periods 2-7, foetal; periods 8-12, post-natal; periods 13-15, adulthood. Bottom: Heatmap representing spatial differences in G34 core enrichment signature expression in structures within embryonic and early foetal development, with highest levels mapping to the ganglionic eminences and amygdala.
Figure 3
Figure 3. G34 induces a transcriptional program linked to forebrain development and self-renewal
DLX6: (a) ChIP-Seq of H3K36me3 and RNA polymerase II binding for G34 mutant KNS42 (blue) and wild-type SF188 cells (grey) for the DLX6 locus, which also encompasses the transcripts DLX5, DLX6-AS1 and DLX6-AS2. (b) Validation of ChIP-Seq data by ChIP-qPCR using specific primers targeting DLX6. Blue bars: KNS42, grey: SF188. *** p<0.0001, t-test. (c) Boxplot of DLX6 expression in the integrated paediatric GBM samples stratified by H3F3A status. Blue box: G34, green: K27, grey: wild-type. *** p<0.001, ANOVA. (d) Top – immunohistochemistry for DLX6 protein in a G34 mutant paediatric GBM sample RMH2465. Bottom – Barplot of DLX6 expression in a paediatric GBM tissue microarray stratified by H3F3A status. Blue bars: G34, green: K27, grey: wild-type. ++ strong expression, + moderate expression, - negative. SOX2: (e) ChIP-Seq of H3K36me3 and RNA polymerase II binding for G34 mutant KNS42 (blue) and wild-type SF188 cells (grey) for the SOX2 locus, which also encompasses the SOX2-OT transcript. (f) Validation of ChIP-Seq data by ChIP-qPCR using specific primers targeting SOX2. Blue bars: KNS42, grey: SF188. *** p<0.0001, t-test. (g) Boxplot of SOX2 expression in the integrated paediatric GBM samples stratified by H3F3A status. Blue box: G34, green: K27, grey: wild-type. * p<0.05, ANOVA. (h) Top – immunohistochemistry for SOX2 protein in a G34 mutant paediatric GBM sample RMH2465. Bottom – Barplot of SOX2 expression in a paediatric GBM tissue microarray stratified by H3F3A status. Blue bars: G34, green: K27, grey: wild-type. ++ strong expression, + moderate expression, - negative.
Figure 4
Figure 4. G34 H3K36me3 upregulates MYCN which is selectively targetable by kinases that destabilise the protein
MYCN: (a) ChIP-Seq of H3K36me3 and RNA polymerase II binding for G34 mutant KNS42 (blue) and wild-type SF188 cells (grey) for the MYCN locus, which also encompasses the MYCNOS transcript. (b) Validation of ChIP-Seq data by ChIP-qPCR using specific primers targeting MYCN. Blue bars: KNS42, grey: SF188. *** p<0.0001, t-test. (c) Boxplot of MYCN expression in the integrated paediatric GBM samples stratified by H3F3A status. Blue box: G34, green: K27, grey: wild-type. ** p<0.01, ANOVA. Wild-type tumours with high mRNA expression were frequently amplified (“Amp”). (d) Top – immunohistochemistry for MYCN protein in a G34 mutant paediatric GBM sample. RMH2465 Bottom – Barplot of MYCN expression in a paediatric GBM tissue microarray stratified by H3F3A status. Blue bars: G34, green: K27, grey: wild-type. ++ strong expression, + moderate expression, - negative. (e) Effects on cell viability of MYCN-knockdown in KNS42 cells. Western blot demonstrating efficiency of reduction of MYCN by three individual siRNAs targeting MYCN (named 6, 12 and W) and a pool of all three after 48 and 96 hours. Barplot demonstrating effects on KNS42 cell viability after siRNA knockdown at 7 days. *** p<0.001, t-test vs control. (f) siRNA screen for 714 human kinases in KNS42 cells. Western blot demonstrating expression of MYCN protein in G34 mutant KNS42 cells in contrast to a panel of wild-type paediatric glioma lines. GAPDH is used as a loading control. Kinase targets are plotted in plate well order along the x axis, and Z scores along the y axis. PLK1 is used as a positive control and is plotted in red. Negative controls are coloured light grey, and kinases with Z scores greater than -2.0 (no effect on cell viability) are coloured grey. ‘Hits’ (Z score less than -2.0) are coloured dark grey or blue, the latter if the effect on cell viability is specific to KNS42 cells and not in a panel of four H3F3A wild type paediatric glioma cell lines. The most significant, and selective hits were for CHK1 and AURKA. (g) Effect of knockdown of AURKA on MYCN levels in KNS42 cells. Western blot for AURKA and MYCN in KNS42 cells treated with individual oligonucleotides directed against AURKA for 48 and 96 hours. GAPDH is used as a loading control. (h) Effect of a selective small molecule inhibitor of AURKA on MYCN protein levels and cell viability. Left: Western blot for MYCN protein in KNS42 cells after exposure to 0.1, 0.5 and 2-5μM VX-689 (triangle). GAPDH is used as a loading control. Right: Barplot showing effects on cell viability of KNS42 cells exposed to 0.1, 0.5 and 2-5μM VX-689. ** p<0.01, t-test vs control.

References

    1. Jones C, Perryman L, Hargrave D. Paediatric and adult malignant glioma: close relatives or distant cousins? Nature reviews. Clinical oncology. 2012;9:400–413. - PubMed
    1. Schwartzentruber J, Korshunov A, Liu XY, Jones DT, Pfaff E, Jacob K, et al. Driver mutations in histone H3.3 and chromatin remodelling genes in paediatric glioblastoma. Nature. 2012;482:226–231. - PubMed
    1. Paugh BS, Qu C, Jones C, Liu Z, Adamowicz-Brice M, Zhang J, et al. Integrated molecular genetic profiling of pediatric high-grade gliomas reveals key differences with the adult disease. Journal of clinical oncology : official journal of the American Society of Clinical Oncology. 2010;28:3061–3068. - PMC - PubMed
    1. Bax DA, Mackay A, Little SE, Carvalho D, Viana-Pereira M, Tamber N, et al. Molecular and phenotypic characterisation of paediatric glioma cell lines as models for preclinical drug development. PloS one. 2009;4:e5209. - PMC - PubMed
    1. Wagner EJ, Carpenter PB. Understanding the language of Lys36 methylation at histone H3. Nature reviews. Molecular cell biology. 2012;13:115–126. - PMC - PubMed

Publication types

MeSH terms