. 2013 Jun 1;29(11):1399-406.
doi: 10.1093/bioinformatics/btt144. Epub 2013 Mar 28.

Improved ancestry inference using weights from external reference panels

Affiliations

Improved ancestry inference using weights from external reference panels

Chia-Yen Chen et al. Bioinformatics. .

Abstract

Motivation: Inference of ancestry using genetic data is motivated by applications in genetic association studies, population genetics and personal genomics. Here, we provide methods and software for improved ancestry inference using genome-wide single nucleotide polymorphism (SNP) weights from external reference panels. This approach makes it possible to leverage the rich ancestry information that is available from large external reference panels, without the administrative and computational complexities of re-analyzing the raw genotype data from the reference panel in subsequent studies.

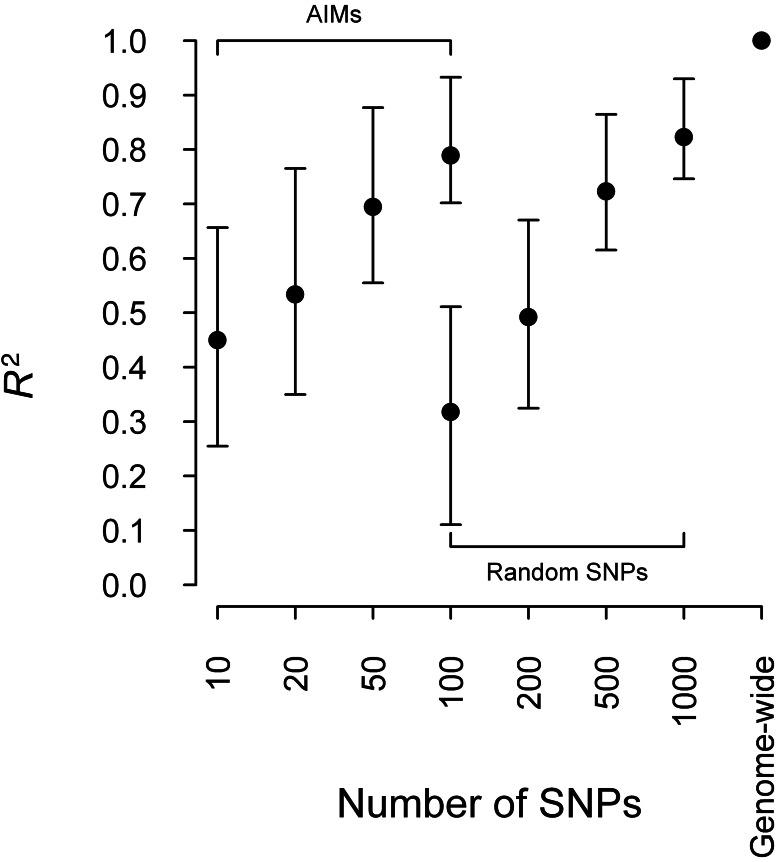
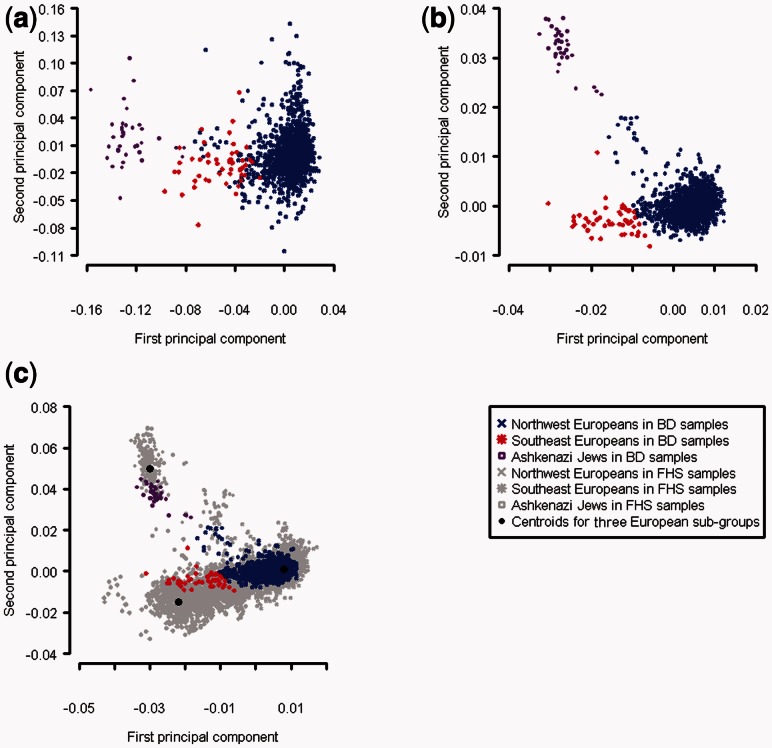
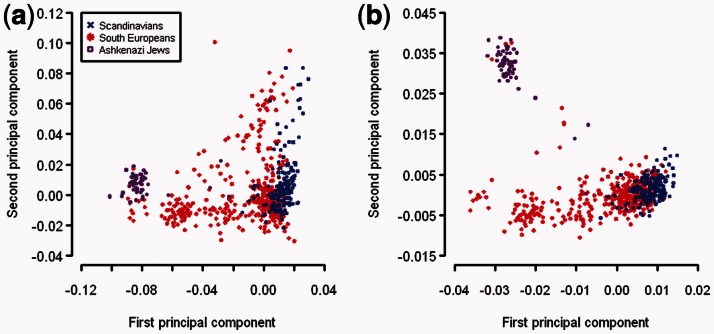
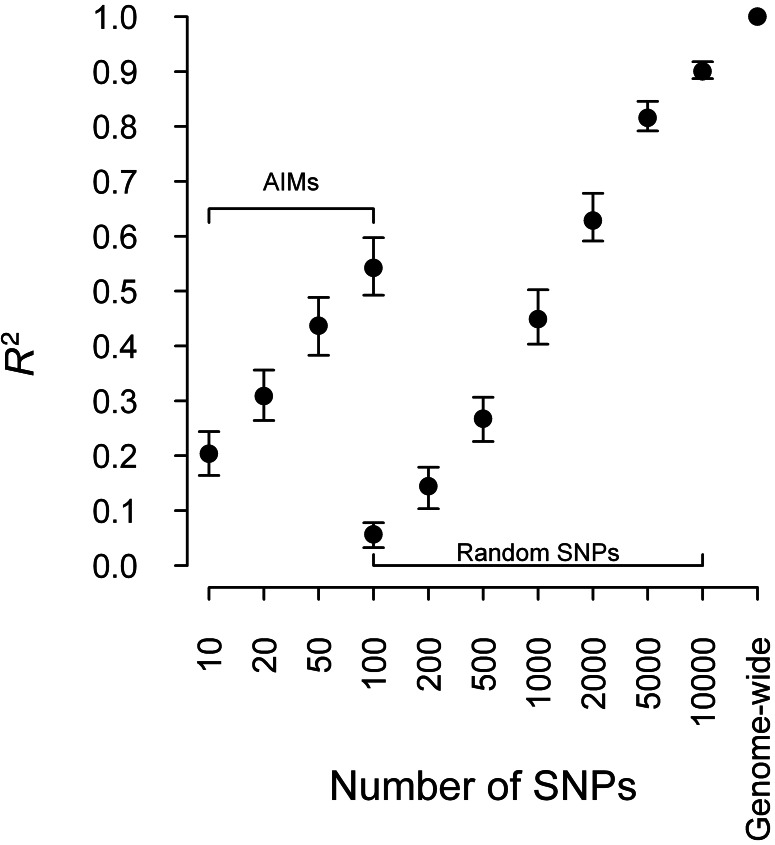
Results: We extensively validate our approach in multiple African American, Latino American and European American datasets, making use of genome-wide SNP weights derived from large reference panels, including HapMap 3 populations and 6546 European Americans from the Framingham Heart Study. We show empirically that our approach provides much greater accuracy than either the prevailing ancestry-informative marker (AIM) approach or the analysis of genome-wide target genotypes without a reference panel. For example, in an independent set of 1636 European American genome-wide association study samples, we attained prediction accuracy (R(2)) of 1.000 and 0.994 for the first two principal components using our method, compared with 0.418 and 0.407 using 150 published AIMs or 0.955 and 0.003 by applying principal component analysis directly to the target samples. We finally show that the higher accuracy in inferring ancestry using our method leads to more effective correction for population stratification in association studies.

Availability: The SNPweights software is available online at http://www.hsph.harvard.edu/faculty/alkes-price/software/.

Supplementary information: Supplementary data are available at Bioinformatics online.


Figures

Fig. 1.
Fig. 1.
Comparison between R2 for ancestry inference using AIMs, random SNPs and genome-wide SNPs. Models were built with 112 CEU samples and 113 YRI samples and tested with 49 ASW samples. R2 was calculated with the predicted first PC and the gold standard, which is the first PC obtained by applying PCA to combined samples of CEU, YRI and ASW with 813 976 SNPs. The vertical bars represent 95% CIs
Fig. 2.
Fig. 2.
Comparison between (a) the first and second PCs by performing PCA on BD data alone, (b) predicted first and second PCs of BD data by using model built with SHARe data and (c) the first and second PCs obtained by performing PCA on combined BD and SHARe data. The BD samples are color coded into three groups based on distance to centroids in panel (c) (see Section 2)
Fig. 3.
Fig. 3.
Comparison between (a) the first and second PCs by performing PCA on BCa samples directly and (b) the predicted first and second PCs of BCa samples by using ancestry inference model built with SHARe data. These European American samples are color coded according to their self-reported ancestry
Fig. 4.
Fig. 4.
Comparison between R2 for ancestry inference using AIMs, random SNPs and genome-wide SNPs. Models were built with 6546 FHS SHARe samples and tested with 1636 BD samples. R2 was calculated with the predicted first PC and the gold standard, which is the first PC obtained by applying PCA to combined samples of FHS SHARe samples and BD samples with 346 070 SNPs. The vertical bars represent 95% CIs

References

    1. Alonso-Perez E, et al. Association of systemic lupus erythematosus clinical features with European population genetic substructure. PLoS One. 2011;6:e29033. - PMC - PubMed
    1. Altshuler DM, et al. Integrating common and rare genetic variation in diverse human populations. Nature. 2010;467:52–58. - PMC - PubMed
    1. Devlin B, Roeder K. Genomic control for association studies. Biometrics. 1999;55:997–1004. - PubMed
    1. Enattah NS, et al. Identification of a variant associated with adult-type hypolactasia. Nat. Genet. 2002;30:233–237. - PubMed
    1. Galanter JM, et al. Development of a panel of genome-wide ancestry informative markers to study admixture throughout the Americas. PLoS Genet. 2012;8:e1002554. - PMC - PubMed

Publication types