. 2013 May 10;288(19):13917-28.
doi: 10.1074/jbc.M113.460014. Epub 2013 Mar 28.

Elongation factor Ts directly facilitates the formation and disassembly of the Escherichia coli elongation factor Tu·GTP·aminoacyl-tRNA ternary complex

Affiliations

Elongation factor Ts directly facilitates the formation and disassembly of the Escherichia coli elongation factor Tu·GTP·aminoacyl-tRNA ternary complex

Benjamin J Burnett et al. J Biol Chem. .

Abstract

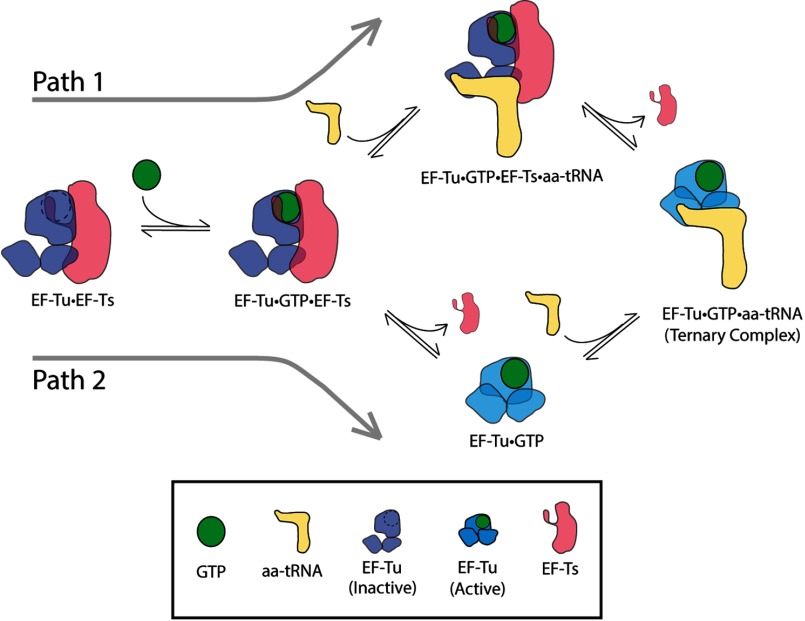
Background: Aminoacyl-tRNA (aa-tRNA) enters the ribosome in a ternary complex with the G-protein elongation factor Tu (EF-Tu) and GTP.

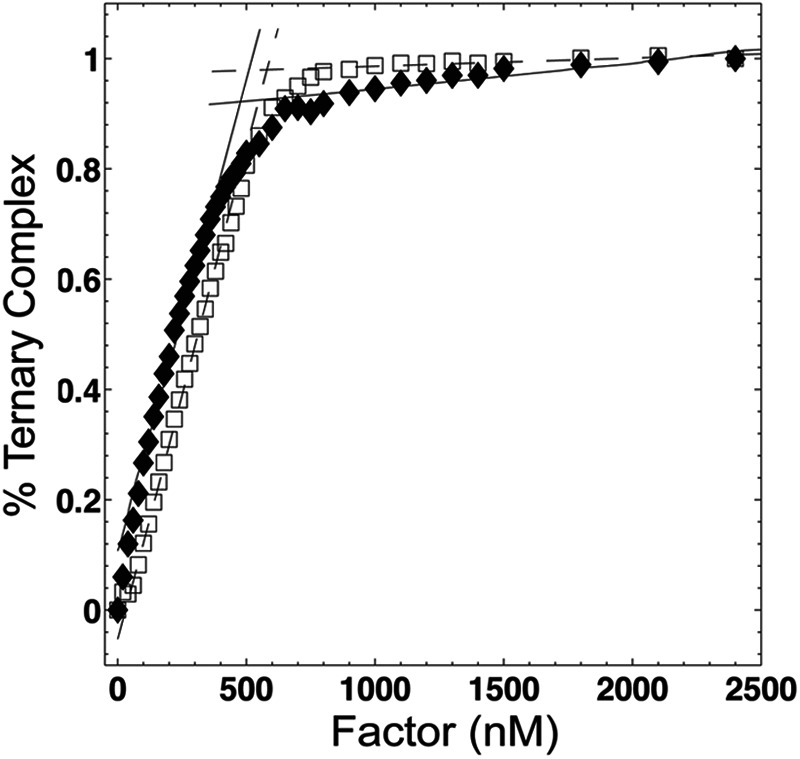
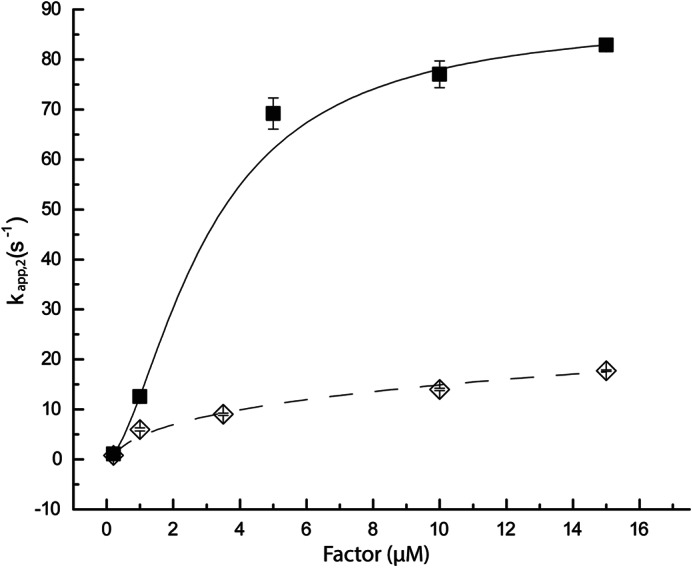
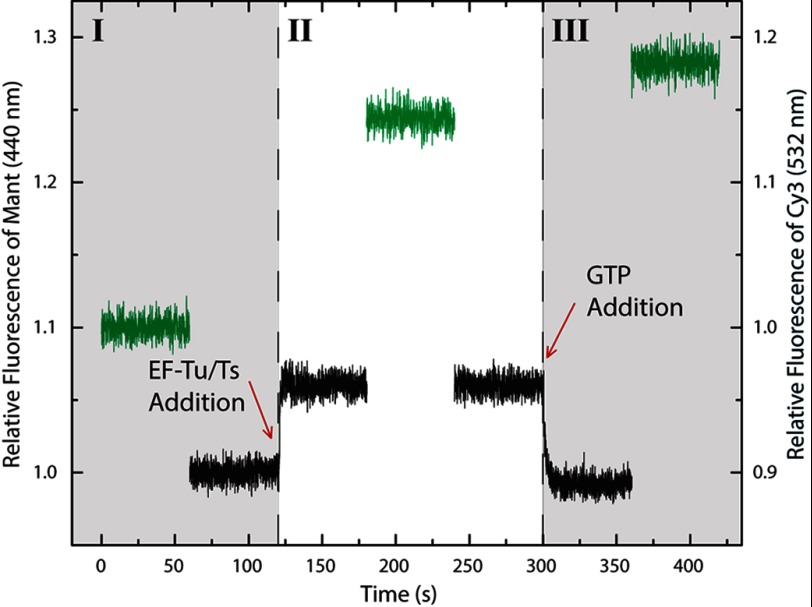
Results: EF-Tu·GTP·aa-tRNA ternary complex formation and decay rates are accelerated in the presence of the nucleotide exchange factor elongation factor Ts (EF-Ts).

Conclusion: EF-Ts directly facilitates the formation and disassociation of ternary complex.

Significance: This system demonstrates a novel function of EF-Ts. Aminoacyl-tRNA enters the translating ribosome in a ternary complex with elongation factor Tu (EF-Tu) and GTP. Here, we describe bulk steady state and pre-steady state fluorescence methods that enabled us to quantitatively explore the kinetic features of Escherichia coli ternary complex formation and decay. The data obtained suggest that both processes are controlled by a nucleotide-dependent, rate-determining conformational change in EF-Tu. Unexpectedly, we found that this conformational change is accelerated by elongation factor Ts (EF-Ts), the guanosine nucleotide exchange factor for EF-Tu. Notably, EF-Ts attenuates the affinity of EF-Tu for GTP and destabilizes ternary complex in the presence of non-hydrolyzable GTP analogs. These results suggest that EF-Ts serves an unanticipated role in the cell of actively regulating the abundance and stability of ternary complex in a manner that contributes to rapid and faithful protein synthesis.

Keywords: Elongation Factor Ts; Elongation Factor Tu; G-proteins; Guanine Nucleotide Exchange Factor (GEF); Protein Synthesis; Ternary Complex; Transfer RNA (tRNA); Translation Regulation.


Figures

FIGURE 1.
FIGURE 1.
Ternary complex structure and steady state measurements of ternary complex formation. A, structure of ternary complex stabilized by the antibiotic kirromycin (Protein Data Bank code 1OB2). E. coli EF-Tu (blue) bound to GDPNP (carbon atoms in gray, nitrogen in blue, oxygen in red, and phosphorous atoms in orange) is complexed with Saccharomyces cerevisiae Phe-tRNAPhe (wheat). Domains of EF-Tu are represented as D1, D2, and D3. For simplicity, kirromycin is not shown. B, specific functional elements are highlighted: switch 1 (S1) is in red, switch 2 (S2) is in orange, His-66 is in green, and the Phe amino acid is in purple. C, the affinity of EF-Tu for aminoacyl-tRNA was determined by titrating EF-Tu (open diamonds) or EF-Tu·EF-Ts (closed squares) into a solution of Cy3-labeled Phe-tRNAPhe and 10 μm GTP. An identical titration of EF-Tu was performed either with deacylated tRNAPhe (circles) or in the absence of GTP (blue squares). D, the apparent nucleotide affinity was measured by titrating GTP into a cuvette containing Phe-tRNAPhe (Cy3-acp3U47) and EF-Tu (open diamonds) or EF-Tu·EF-Ts (closed diamonds). Identical titration experiments of GDPNP with EF-Tu (open triangles) and EF-Tu·EF-Ts (closed triangles) and GTPγS with EF-Tu (open squares) or EF-Tu·EF-Ts (closed squares) are shown. Error bars represent the S.E. of three separate experiments. Estimates of the apparent KD were obtained by fitting the titration data as described under “Experimental Procedures.” Data points were splined for clarity.
FIGURE 2.
FIGURE 2.
EF-Tu is highly active in both the absence and presence of EF-Ts. The fraction of active EF-Tu molecules present in our protein preparation was determined by titrating EF-Tu (open squares) or EF-Tu·EF-Ts (closed diamonds) into a solution of 400 nm Phe-tRNAPhe (Cy3-acp3U47) in the presence of 10 μm GTP. Linear fits of the initial and final 10 data points of these two experiments intercept at 517 and 496 nm for EF-Tu and EF-Tu·EF-Ts, respectively, indicating that EF-Tu is ∼80% active in the absence and presence of EF-Ts.
FIGURE 3.
FIGURE 3.
Pre-steady state measurements of ternary complex formation and dissociation: dependence on factor concentration. A, the time-dependent response in fluorescence intensity observed upon addition of saturating amounts (400 nm) of either EF-Tu (blue) or EF-Tu·EF-Ts (black) to Cy3-labeled Phe-tRNAPhe (5 nm) and GTP (10 μm) or EF-Tu·EF-Ts in the absence of GTP (gray). Fitting the data (see “Experimental Procedures”) provided a quantitative measure of the apparent rate of ternary complex formation, kapp,1. A focused plot of the formation process is also shown (inset). B, measurements of kapp,1 as a function of either EF-Tu (open diamonds) or EF-Tu·EF-Ts (closed squares). The inset shows the linear fits of early factor titration data points. C, the time-dependent response in fluorescence intensity observed upon addition of saturating amounts of GDP (100 μm) to ternary complex preformed as described in A with either EF-Tu (blue) or EF-Tu·EF-Ts (black). Identical experiments were performed using ADP (100 μm) (gray). D, fitting to a single exponential function provided a quantitative measure of the off-rate of ternary complex formation, kapp,2, as a function of either EF-Tu (open diamonds) or EF-Tu·EF-Ts (closed squares) as described in C. E, similar disassociation experiments were performed at varying GTP concentrations. Addition of saturating GDP to ternary complex preformed with an excess of EF-Tu (open diamonds) or EF-Tu·EF-Ts (closed squares) and 5 nm Phe-tRNAPhe in the presence of GTP (50 nm–500 μm). Apparent decay rates, kapp,2, were estimated by fitting to a single exponential function. F, GDP (100 μm) was delivered to ternary complex preformed with EF-Tu·EF-Ts in the absence (black) or presence (tan) of kirromycin. The rate of GDP mediated dissociation in the absence of kirromycin (kapp,2 = 0.28 s−1) was found to be 14 times faster than in the presence of kirromycin (kapp,2 = 0.02 s−1). Error bars represent the S.E. from three independent experiments.
FIGURE 4.
FIGURE 4.
EF-Ts accelerates the rate-determining step in EF-Tu binding to aa-tRNA. Ternary complex was formed by rapid mixing of 200 nm Phe-tRNAPhe (Cy3-acp3U47) with EF-Tu or EF-Tu·EF-Ts preincubated in the presence of 1 mm GTP. Time courses of complex formation were fit to a single exponential function, and apparent rates were plotted as a function of EF-Tu (open diamonds) or EF-Tu·EF-Ts (closed squares) concentration. Under these conditions, the apparent rate of complex formation observed asymptotically approached ∼20 s−1 for EF-Tu and ∼85 s−1 for EF-Tu·EF-Ts. Error bars represent the S.E.
FIGURE 5.
FIGURE 5.
Physical isolation of ternary complex. Ternary complex formed in the presence of saturating concentrations of EF-Tu (circles) or EF-Tu·EF-Ts (diamonds), Cy3-labeled Phe-tRNAPhe, and GTP (see “Experimental Procedures”) was fractionated over a Superdex 75 gel filtration column in the presence (black) or absence (red) of GTP (10 μm) in the running buffer. Absorbance was recorded at 550 and 260 nm to specifically track the elution times of “unbound” and ternary complex-bound Cy3-labeled Phe-tRNAPhe as indicated. This was repeated with GDPNP in the reaction and running buffer (blue triangles).
FIGURE 6.
FIGURE 6.
EF-Ts directly facilitates ternary complex turnover. Region I, the relative fluorescence intensities of Cy3 (green; right axis) and mant (black; left axis) obtained from a solution containing 400 nm Phe-tRNAPhe (unlabeled), 5 nm Phe-tRNAPhe (Cy3-acp3U47), and 10 μm mant-GTP in the absence of factor. Region II, the increase in mant fluorescence intensity (black; left axis) and Cy3 fluorescence intensity (green; right axis) resulting from addition of 400 nm EF-Tu·EF-Ts to the mixture. Region III, addition of saturating amounts of unlabeled GTP (100 μm) resulted in a rapid decrease (kturnover = 0.6 ± 0.03 s−1) in the mant signal (black; left axis), whereas the Cy3 signal (green; right axis) exhibited a small increase in intensity.
FIGURE 7.
FIGURE 7.
Ternary complex formation and disassembly can occur via two distinct pathways. In both pathways, the binary complex EF-Tu·EF-Ts binds GTP, forming an EF-Tu·GTP·EF-Ts complex. In Path 1, this species directly binds aa-tRNA, forming a quaternary complex of EF-Tu·GTP·EF-Ts·aa-tRNA, which decays to the EF-Tu·GTP·aa-tRNA ternary complex following EF-Ts dissociation. In Path 2, EF-Ts dissociates from the EF-Tu·GTP·EF-Ts complex, allowing EF-Tu·GTP to bind aa-tRNA directly to form ternary complex.
FIGURE 8.
FIGURE 8.
Hypothetical EF-Tu·GTP·EF-Ts·Phe-tRNAPhe quaternary complex. A, a top-down perspective of the EF-Tu·GTP·Phe-tRNAPhe ternary complex (Protein Data Bank code 1OB2) showing EF-Tu (blue) bound to Phe-tRNAPhe (wheat) and GDPNP (green spheres). Here, the center panel shows an extended conformation (purple) of EF-Tu as it is observed in the E. coli EF-Tu·EF-Ts crystal structure (Protein Data Bank code 1EFU) where domains 2 and 3 of both EF-Tu structures are superimposed (N, Cα, CO, O root mean square deviation is 0.886 Å). The right panel highlights the position of EF-Ts (red) in a quaternary complex if its interactions with EF-Tu are identical to those observed in the E. coli EF-Tu·EF-Ts crystal structure. This model reveals only minor steric clashes between EF-Ts and the D-stem of the tRNA. The blue arrow indicates the hypothesized motions of the G domain of EF-Tu during ternary complex formation and decay. B, identical structures as in A from the perspective of looking down the axis of the tRNA acceptor stem. Structures were analyzed and rendered in PyMOL.

References

    1. Bourne H. R., Sanders D. A., McCormick F. (1991) The GTPase superfamily conserved structure and molecular mechanism. Nature 349, 117–127 - PubMed
    1. Vetter I. R., Wittinghofer A. (2001) The guanine nucleotide-binding switch in three dimensions. Science 294, 1299–1304 - PubMed
    1. Bos J. L., Rehmann H., Wittinghofer A. (2007) GEFs and GAPs: critical elements in the control of small G proteins. Cell 129, 865–877 - PubMed
    1. Wittinghofer A., Vetter I. R. (2011) Structure-function relationships of the G domain, a canonical switch motif. Annu. Rev. Biochem. 80, 943–971 - PubMed
    1. Thomposon R. C., Dix D. B. (1982) Accuracy of protein biosynthesis. A kinetic study of the reaction of poly(U)-programmed ribosomes with a leucyl-tRNA2-elongation factor Tu-GTP complex. J. Biol. Chem. 257, 6677–6682 - PubMed

Publication types

LinkOut - more resources