. 2013 May;24(6):906-16.
doi: 10.1681/ASN.2012020133. Epub 2013 Mar 28.

Podocytes are nonhematopoietic professional antigen-presenting cells

Affiliations

Podocytes are nonhematopoietic professional antigen-presenting cells

Andreas Goldwich et al. J Am Soc Nephrol. 2013 May.

Abstract

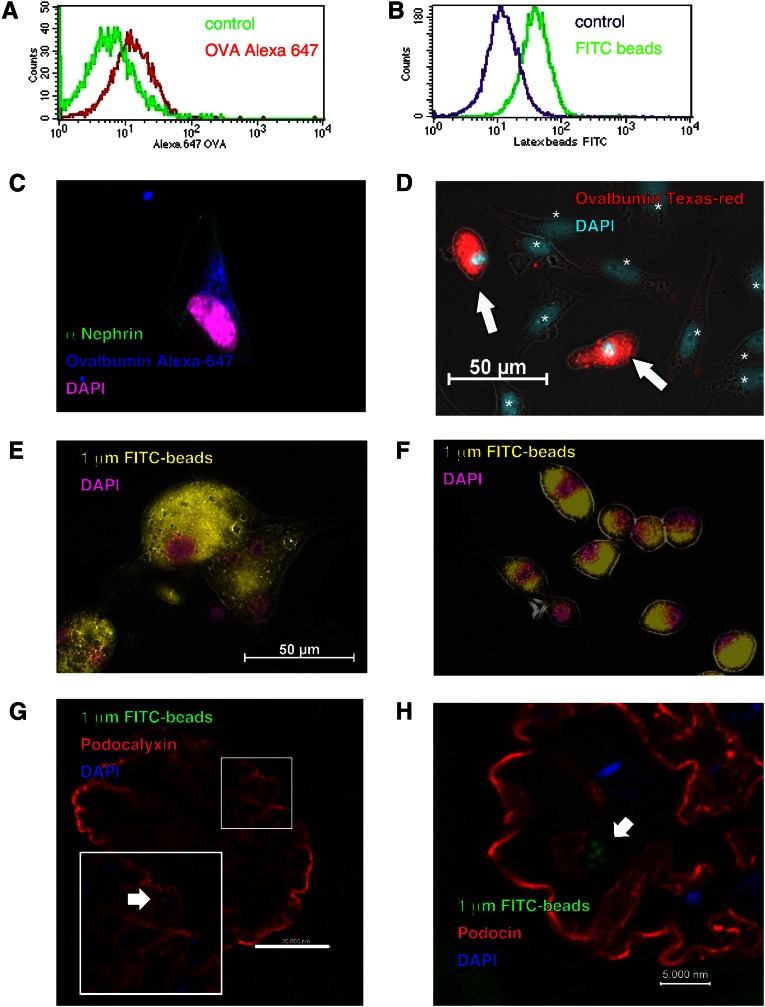
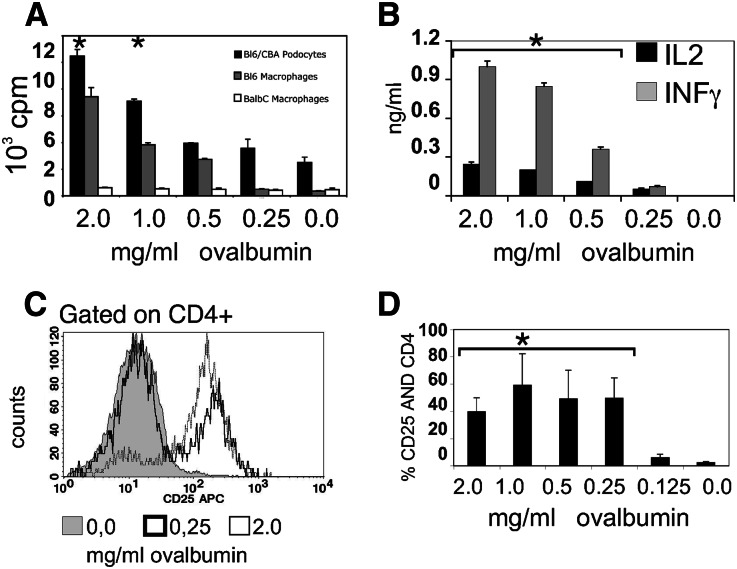
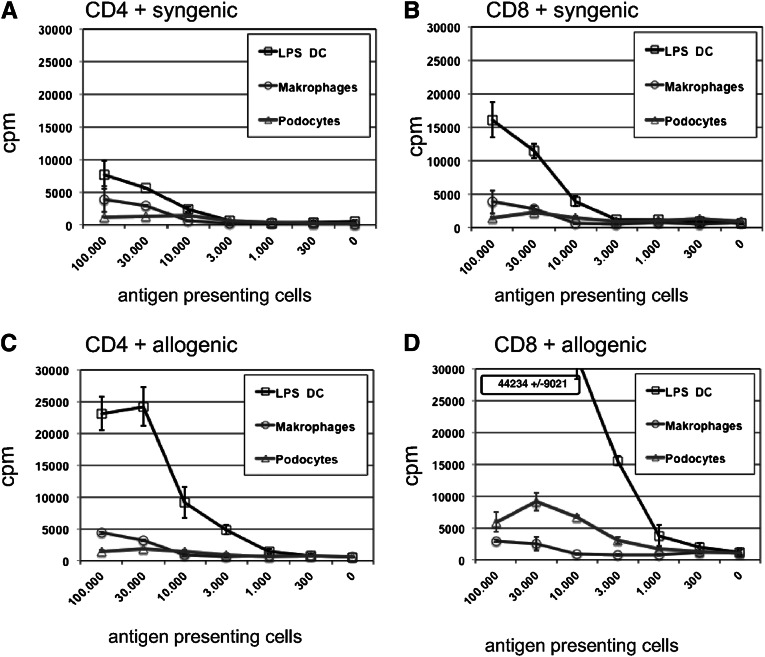
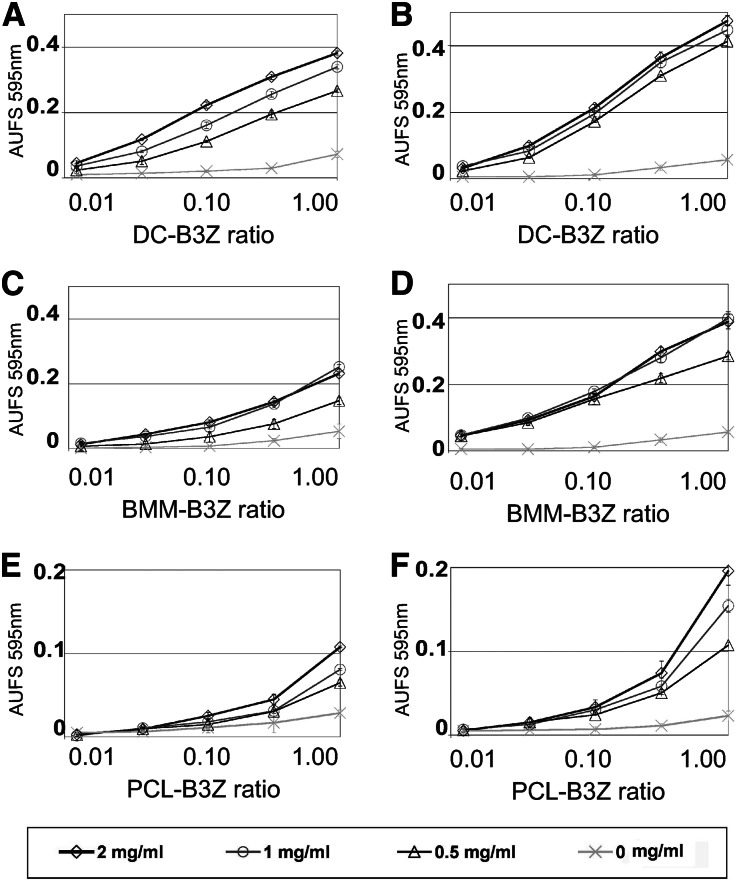
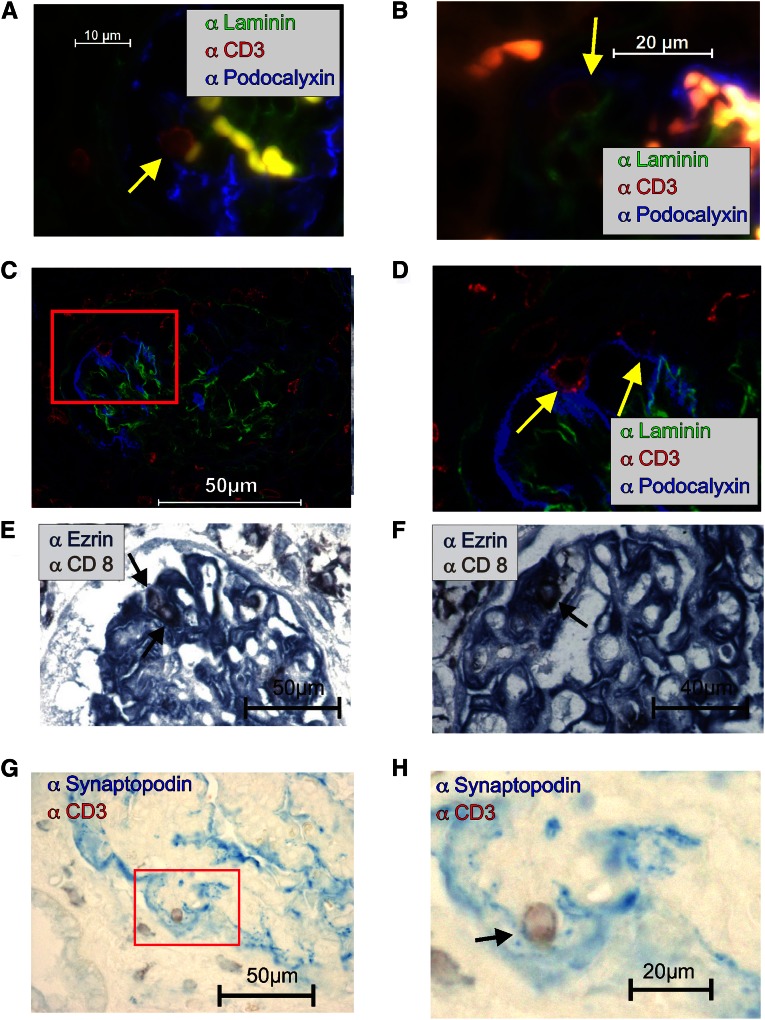
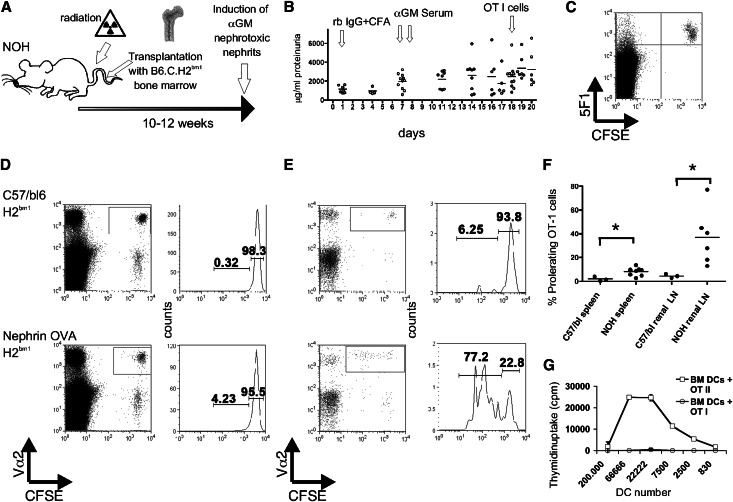
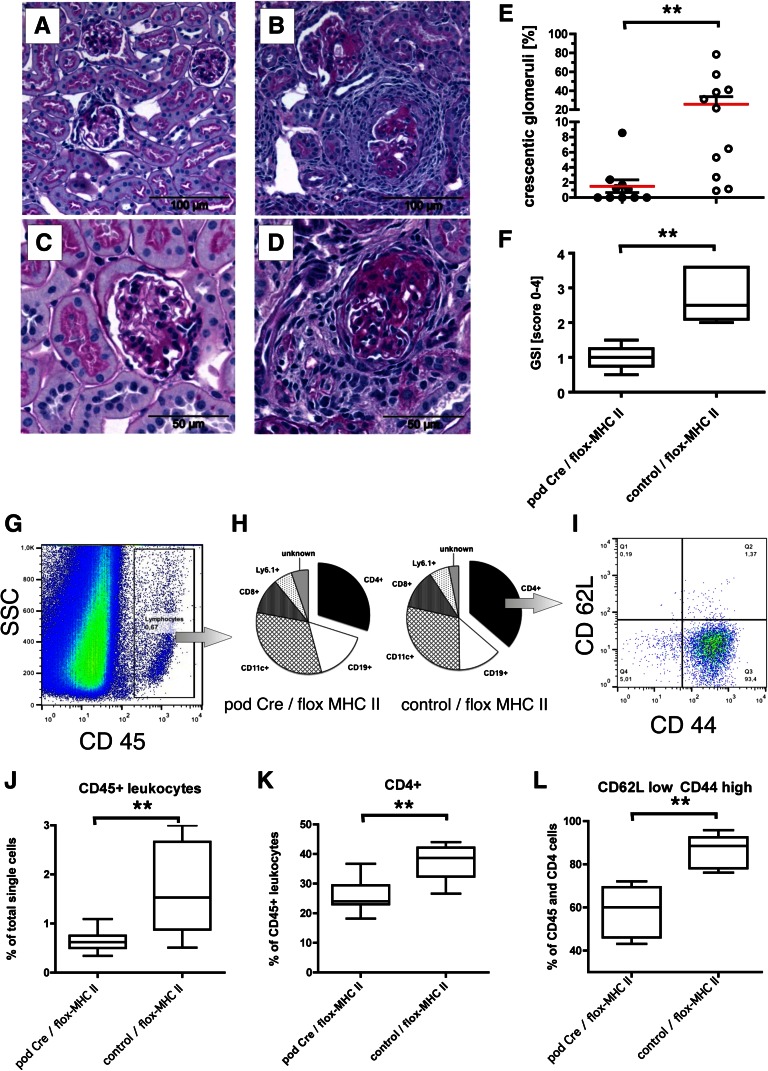
Podocytes are essential to the structure and function of the glomerular filtration barrier; however, they also exhibit increased expression of MHC class II molecules under inflammatory conditions, and they remove Ig and immune complexes from the glomerular basement membrane (GBM). This finding suggests that podocytes may act as antigen-presenting cells, taking up and processing antigens to initiate specific T cell responses, similar to professional hematopoietic cells such as dendritic cells or macrophages. Here, MHC-antigen complexes expressed exclusively on podocytes of transgenic mice were sufficient to activate CD8+ T cells in vivo. In addition, deleting MHC class II exclusively on podocytes prevented the induction of experimental anti-GBM nephritis. Podocytes ingested soluble and particulate antigens, activated CD4+ T cells, and crosspresented exogenous antigen on MHC class I molecules to CD8+ T cells. In conclusion, podocytes participate in the antigen-specific activation of adaptive immune responses, providing a potential target for immunotherapies of inflammatory kidney diseases and transplant rejection.


Figures

Figure 1.
Figure 1.
Podocytes ingest both labeled latex beads and soluble ovalbumin. Antigen uptake by conditionally immortalized murine PCLs was analyzed by FACS and is shown by a clear shift in the respective histograms. (A and B) The uptake of particles or soluble protein by different primary cells was visualized by microscopy. (C and E) Uptake rates of isolated primary podocytes, (D) isolated primary podocytes together with mesangium cells, and (F) BMMs were compared. The cells were incubated with (A and C) Alexa647, (D) Texas red-labeled ovalbumin, or (B, E, and F) yellow-green–labeled latex beads. We found that podocytes could ingest both labeled latex beads and soluble fluorescence-labeled ovalbumin. Labeled ovalbumin was incorporated by podocytes (white arrows in D). In contrast, mesangial cells, marked by asterisks and distinguished by the bigger nucleus in D, did not. Furthermore, (E) primary podocytes phagocytosed 1.0-µm beads to the same extent as (F) BMMs. Control staining was performed as shown in Supplemental Figure 5. The phagocytosis in vivo was shown by injecting 1.0-µm latex beads intravenously. After 24 hours, the mice were euthanized and analyzed histologically. The uptake of fluorescent particles into podocin- or podocalyxin-positive cells is shown in G and H.
Figure 2.
Figure 2.
Podocytes activate CD4+ T cells by MHC II presentation. BMMs or PCLs were cultivated for 1 day in the presence or absence of ovalbumin. The cells were intensely washed, and 5×10⁵ OT-II cells, purified by magnetic cell sorting, were added at a ratio of 1:1. (B) Supernatants were collected after 48 hours and analyzed for IL-2 and IFN-γ expression by ELISA. Proliferation was measured by 3H uptake, and the CD25 upregulation was analyzed after 48 hours. (A) PCL cells loaded with ovalbumin induced proliferation of ovalbumin-specific MHC class II-restricted CD4+ T cells from OT-II mice in a dose-dependent manner comparable with C57BL/6 BMMs, whereas BALB/c BMMs did not. *Significant differences to medium alone or podocytes without ovalbumin (P<0.05, t test). C shows a representative FACS staining, and D shows quantification of three experiments determining surface expression of the T cell activation marker CD25.
Figure 3.
Figure 3.
Podocytes activate CD8+ T cells by MHC I presentation. LPS-activated bone marrow DCs, BMMs, or PCLs were seeded in 96-well plates in the indicated numbers; 50,000 CD4+ or CD8+ T cells, purified by magnetic cell sorting, were added at a starting ratio of 1:2 down to 1:486. In the allogeneic setting (C and D), we used CBA/C57BL/6 heterocygote APCs and BALB/c T cells, whereas in the syngeneic setting (A and B), CBA/C57BL/6 heterocygote T cells were used. After 48 hours, the proliferation was measured by 3H uptake. Shown is one representative experiment of three performed. In all experiments, podocytes were more potent activating naïve CD8+ T cells than macrophages, and bone marrow DCs were superior to podocytes and additionally able to activate allogeneic CD4+ T cells.
Figure 4.
Figure 4.
Podocytes activate T cells by crosspresentation. Crosspresentation and activation of the ovalbumin-specific H2-Kb–restricted T cell hybridoma B3Z. DCs, BMMs, or PCLs were incubated with different concentrations of ovalbumin for 18 or 44 hours. After antigen uptake, serial dilutions of the cells were cocultured in 96-well plates with 50,000 B3Z T cells (APC/T cell ratios from 1:1 to 0.01:1). After 16 hours, the T cell activation was analyzed as described. (A and B) LPS-activated DCs incubated with ovalbumin for 18 or 44 hours in the presence of 0.1 µg/ml LPS. (C and D) BMMs incubated with ovalbumin for 18 or 44 hours. (E) Unstimulated PCLs incubated with ovalbumin for 44 hours. (F) PCLs stimulated with TNF-α (20 ng/ml) and incubated with ovalbumin for 44 hours. Individual values present the mean of three individual experiments ± SD.
Figure 5.
Figure 5.
T cell–podocyte contacts are detected in vivo. (A–D) Immunofluorescence showing triple staining for GBM positive for laminin (green), podocalyxin-positive podocytes (blue), and CD3+ T cells (red) in (A and B) the glomerulus of an NZB/W mouse with lupus nephritis or (C and D) a C57BL/6 mouse 21 days after induction of anti-GBM nephritis. (A, B, and D) The close contact (without laminin) between two CD3+ T cells and podocytes is marked with a yellow arrow. Immunohistological double staining of ezrin (blue) as a podocyte marker and CD8 (brown) as a T cell marker in rat models of renal disease. Close contact between CD8+ T cells and podocytes is marked with an arrow in (E) a 5/6 nephrectomy model (a nephron loss model) and (F) the allogeneic Fischer–Lewis renal transplantation model with signs of rejection. Immunohistological double staining of synaptopodin (blue; podocyte marker) and CD3 (brown; T cell marker) in human lupus GN (ISN/RPS IV). (G and H) Close contact between a CD3+ T cell and the foot processes of a podocyte (blue) is visible.
Figure 6.
Figure 6.
Podocytes activate naive T cells in vivo. (A) The schematic drawing illustrates the experimental setup. Transgenic mice expressing ovalbumin exclusively in the podocytes were radiated, and the hematopoietic system was reconstituted with bone marrow from B6.C.H2bm1 mice. These transferred hematopoietic cells are unable to present the ovalbumin peptide SIINFEKL. After complete reconstitution, anti-glomerular basement membrane (αGM) nephritis was induced by preimmunization with rabbit IgG in complete Freund's adjuvant (rb IgG + CFA) followed by two injections of a rabbit serum (αGM) reacting against murine glomerular basal membrane. The time course is shown in B. After 18 days, with the onset of proteinuria, CFSE-labeled OT-I cells were injected intravenously to monitor ovalbumin presentation by the proliferation of the transferred transgenic T cells. (C) Analysis of spleen cells indicating the success of the bone marrow transplantation. Only transferred CFSE-labeled OT-I cells are 5F1-positive, because this antibody does not recognize the H2bm1 antigen. A representative experiment displaying cells of two mice is shown in D for spleen and E for renal lymph nodes. The gates were set on the transgene T cell receptor Vα2. Please note that a T cell proliferation was only detectable in nephrin-OVA transgenic mice, whereas cells of C57BL/6 mice remained negative. The summary of several experiments is shown in F. *P<0.05. Bone marrow DCs from the same mice were generated and incubated with 0.5 mg/ml ovalbumin and incubated with OT-I or OT-II cells. (G) The proliferation was measured by 3H thymidin uptake. Bone marrow DCs from bone marrow chimeric mice did not activate OT-I cells but activated CD4+ transgenic OT-II T cells, showing that MHC class II presentation was not altered in the animals and that bone marrow reconstitutions were complete.
Figure 7.
Figure 7.
MHC II expressed on podocytes is essential for the induction of severe anti-GBM nephritis. Transgenic mice expressing the Cre recombinase exclusively in podocytes were crossed in a mouse line expressing a floxed MHC class II gene. In the F3 offspring and control littermates, an anti-GBM nephritis was induced as described in Figure 6. The kidneys were analyzed by histology and FACS. Exemplified periodic acid–Schiff staining is shown from mice without MHC class II (A and C) on podocytes and (B and D) from control animals. The quantification of three independent experiments is shown in E (percent crescentic glomeruli) and F (glomerulosclerosis index). The FACS gating strategy is shown in G–I. (J–L) The quantifications are shown as box plots (box-and-whisker diagrams graphically depicting the lowest number observed, lower quartile, median, upper quartile, and largest observation). **P<0.001. (G and J) First, the relative frequencies of CD45+ leukocytes in the kidneys were calculated; (H and I) subsequently, the main subpopulations of the leukocytes were analyzed, and within the CD45/CD4 double-positive populations, the frequencies of effector memory cells (CD44 high/CD62L low) were determined. Please note that most control animals displayed serve glomerulosclerosis, pronounced and frequent crescent formation, and infiltration of CD4+ effector memory cells. This result was not seen in mice lacking MHC class II expression selectively on podocytes.

References

    1. Vyas JM, Van der Veen AG, Ploegh HL: The known unknowns of antigen processing and presentation. Nat Rev Immunol 8: 607–618, 2008 - PMC - PubMed
    1. Goldwich A, Hahn SS, Schreiber S, Meier S, Kämpgen E, Wagner R, Lutz MB, Schubert U: Targeting HIV-1 Gag into the defective ribosomal product pathway enhances MHC class I antigen presentation and CD8+ T cell activation. J Immunol 180: 372–382, 2008 - PubMed
    1. Burgdorf S, Kautz A, Böhnert V, Knolle PA, Kurts C: Distinct pathways of antigen uptake and intracellular routing in CD4 and CD8 T cell activation. Science 316: 612–616, 2007 - PubMed
    1. Burgdorf S, Schölz C, Kautz A, Tampé R, Kurts C: Spatial and mechanistic separation of cross-presentation and endogenous antigen presentation. Nat Immunol 9: 558–566, 2008 - PubMed
    1. Shankland SJ: The podocyte’s response to injury: Role in proteinuria and glomerulosclerosis. Kidney Int 69: 2131–2147, 2006 - PubMed

Publication types

MeSH terms

LinkOut - more resources