

A comparison of DNA compaction by arginine and lysine peptides: a physical basis for arginine rich protamines
- PMID: 23540557
- PMCID: PMC3648981
- DOI: 10.1021/bi4001408
A comparison of DNA compaction by arginine and lysine peptides: a physical basis for arginine rich protamines
Abstract
Protamines are small, highly positively charged peptides used to package DNA at very high densities in sperm nuclei. Tight DNA packing is considered essential for the minimization of DNA damage by mutagens and reactive oxidizing species. A striking and general feature of protamines is the almost exclusive use of arginine over lysine for the positive charge to neutralize DNA. We have investigated whether this preference for arginine might arise from a difference in DNA condensation by arginine and lysine peptides. The forces underlying DNA compaction by arginine, lysine, and ornithine peptides are measured using the osmotic stress technique coupled with X-ray scattering. The equilibrium spacings between DNA helices condensed by lysine and ornithine peptides are significantly larger than the interhelical distances with comparable arginine peptides. The DNA surface-to-surface separation, for example, is some 50% larger with polylysine than with polyarginine. DNA packing by lysine rich peptides in sperm nuclei would allow much greater accessibility to small molecules that could damage DNA. The larger spacing with lysine peptides is caused by both a weaker attraction and a stronger short-range repulsion relative to that of the arginine peptides. A previously proposed model for binding of polyarginine and protamine to DNA provides a convenient framework for understanding the differences between the ability of lysine and arginine peptides to assemble DNA.
Figures
 , hexa-arg6+
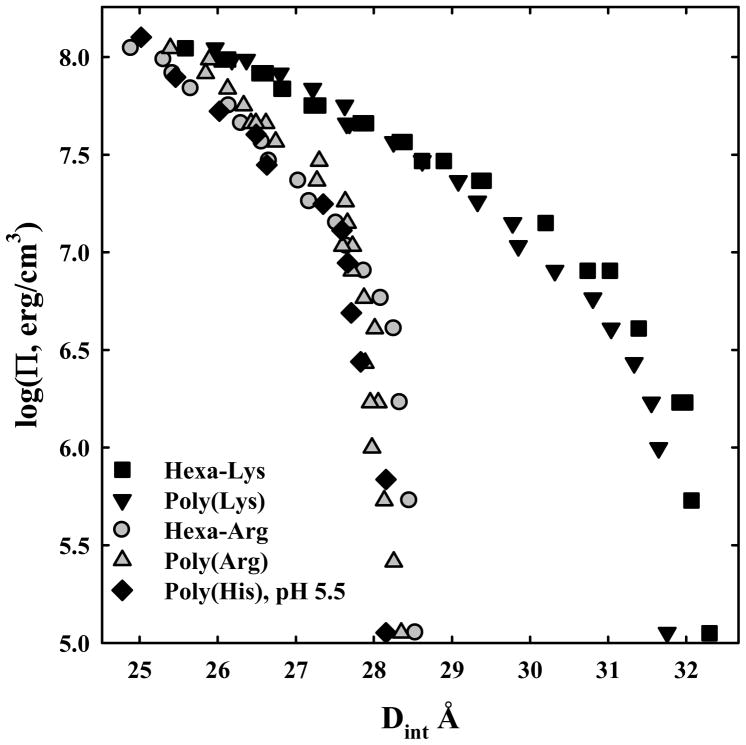
 , poly-lysine ▼, and hexa-lys6+ ■ and containing 10 mM Tris (pH 5.5) and 100 μM in monomer of poly-histidine ◆. PEG is excluded from the DNA phase and applies an osmotic pressure Π on it. The spacing between helices, Dint, was measured by x-ray scattering. The points at log(Π) ~ 5 indicate the equilibrium distance between helices in the absence of PEG. Poly-arginine, hexa-arg6+, and poly-histidine all show similar DNA-DNA force curves. Poly-lysine and hexa-lys6+ are also similar but have equilibrium spacings much larger than the others.
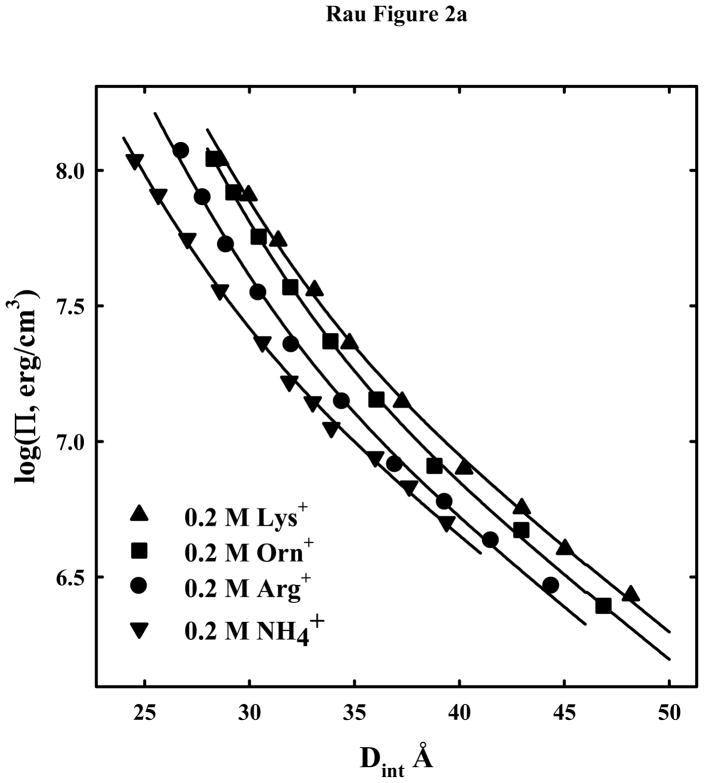
 ) are also shown. The solid lines are fits of the arginine and ammonium data to a hydration force, equation (2) with λh = 5 Å. The overlap of the 1.2 and 2 M arg+ data indicates that the interactions are dominated by hydration forces at high salt concentrations, not the electrostatic repulsion seen at lower salt concentrations as in (A). The ornithine and lysine force curves show very different behavior from other univalent ions that have been examined.
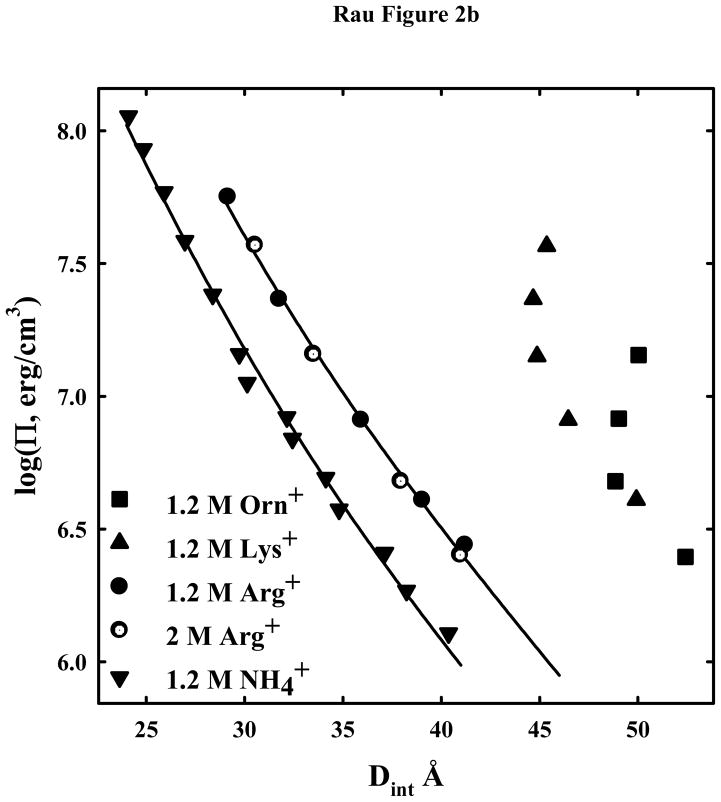 ) are also shown. The solid lines are fits of the arginine and ammonium data to a hydration force, equation (2) with λh = 5 Å. The overlap of the 1.2 and 2 M arg+ data indicates that the interactions are dominated by hydration forces at high salt concentrations, not the electrostatic repulsion seen at lower salt concentrations as in (A). The ornithine and lysine force curves show very different behavior from other univalent ions that have been examined.
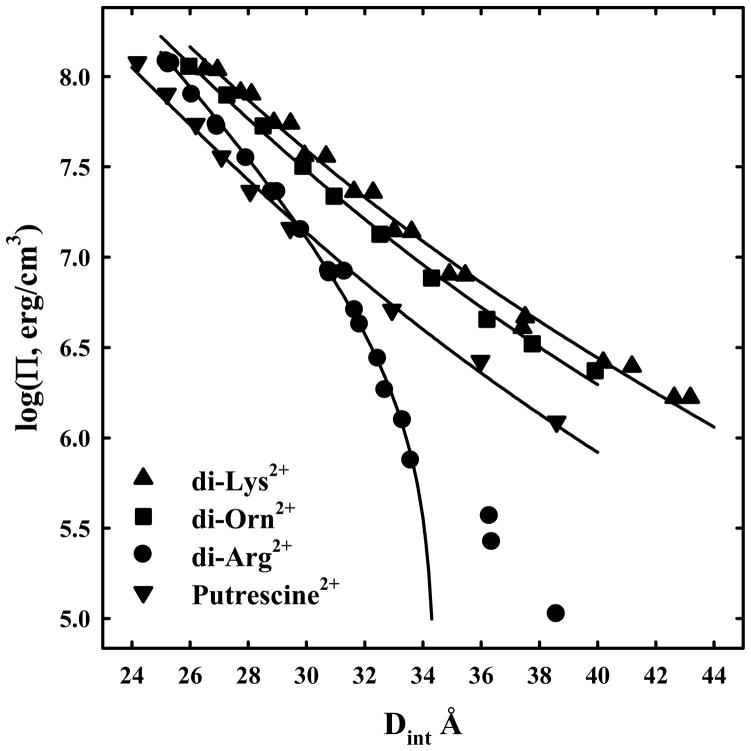
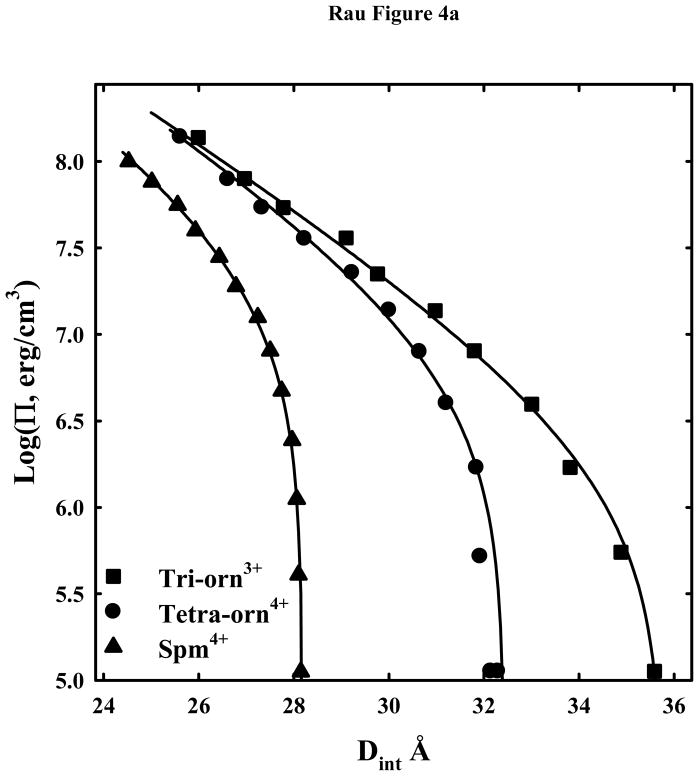 , and tetra-orn4+
 . Δlog(Π(Dint)) = log(Πexp(Dint)) − log(Πcalc(Dint)), where log(Πexp(Dint)) is the experimental log(Π) at Dint and log(Πcalc(Dint)) is the log(Π) at Dint calculated from the double exponential fit to the data. Note the systematic deviation of the lysine peptide data from the fit.
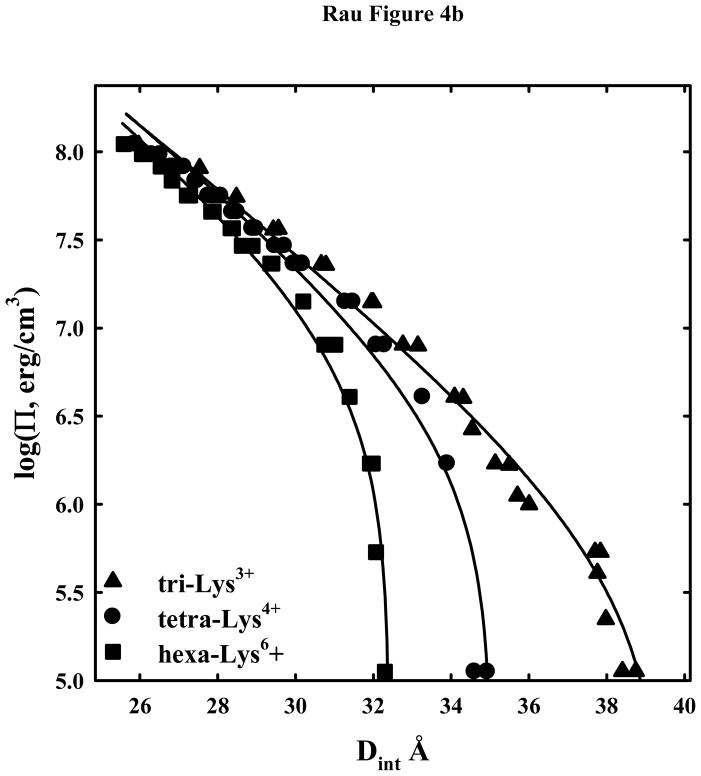 , and tetra-orn4+
. Δlog(Π(Dint)) = log(Πexp(Dint)) − log(Πcalc(Dint)), where log(Πexp(Dint)) is the experimental log(Π) at Dint and log(Πcalc(Dint)) is the log(Π) at Dint calculated from the double exponential fit to the data. Note the systematic deviation of the lysine peptide data from the fit.
, and tetra-orn4+
. Δlog(Π(Dint)) = log(Πexp(Dint)) − log(Πcalc(Dint)), where log(Πexp(Dint)) is the experimental log(Π) at Dint and log(Πcalc(Dint)) is the log(Π) at Dint calculated from the double exponential fit to the data. Note the systematic deviation of the lysine peptide data from the fit.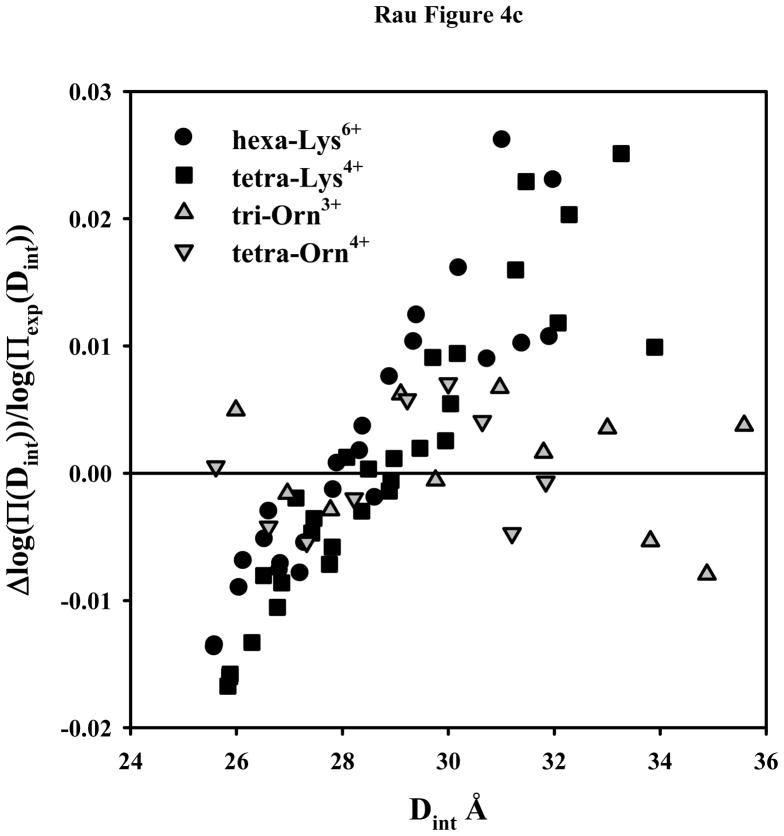 , and tetra-orn4+
. Δlog(Π(Dint)) = log(Πexp(Dint)) − log(Πcalc(Dint)), where log(Πexp(Dint)) is the experimental log(Π) at Dint and log(Πcalc(Dint)) is the log(Π) at Dint calculated from the double exponential fit to the data. Note the systematic deviation of the lysine peptide data from the fit.
, and tetra-orn4+
. Δlog(Π(Dint)) = log(Πexp(Dint)) − log(Πcalc(Dint)), where log(Πexp(Dint)) is the experimental log(Π) at Dint and log(Πcalc(Dint)) is the log(Π) at Dint calculated from the double exponential fit to the data. Note the systematic deviation of the lysine peptide data from the fit.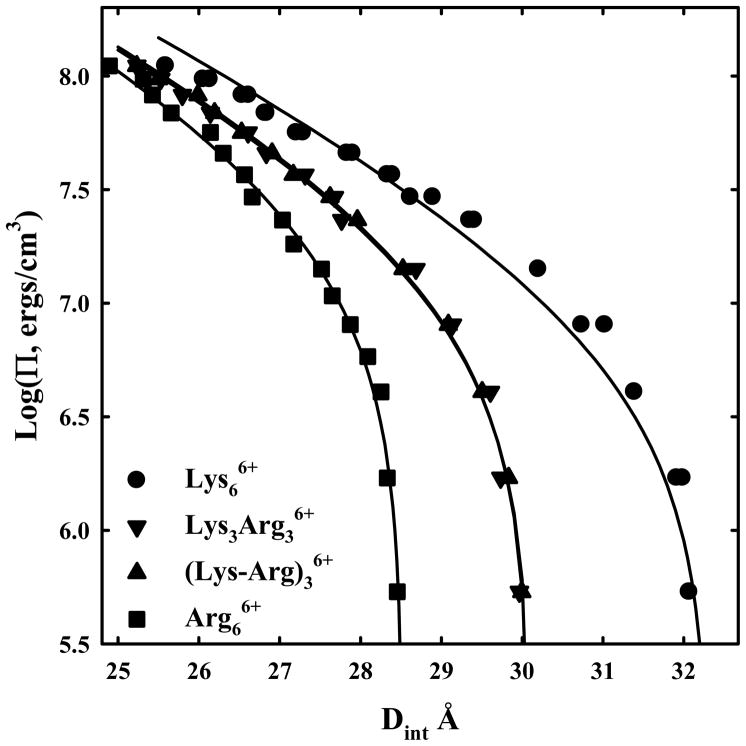
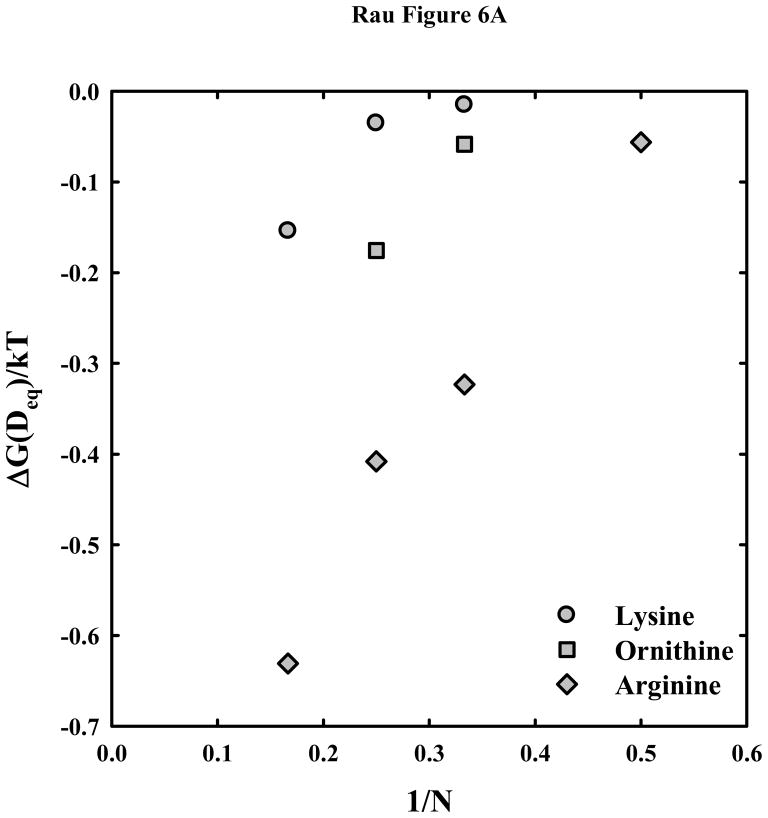
 , ornithine
 , and lysine
peptides. The much weaker attraction between DNA helices with lysine and ornithine peptides compared with arginine is apparent. (B) – The attractive and repulsive free energy components at 25 Å (in units of kT/bp) of the interaction are calculated from the double exponential fits to the osmotic stress force curves and equations (5) and (6). The repulsive, ΔGR(25 Å)/kT, and attractive, ΔGA(25 Å)/kT, free energies, respectively, are shown for the arginine (
, ◆), ornithine (
, ■) and lysine (
, ●) peptides.
, and lysine
peptides. The much weaker attraction between DNA helices with lysine and ornithine peptides compared with arginine is apparent. (B) – The attractive and repulsive free energy components at 25 Å (in units of kT/bp) of the interaction are calculated from the double exponential fits to the osmotic stress force curves and equations (5) and (6). The repulsive, ΔGR(25 Å)/kT, and attractive, ΔGA(25 Å)/kT, free energies, respectively, are shown for the arginine (
, ◆), ornithine (
, ■) and lysine (
, ●) peptides.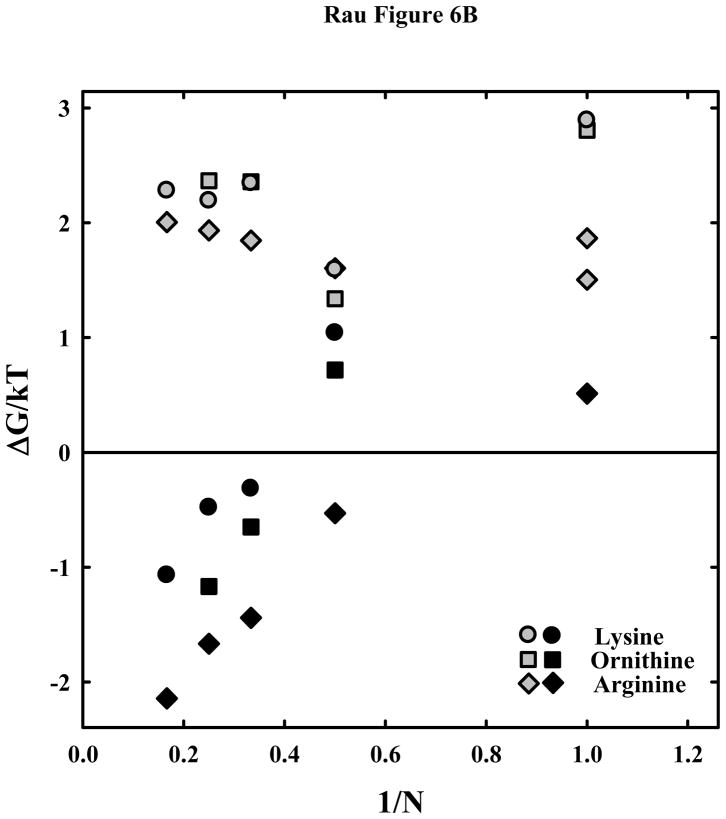 , ornithine
, and lysine
peptides. The much weaker attraction between DNA helices with lysine and ornithine peptides compared with arginine is apparent. (B) – The attractive and repulsive free energy components at 25 Å (in units of kT/bp) of the interaction are calculated from the double exponential fits to the osmotic stress force curves and equations (5) and (6). The repulsive, ΔGR(25 Å)/kT, and attractive, ΔGA(25 Å)/kT, free energies, respectively, are shown for the arginine (
, ◆), ornithine (
, ■) and lysine (
, ●) peptides.
, ornithine
, and lysine
peptides. The much weaker attraction between DNA helices with lysine and ornithine peptides compared with arginine is apparent. (B) – The attractive and repulsive free energy components at 25 Å (in units of kT/bp) of the interaction are calculated from the double exponential fits to the osmotic stress force curves and equations (5) and (6). The repulsive, ΔGR(25 Å)/kT, and attractive, ΔGA(25 Å)/kT, free energies, respectively, are shown for the arginine (
, ◆), ornithine (
, ■) and lysine (
, ●) peptides.Similar articles
-
Role of amino acid insertions on intermolecular forces between arginine peptide condensed DNA helices: implications for protamine-DNA packaging in sperm.J Biol Chem. 2011 Dec 9;286(49):41985-41992. doi: 10.1074/jbc.M111.295808. Epub 2011 Oct 12. J Biol Chem. 2011. PMID: 21994948 Free PMC article.
-
DNA condensation by protamine and arginine-rich peptides: analysis of toroid stability using single DNA molecules.Mol Reprod Dev. 2000 Jun;56(2 Suppl):230-4. doi: 10.1002/(SICI)1098-2795(200006)56:2+<230::AID-MRD3>3.0.CO;2-V. Mol Reprod Dev. 2000. PMID: 10824973
-
Protamine-induced condensation and decondensation of the same DNA molecule.Science. 1999 Oct 1;286(5437):120-3. doi: 10.1126/science.286.5437.120. Science. 1999. PMID: 10506559
-
The protamine family of sperm nuclear proteins.Genome Biol. 2007;8(9):227. doi: 10.1186/gb-2007-8-9-227. Genome Biol. 2007. PMID: 17903313 Free PMC article. Review.
-
Mammalian Sperm Protamine Extraction and Analysis: A Step-By-Step Detailed Protocol and Brief Review of Protamine Alterations.Protein Pept Lett. 2018;25(5):424-433. doi: 10.2174/0929866525666180412155205. Protein Pept Lett. 2018. PMID: 29651936 Review.
Cited by
-
Histone H4 Tails in Nucleosomes: a Fuzzy Interaction with DNA.Angew Chem Int Ed Engl. 2021 Mar 15;60(12):6480-6487. doi: 10.1002/anie.202012046. Epub 2021 Feb 12. Angew Chem Int Ed Engl. 2021. PMID: 33522067 Free PMC article.
-
Dynamic Stereoselection of Peptide Helicates and Their Selective Labeling of DNA Replication Foci in Cells*.Angew Chem Int Ed Engl. 2021 Apr 12;60(16):8859-8866. doi: 10.1002/anie.202013039. Epub 2021 Jan 28. Angew Chem Int Ed Engl. 2021. PMID: 33290612 Free PMC article.
-
Polymers for Disrupting Protein-Protein Interactions: Where Are We and Where Should We Be?Biomacromolecules. 2024 Oct 14;25(10):6229-6249. doi: 10.1021/acs.biomac.4c00850. Epub 2024 Sep 10. Biomacromolecules. 2024. PMID: 39254158 Review.
-
Two arginine residues suppress the flexibility of nucleosomal DNA in the canonical nucleosome core.PLoS One. 2015 Mar 18;10(3):e0120635. doi: 10.1371/journal.pone.0120635. eCollection 2015. PLoS One. 2015. PMID: 25786215 Free PMC article.
-
Ned Seeman and the prediction of amino acid-basepair motifs mediating protein-nucleic acid recognition.Biophys J. 2022 Dec 20;121(24):4777-4787. doi: 10.1016/j.bpj.2022.06.017. Epub 2022 Jun 15. Biophys J. 2022. PMID: 35711143 Free PMC article. Review.
References
-
- Johnson JE, Chiu W. DNA packaging and delivery machines in tailed bacteriophages. Current opinion in structural biology. 2007;17:237–243. - PubMed
-
- Nurmemmedov E, Castelnovo M, Catalano CE, Evilevitch A. Biophysics of viral infectivity: matching genome length with capsid size. Quarterly reviews of biophysics. 2007;40:327–356. - PubMed
-
- Blanc NS, Senn A, Leforestier A, Livolant F, Dubochet J. DNA in human and stallion spermatozoa forms local hexagonal packing with twist and many defects. Journal of Structural Biology. 2001;134:76–81. - PubMed
-
- Hud NV, Allen MJ, Downing KH, Lee J, Balhorn R. Identification of the elemental packing unit of DNA in mammalian sperm cells by atomic force microscopy. Biochemical and biophysical research communications. 1993;193:1347–1354. - PubMed
-
- Brewer L. Deciphering the structure of DNA toroids. Integr Biol. 2011;3:540–547. - PubMed
Publication types
MeSH terms
Substances
Grants and funding
LinkOut - more resources
Full Text Sources
Other Literature Sources
