. 2013 Apr 16;110(16):E1514-23.
doi: 10.1073/pnas.1218731110. Epub 2013 Mar 29.

Increased axonal bouton dynamics in the aging mouse cortex

Affiliations

Increased axonal bouton dynamics in the aging mouse cortex

Federico W Grillo et al. Proc Natl Acad Sci U S A. .

Abstract

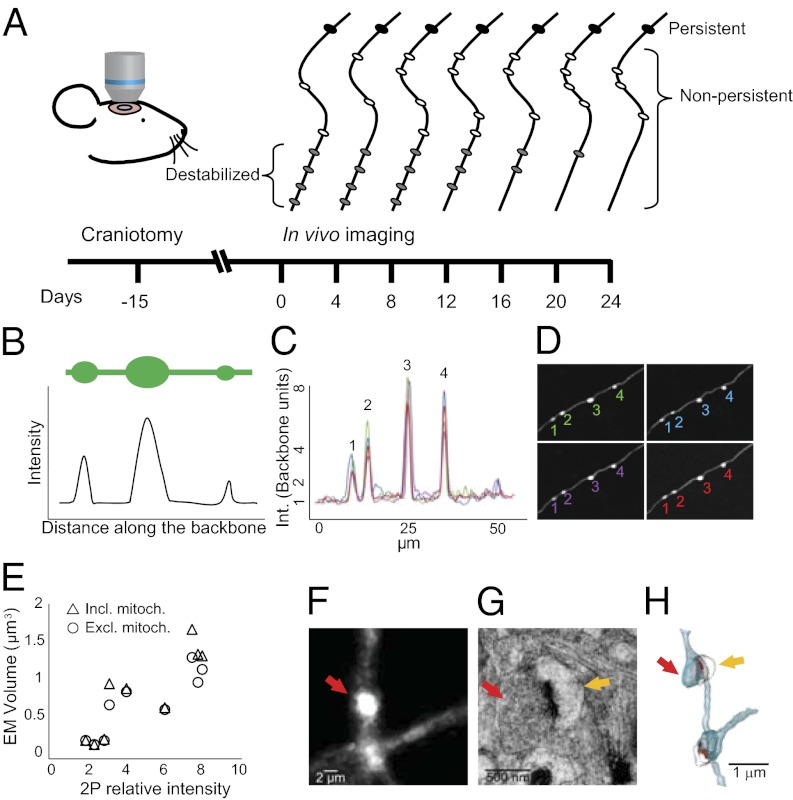
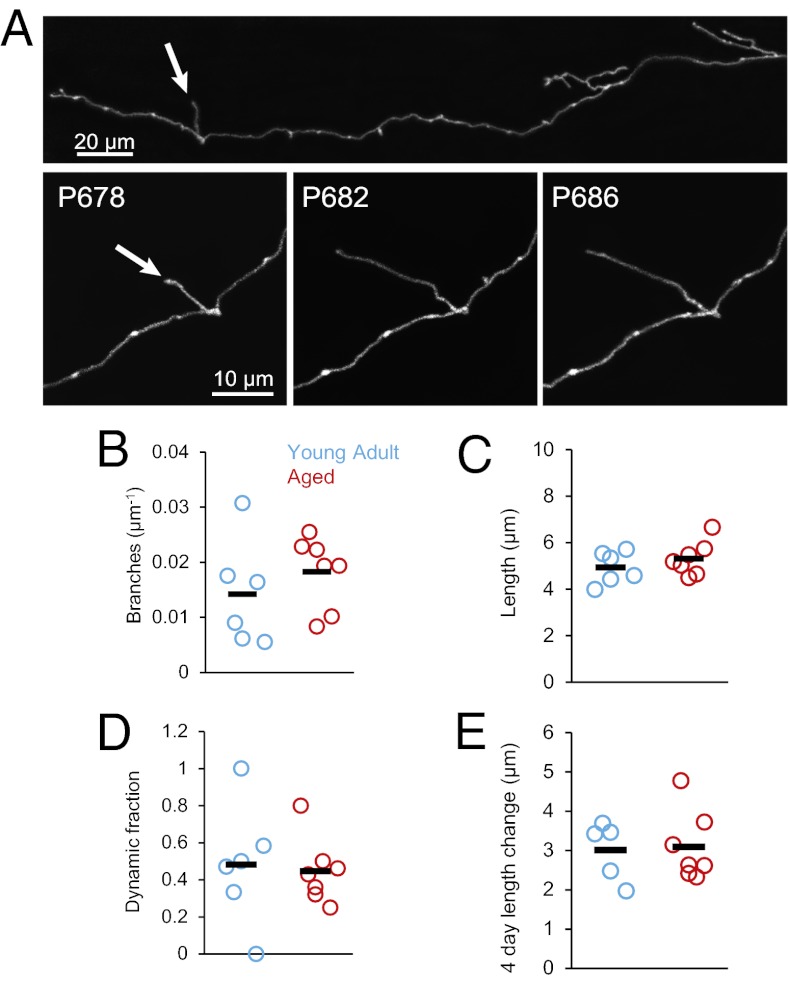
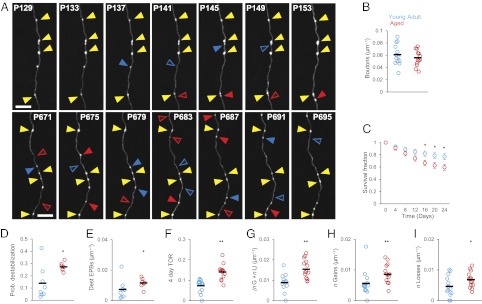
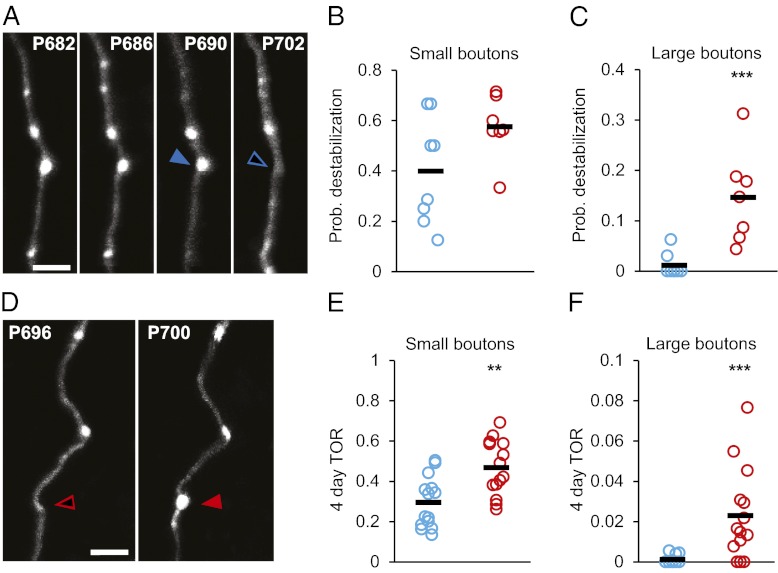
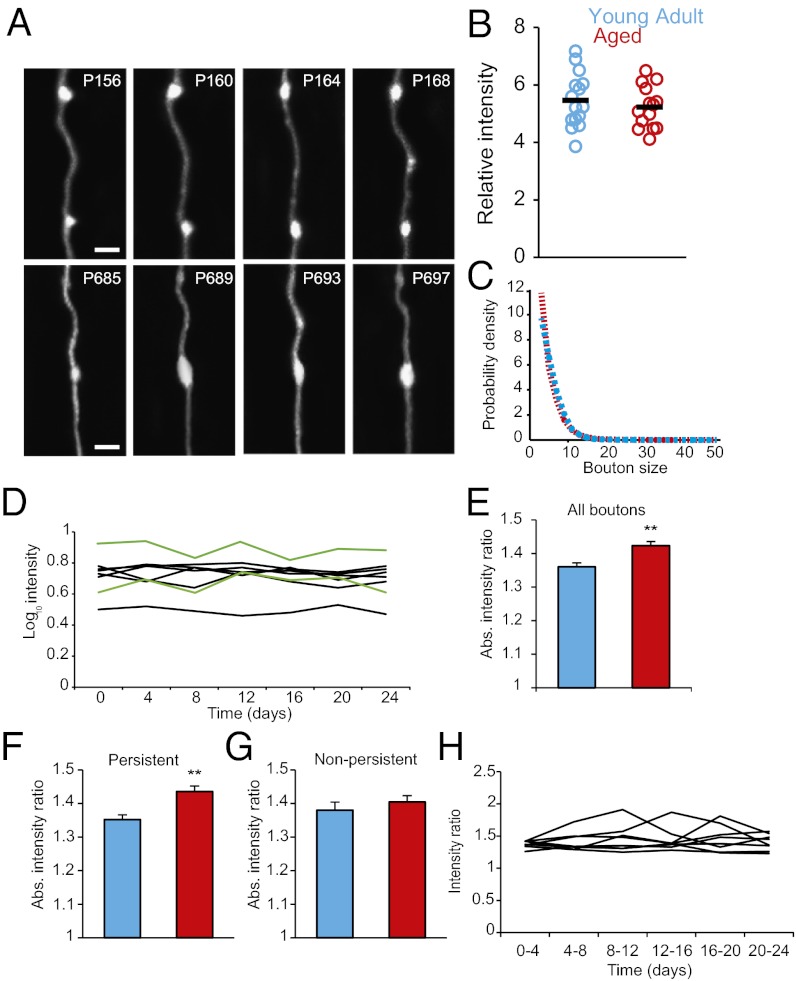
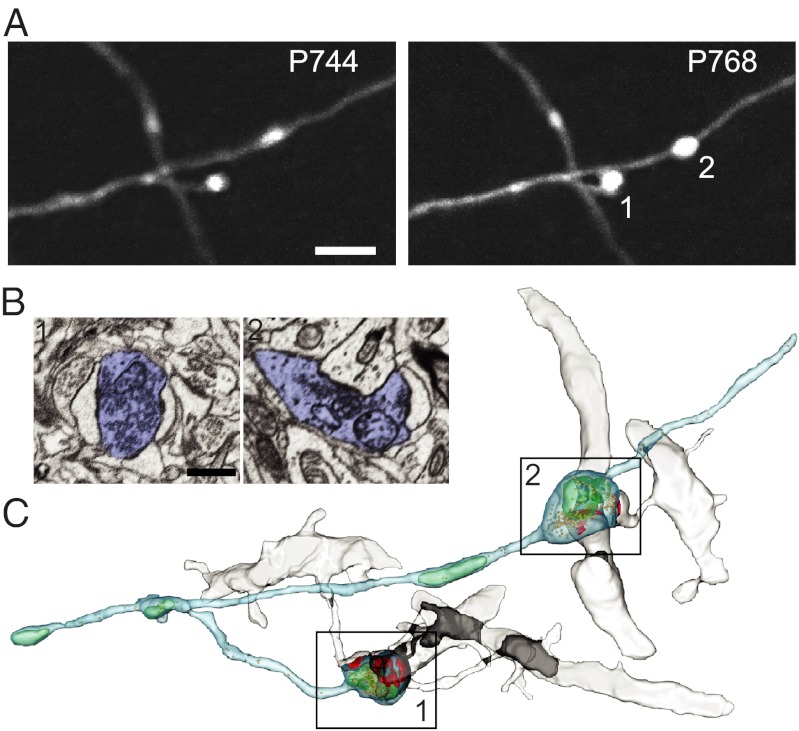
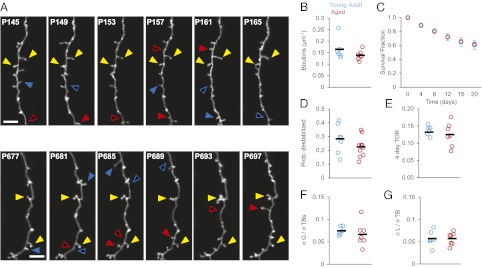
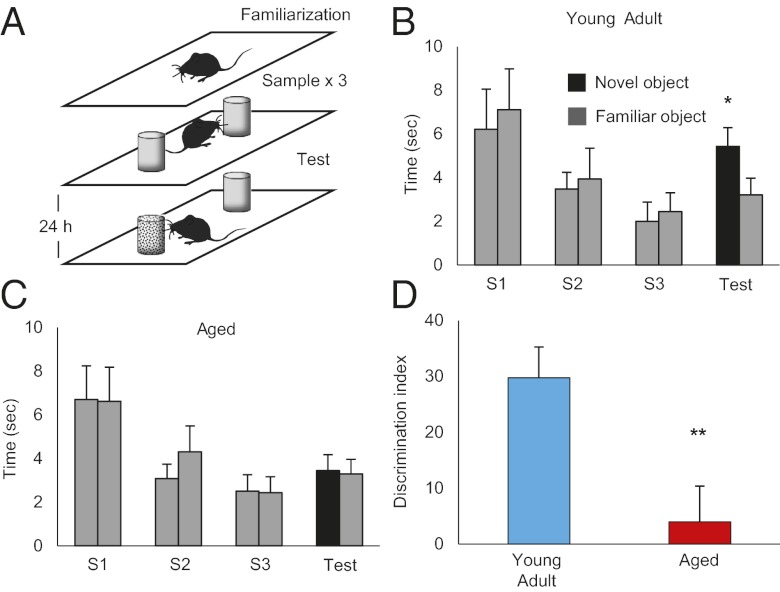
Aging is a major risk factor for many neurological diseases and is associated with mild cognitive decline. Previous studies suggest that aging is accompanied by reduced synapse number and synaptic plasticity in specific brain regions. However, most studies, to date, used either postmortem or ex vivo preparations and lacked key in vivo evidence. Thus, whether neuronal arbors and synaptic structures remain dynamic in the intact aged brain and whether specific synaptic deficits arise during aging remains unknown. Here we used in vivo two-photon imaging and a unique analysis method to rigorously measure and track the size and location of axonal boutons in aged mice. Unexpectedly, the aged cortex shows circuit-specific increased rates of axonal bouton formation, elimination, and destabilization. Compared with the young adult brain, large (i.e., strong) boutons show 10-fold higher rates of destabilization and 20-fold higher turnover in the aged cortex. Size fluctuations of persistent boutons, believed to encode long-term memories, also are larger in the aged brain, whereas bouton size and density are not affected. Our data uncover a striking and unexpected increase in axonal bouton dynamics in the aged cortex. The increased turnover and destabilization rates of large boutons indicate that learning and memory deficits in the aged brain arise not through an inability to form new synapses but rather through decreased synaptic tenacity. Overall our study suggests that increased synaptic structural dynamics in specific cortical circuits may be a mechanism for age-related cognitive decline.


Conflict of interest statement

The authors declare no conflict of interest.

Figures

Fig. 1.
Fig. 1.
Experimental outline and EPBscore software principles. (A) Schematic of the experimental design. GFP+ mice underwent cranial surgery. Two-photon in vivo imaging started 15 d after the craniotomy. Boutons were classified, according to their dynamics as either persistent (always present; solid black ovals) or nonpersistent (absent in at least one session; white or gray ovals). A subset of nonpersistent boutons was defined as destabilized (gray ovals). (BD) EPBscore software. (B) Axons were modeled as cables filled with GFP. Plotting the maximum intensities along the cable returns an intensity profile. (C) Overlaid intensity profiles corresponding to EPBs (profile peaks) over multiple imaging sessions (represented by different colors). (D) Time-lapse series (4-d interval) showing correlation of detected EPBs identified by peak profile values. Numbers relate to the peaks in C, and colors indicate single-session profiles. (E) Nine imaged EPBs were reconstructed at the EM level revealing a high degree of correlation between the EM-calculated volume and the two-photon–measured intensity, both including (triangles, P = 0.003) and excluding (circles, P = 0.002) mitochondria from EM volume measurements. (FH) Representative EM 3D reconstruction of an imaged EPB. (F) Two-photon image showing the EPB of interest (red arrow). (G) EM section of in vivo-imaged EPB. The red arrow indicates an EPB with a visible vesicle pool and an electron-dense active zone. The yellow arrow points to the postsynaptic spine. (H) 3D reconstruction from EM serial sections. The red arrow indicates the EPB of interest; the yellow arrow indicates the postsynaptic spine.
Fig. 2.
Fig. 2.
Axonal arbors continue to remodel in the Ag brain. (A) (Lower) Time series showing active growth of a branch (arrow) in the Ag mouse brain from postnatal day 678. (Upper) Low-magnification view of the same axon. (B) Density of axonal branches is comparable (P = 0.22) in YA (blue circles, n = 6 mice, 7 axons, 72 branches), and Ag (red circles, n = 7 mice, 10 axons, 109 branches). Black markers indicate the average values in the respective groups. (C) Average branch length per animal over six imaging sessions (20 d) is comparable in the two groups (P = 0.44). (D) Fraction of branches that display dynamic behavior is comparable in YA and Ag mice (P = 0.56). (E) Mean change in the absolute length of dynamic branches over all imaging sessions in a 4-d interval is similar in YA and Ag mice (P = 0.94).
Fig. 3.
Fig. 3.
Rates of EPB replacement are higher in Ag mice than in YA mice. (A) Time series showing EPB dynamics in YA (Upper) and Ag (Lower) mice. Yellow arrowheads point to persistent EPBs; solid blue arrowheads indicate EPBs that will be lost in the next session; open blue triangles indicate EPBs present in the previous session and lost in the session shown. Solid red triangles indicate EPBs that have been gained; open red triangles indicate the location in the previous session. (Scale bars: 10 μm.) (B) EPB density is not significantly different in YA mice (blue circles, n = 13 animals) and Ag mice (red circles, n = 14 animals); P = 0.33. Black markers indicate the average values for the respective groups. (C) EPBs in the Ag brain are less stable than in the YA brain. Shown are the SFs of EPBs in YA brains (blue circles, n = 13 axons) and Ag brains (red circles, n = 15 axons); P = 2.01−06. (D) ProbDest is higher in the Ag brain (red circles, n = 7 animals and 15 axons) than in the YA brain (blue circles; n = 8 animals and 13 axons); P = 0.02. (E) The density of destabilized EPBs is higher in Ag mice (red circles) than in YA mice (blue circles); P = 0.04. (F) The EPB TOR is higher in Ag brains (red circles; n = 14 animals) than in YA brains (blue circles; n = 13 animals); P = 0.0014. Circles represent individual animals. (G) TOR density is higher in the Ag brain (red circles) than in the YA brain (blue circles); P = 0.008. (H) Gain density is higher in the Ag brain (red circles, n = 14 animals) than in the YA brain (blue circles, n = 13 animals); P = 0.0016; (I) Loss density is higher in the Ag brain (P = 0.029). Black markers indicate average values in the respective groups. *P < 0.05, **P < 0.01.
Fig. 4.
Fig. 4.
Large EPBs are affected more in Ag mice. (A) Representative time series showing a large bouton on an Ag axon that is stable during the first three imaging sessions (filled blue arrowhead) and subsequently is lost before the end of the series (open blue arrowhead). (B) ProbDest for small (lowest tercile in size) EPBs is not significantly different in the YA (blue circles) and Ag (red circles) groups; P = 0.07. (C) ProbDest for large (highest tercile in size) EPBs is dramatically increased in the Ag brain; P = 0.0006. (D) Consecutive time points of an imaged Ag axon showing the addition of a large EPB (filled red arrowhead). (E) TOR for small EPBs is significantly increased in the Ag brain (P = 0.004). (F) TOR for large EPBs is more than 20-fold higher in the Ag brain than in the YA brain (P = 0.0009). Black markers are average values in respective groups. (Scale bars: 5 μm.) **P < 0.01, ***P < 0.001.
Fig. 5.
Fig. 5.
Persistent EPBs size changes over days are greater in Ag mice. (A) Time series showing variation in intensity/size of single boutons in YA (Upper) and Ag (Lower) animals (Scale bars: 2 μm). (B) Relative EPB intensity expressed in backbone units is comparable in YA brains (blue circles; n = 15 animals, 1,082 EPBs) and Ag brains (red circles; n = 14 animals, 1,588 EPBs); P = 0.5. Black markers indicate average values. (C) The EPB size distribution is similar in Ag brains (red circles) and YA brains (blue circles). (D) EPB size over time on eight representative axons in Ag mice. Two axons (green lines) show correlated changes in size (P < 0.05, one-way ANOVA). (EG) Mean absolute intensity ratio over a 4-d interval. (E) Intensity ratio averaged for all EPBs in the YA (blue bar; n = 980 EPBs) and Ag (red bar; n = 1,386 EPBs) groups; P = 0.0077. (F) Persistent EPB intensity ratio in YA (blue bar; n = 707 EPBs) and Ag (red bar; n = 872 EPBs) groups; P = 0.0047. (G) Nonpersistent EPB intensity ratio in the YA (blue bar, n = 273 EPBs) and Ag (red bar; n = 514 EPBs) groups; P = 0.467. (H) EPB intensity ratio over time for representative individual axons in the Ag brain (n = 8 axons); P > 0.05 for all; one-way ANOVA. **P < 0.01.
Fig. 6.
Fig. 6.
Large boutons in the aged brain form synapses. (A) In vivo 2P imaging of two large persistent boutons. (Scale bar: 5 μm.) (B) Both boutons make multiple synaptic contacts, as visible in a single plane of the correspondent EM images, with multiple dendritic spines. (Scale bar: 500 nm.) (C) 3D rendering of the same axon in A. The cytoplasm of the axon is represented in light blue, mitochondria in green, synaptic vesicles in yellow and synapses in red. The postsynaptic spiny neurons are shown in grey. Bouton 1 has a total volume of 2.03 μm3, bouton 2 of 2.35 μm3; excluding the space occupied by mitochondria the volumes are 1.61 and 1.78 μm3, respectively.
Fig. 7.
Fig. 7.
TB-rich axons have comparable dynamics in Ag (n = 6) and YA (n = 7) mice. (A) Time series showing TB dynamics in YA (Upper) and Ag (Lower) mice. Yellow triangles indicate persistent TBs; solid blue triangles indicate TBs that will be lost in the next session; open blue triangles indicate TBs that have been lost; solid red triangles indicate TBs that have been gained since the previous session; open red triangles indicate the location in the previous session. (Scale bars: 10 μm.) (B) Mean TB density is comparable in YA animals (blue circles) and Ag animals (red circles). P = 0.58. Black markers indicate respective means across mice. (C) SF is comparable in YA mice (blue circles; n = 7 animals, 692 TBs) and Ag mice (red circles; n = 10 animals, 720 TBs); P = 0.66. (D) ProbDest is comparable in YA (blue circles; n = 7 axons) and Ag (red circles; n = 10 axons) animals; P = 0.23). (E) TOR is comparable in YA animals (blue circles) and Ag animals (red circles); P = 0.36. (F) Fractions of TB gains are comparable in Ag mice (red circles) and YA mice (blue circles); P = 0.37. (G) Fractions of TB losses are comparable in Ag mice (red circles) and YA mice (blue circles); P = 0.63. Black markers indicate the mean values across animals in the respective groups.
Fig. 8.
Fig. 8.
Ag mice have impaired long-term recognition memory. (A) Tactile version of the object-recognition task. In three sample trials (S1, S2, and S3) two identical objects are placed in the apparatus. The test trial takes place 24 h later with a novel object. (B and C) Time spent exploring the familiar (gray bar) and novel (black bar) objects in all trials by (B) YA mice (n = 13, test mean familiar object exploration = 3.2 ± 0.62 s; novel object exploration = 5.4 ± 0.99 s; P = 0.043, two-way ANOVA) and (C) Ag mice (n = 13, test mean familiar object exploration = 2.9 ± 0.76 s; novel object exploration = 3.2 ± 0.85 s; P = 0.93; two-way ANOVA). Both Ag and YA mice show adaptation and tend to explore the objects less. (D) DI for YA mice (blue bar; DI = 29.78 ± 5.5) and Ag mice (red bar; DI = 3.99 ± 6.39); P = 0.005; unpaired t test. *P < 0.05, **P < 0.01.

References

    1. Burke SN, Barnes CA. Neural plasticity in the ageing brain. Nat Rev Neurosci. 2006;7(1):30–40. - PubMed
    1. Morrison JH, Baxter MG. The ageing cortical synapse: Hallmarks and implications for cognitive decline. Nat Rev Neurosci. 2012;13(4):240–250. - PMC - PubMed
    1. Burke SN, Barnes CA. Senescent synapses and hippocampal circuit dynamics. Trends Neurosci. 2010;33(3):153–161. - PMC - PubMed
    1. Geinisman Y, deToledo-Morrell L, Morrell F, Persina IS, Rossi M. Age-related loss of axospinous synapses formed by two afferent systems in the rat dentate gyrus as revealed by the unbiased stereological dissector technique. Hippocampus. 1992;2(4):437–444. - PubMed
    1. Foster TC, Barnes CA, Rao G, McNaughton BL. Increase in perforant path quantal size in aged F-344 rats. Neurobiol Aging. 1991;12(5):441–448. - PubMed

Publication types