. 2013 May;16(5):571-9.
doi: 10.1038/nn.3357. Epub 2013 Mar 31.

Degeneration and impaired regeneration of gray matter oligodendrocytes in amyotrophic lateral sclerosis

Affiliations

Degeneration and impaired regeneration of gray matter oligodendrocytes in amyotrophic lateral sclerosis

Shin H Kang et al. Nat Neurosci. 2013 May.

Abstract

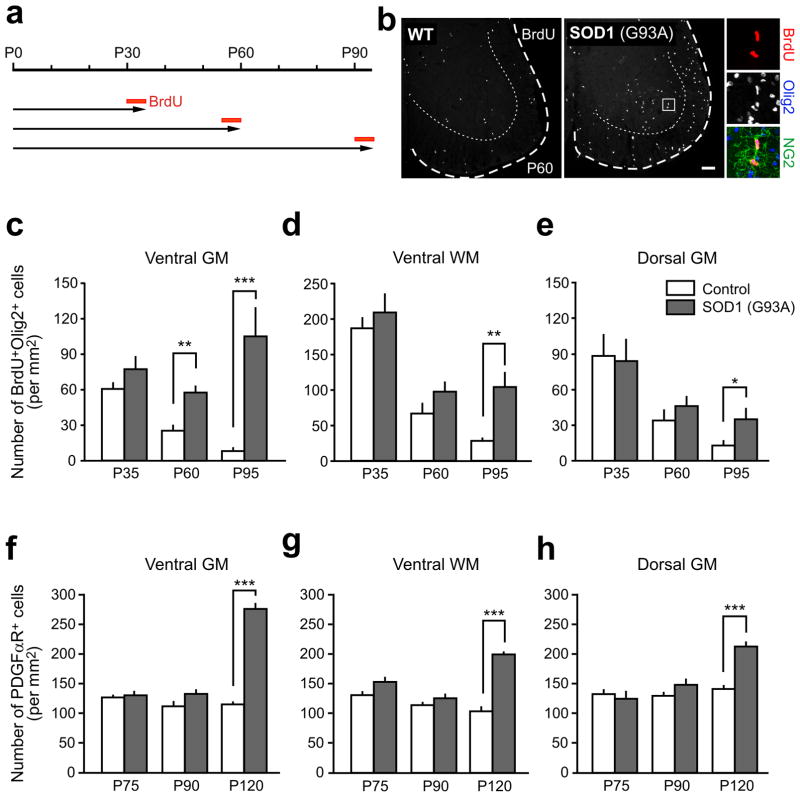
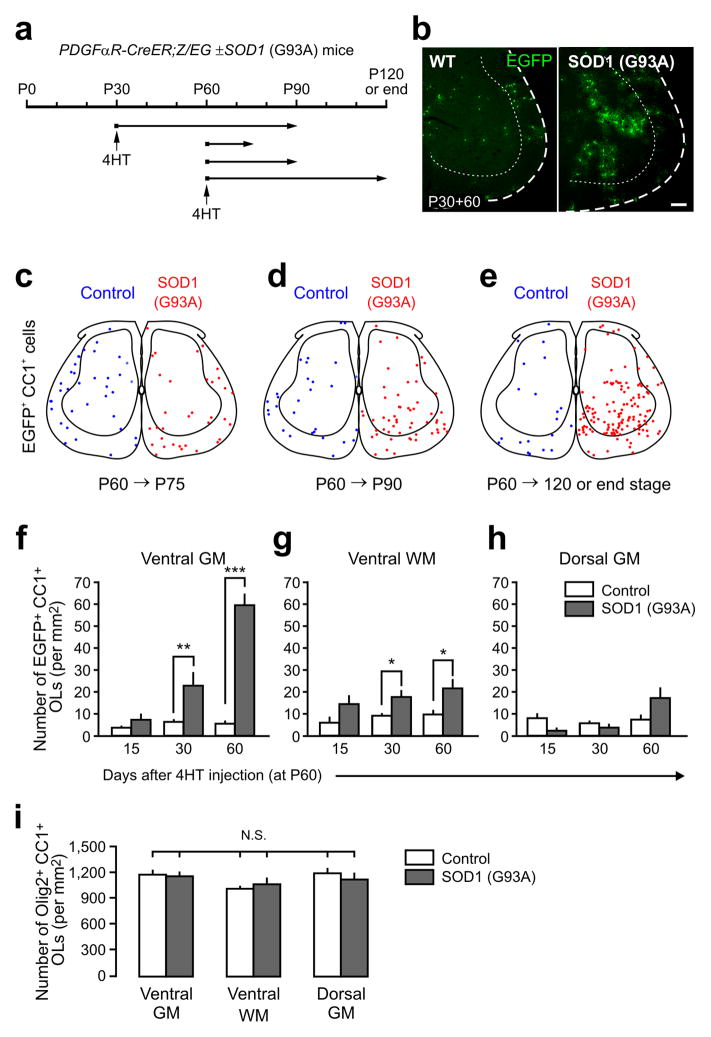
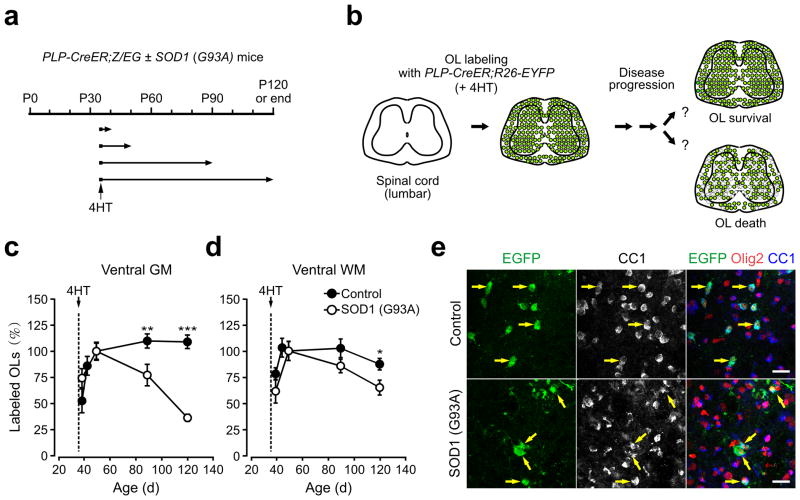
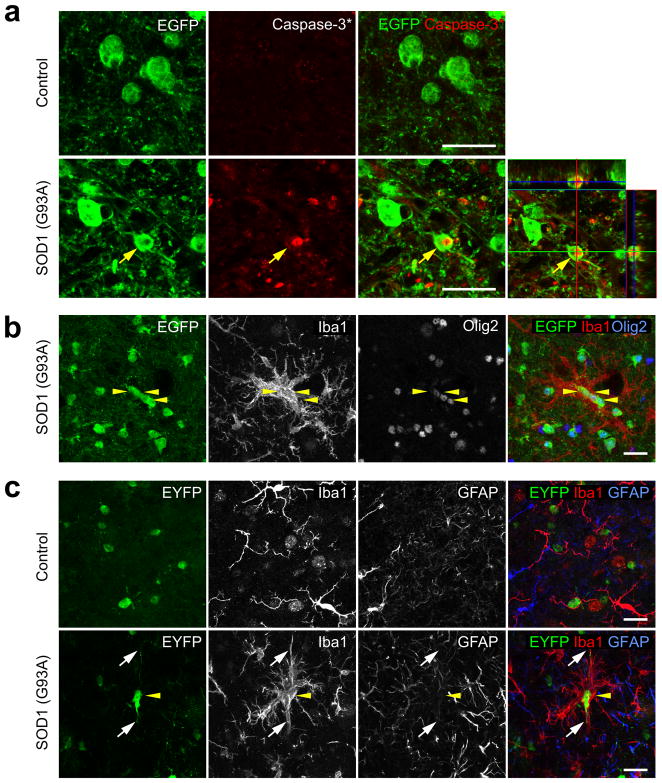
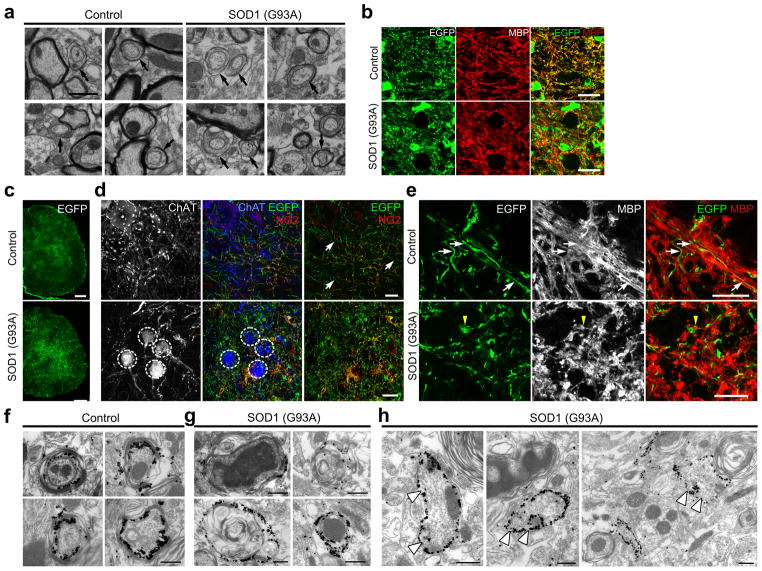
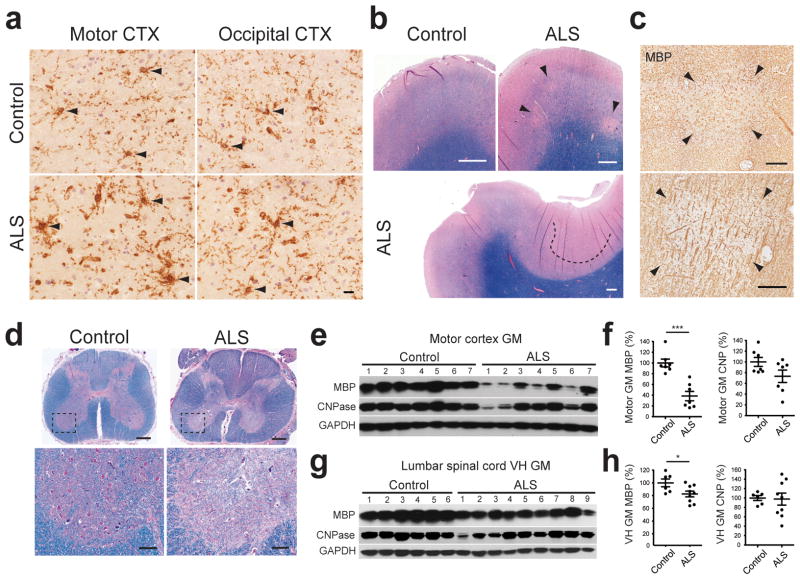
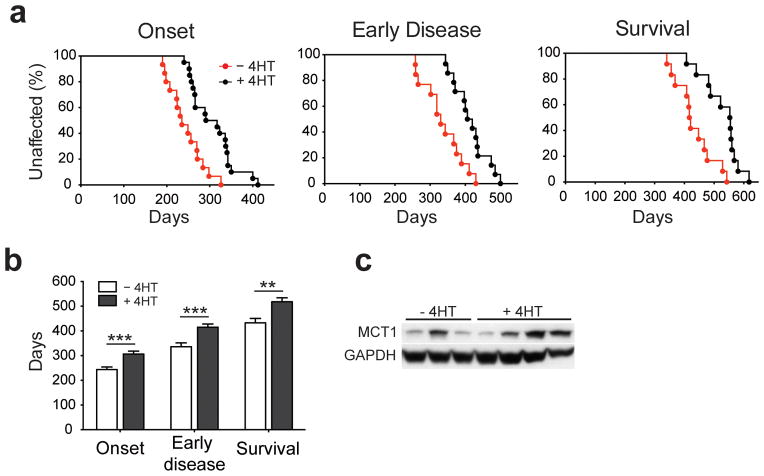
Oligodendrocytes associate with axons to establish myelin and provide metabolic support to neurons. In the spinal cord of amyotrophic lateral sclerosis (ALS) mice, oligodendrocytes downregulate transporters that transfer glycolytic substrates to neurons and oligodendrocyte progenitors (NG2(+) cells) exhibit enhanced proliferation and differentiation, although the cause of these changes in oligodendroglia is unknown. We found extensive degeneration of gray matter oligodendrocytes in the spinal cord of SOD1 (G93A) ALS mice prior to disease onset. Although new oligodendrocytes were formed, they failed to mature, resulting in progressive demyelination. Oligodendrocyte dysfunction was also prevalent in human ALS, as gray matter demyelination and reactive changes in NG2(+) cells were observed in motor cortex and spinal cord of ALS patients. Selective removal of mutant SOD1 from oligodendroglia substantially delayed disease onset and prolonged survival in ALS mice, suggesting that ALS-linked genes enhance the vulnerability of motor neurons and accelerate disease by directly impairing the function of oligodendrocytes.


Conflict of interest statement

Competing financial interests

The authors declare that they have no competing financial interests.

Figures

Figure 1
Figure 1
Enhanced proliferation of NG2+ cells in the spinal cord of pre-symptomatic ALS mice. (a) BrdU protocol used to assess proliferation of NG2+ cells in control and SOD1 (G93A) mice. (b) Fluorescence images showing BrdU+ cells in the ventral horn of the spinal cord in control and SOD1 (G93A) mice at P60. Panels at right show two BrdU+ NG2+ cells in the ventral gray matter. Scale bar: 100 μm. (c – e) Graphs showing the density of proliferating oligodendrocyte lineage cells (BrdU+Olig2+) in different regions of spinal cord at different ages in control (white bars) and SOD1 (G93A) (gray bars) mice. (f – h) Graphs showing the density of NG2+ cells (PDGFαR+) in different regions of the spinal cord at different stages of disease (P75 (pre-symptomatic), P90 (symptomatic), and P120 (end stage)), as compared to wild type mice. GM, gray matter; WM, white matter. Mean + s.e.m. (n = 9 sections obtained from 3 mice per group), *P < 0.05, ** P < 0.001, *** P < 0.0005, unpaired Student’s t-test.
Figure 2
Figure 2
Enhanced oligodendrogenesis in the spinal cord gray matter of adult ALS mice. (a) Protocol used to trace the fate of NG2+ cells in PDGFαR-CreER;Z/EG ± SOD1 (G93A) mice. Cohorts of NG2+ cells were labeled with EGFP by 4HT injection at P30 or P60 then analyzed at different ages. (b) Fluorescence images showing EGFP+ NG2+ cell progeny in the ventral horn of the spinal cord in control or SOD1 (G93A) mice 60 days after 4HT administration at P30 (P30+60). Scale bar: 100 μm. (c – e) Maps of the location of adult born oligodendrocytes generated from NG2+ cells in the spinal cord of control (blue circles) or SOD1 (G93A) mice (red circles), from P60 to P75 (c), from P60 to P90 (d), or from P60 to P120 (or end stage for ALS mice) (e). Oligodendrocytes (EGFP+CC1+) in four randomly sampled lumbar spinal cord sections from each group (from 3–4 mice) are shown. (f – h) Graphs showing the density of newly generated EGFP+ CC1+ oligodendrocytes in different regions of the adult spinal cord from control (white bars) and SOD1 (G93A) mice (gray bars). Mean + s.e.m. (n = 9 sections from 3 mice per group) * P < 0.05, ** P < 0.001, *** P < 0.0005, unpaired Student’s t test. i) Graph showing the overall density of oligodendrocytes (Olig2+CC1+) in different regions of the spinal cord of P120 and end stage SOD1 (G93A) mice. Mean + s.e.m. (n = 12 sections per group from 4 mice per group) N.S., non-significant, one-way ANOVA with Tukey test.
Figure 3
Figure 3
Progressive degeneration of oligodendrocytes in the spinal cord ventral gray matter of ALS mice. (a) Protocol used to track the fate of early-born oligodendrocytes. Littermate control and SOD1 (G93A) expressing PLP-CreER;ROSA26-EYFP mice received 4HT (2 mg) at P35 and were analyzed at P40, P50, P90 and P120 (or end stage for ALS mice). (b) Schematic showing the rationale and possible outcomes of oligodendrocyte fate analysis. (c,d) Plot of the number of EYFP+ oligodendrocytes (CC1+Olig2+) in ventral gray mater (GM) (c) and ventral white matter (WM) (d) of PLP-CreER;ROSA26-EYFP ± SOD1 (G93A) mice, expressed relative to the number observed at P35+15 (P50). Note that control group had additional time point (P35+10). Means ± s.e.m. (n = 9 sections from 3 mice per each time point of each group). * P < 0.05, ** P < 0.001, *** P < 0.0005. Unpaired Student’s t-test was used to compare mean values between control and SOD1 (G93A) mice at each time point. One-way ANOVA with Tukey test was used for age-dependent relative changes in EYFP+ oligodendrocytes in each group. (e) Confocal images showing the density and morphology of EYFP+ (stained with anti-EGFP antibody) CC1+Olig2+ spinal cord oligodendrocytes (yellow arrows) in ventral gray matter at P120 (control) or at end stage SOD1 (G93A) mice. Scale bars: 20μm.
Figure 4
Figure 4
Apoptosis of oligodendrocytes in the spinal cord of ALS mice. (a) Confocal images from the spinal cord ventral gray matter of a MOBP-EGFP;SOD1 (G93A) mouse at end stage showing an EGFP+ oligodendrocyte (yellow arrow) that was immunopositive for activated caspase-3. Lower right panel is an orthogonal view showing co-localization of activated caspase-3 and EGFP. (b,c) Confocal images of the spinal cord ventral gray matter showing Iba1+ activated microglia surrounding oligodendrocytes labeled with EGFP (b) or EYFP (c) in SOD1 (G93A) expressing MOBP-EGFP (P90) or PLP-CreER;ROSA26-EYFP (P30+60) mice, respectively. Yellow arrowheads highlight several labeled oligodendrocytes, and white arrows in (c) highlight the processes of one EYFP+ oligodendrocyte. Scale bars: 20 μm.
Figure 5
Figure 5
Early disruption of oligodendrocyte structure in the spinal cord of ALS mice. (a,b) Confocal images of EGFP+ structures in the ventral spinal cord gray matter from control MOBP-EGFP (P120) and MOBP-EGFP;SOD1 (G93A) mice (end stage). Panels in (b) show regions highlighted by white squares in (a). Arrowheads indicate large EGFP+ structures that were Olig2 and CC1. Scale bars: 20 μm. (c) Measured volume of Olig2 EGFP+ fragments in each 250,000 μm3 imaged volume. Mean + s.e.m. (n = 6 – 9 sections from 3 mice per group) ** P = 1.5 × 10⁻⁵, *** P = 8 × 10⁻⁶, unpaired Student’s t-test.
Figure 6
Figure 6
Myelin abnormalities and impaired maturation of adult-born oligodendrocytes in the spinal cord of ALS mice. (a) Electron micrographs of ventral gray matter spinal cord of control (P120) and SOD1 (G93A) mice at end stage. Arrows highlight partially myelinated axons. Note the presence of thick oligodendrocyte cytoplasm surrounding these axons. (b) Confocal images of MBP immunoreactivity in ventral gray matter of P120 MOBP-EGFP mice or end stage MOBP-EGFP;SOD1 (G93A) mice. Optical sections: 1.5 μm. (c) Fluorescent images of membrane-anchored EGFP in the spinal cord of PDGFαR-CreER;ROSA26-mEGFP mice (P60+60). (d) Confocal images showing fine EGFP+ processes of adult-born oligodendrocytes in ventral gray matter of PDGFαR-CreER;ROSA26-mEGFP ± SOD1 (G93A) mice (P60+60). Circles indicate ChAT+ motor neuron cell bodies and white arrows indicate NG2 oligodendrocyte processes. (e) Confocal images showing co-localization of EGFP+ thin processes and MBP immunoreactivity (white arrows) in control PDGFαR-CreER; ROSA26-mEGFP mice (P60+60) (upper images). MBP immunoreactivity was more disorganized in PDGFαR-CreER; ROSA26-mEGFP mice;SOD1 (G93A) mice (lower panel) and rarely co-localized with EGFP+ processes (P60+60) (yellow arrowhead). Optical sections: 0.5 μm. (f–h) Thin section electron micrographs from PDGFαR-CreER;ROSA26-mEGFP ± SOD1 (G93A) mice at P60+60 showing silver-intensified gold labeling of EGFP+ oligodendrocyte processes. Large, non-myelinating EGFP+ structures (arrowheads) reminiscent of apoptotic bodies were observed frequently in SOD1 (G93A) mice (h). Scale bars: 1μm (a), 20 μm (b, d, e), 200 μm (c), 500 nm (f–h).
Figure 7
Figure 7
Demyelination in gray matter regions of the motor cortex and spinal cord in human ALS. (a) Sections of motor cortex gray matter from control and ALS patients showing immunoreactivity to NG2. NG2+ cells are highlighted by arrowheads. See NG2/Iba1 co-immunostained images in Supplementary Fig. 8a. Images were acquired from cortical layers IV and V. Scale bars: 20 μm. (b) Luxol fast blue staining of motor cortices from control subjects and ALS patients. Demyelinated lesions are highlighted by arrowheads (upper right panel) or a dashed line (lower panel). (c) MBP immunoreactivity in ALS motor cortex. Adjacent sections to those shown in the upper right and lower panels in (b) were used. Images show demyelinated plaques in layer III (upper panel) and layer V (lower panel). (d) Sections of lumbar spinal cord from an ALS patient stained with Luxol fast blue showing demyelination in the ventral horn gray matter and lateral corticospinal tract (arrowhead). Lower panels are higher magnification images of the boxed regions in the upper panels. Scale bars: 1 mm (b,d upper panels); 200 μm (c,d lower panels). (e, g) Western blots of oligodendrocyte lineage-specific myelin proteins in motor cortex gray matter (e) and lumbar spinal cord ventral horn grey matter (g) from controls and ALS patients. Full-length blots are presented in Supplementary Fig. 11. (f, h) Graphs of MBP and CNPase protein expression levels (measured by Western blot) in the motor cortex (f) and lumbar spinal cord ventral horn (h) gray matter in controls and ALS patients, normalized to average value in controls. Mean ± s.e.m. with individual values. * P < 0.05, *** P < 0.0001, unpaired Student’s t-test.
Figure 8
Figure 8
Excision of mutant SOD1 (G37R) from NG2+ cells delays disease onset and prolongs survival in ALS mice. (a) Plots of disease onset (median, −4HT: 235 d (n = 15); +4HT: 304 d (n = 20), P = 0.0003, Log-Rank test), early disease (median, −4HT: 330 d (n = 13); +4HT: 413 d (n = 14), P = 0.001), and survival (median, −4HT: 419 d (n = 12); +4HT: 554 d (n = 14), P = 0.0005) of PDGFαR-CreER;loxSOD1 (G37R) mice. (b) Comparison of mean age at disease onset (−4HT: 244 ± 10 d; +4HT: 307 ± 11 d, P = 0.0005), early disease (−4HT: 336 ± 16 d; +4HT: 415 ± 13 d, P = 0.001) and survival (−4HT: 433 ± 18 d; +4HT: 518 ± 16 d, P = 0.0025,). Mean + s.e.m. ** P < 0.01; *** P < 0.005, Mann Whitney test. (c) Western blots of MCT1 expression from several −4HT and +4HT mice examined at disease onset. Full-length blots are presented in Supplementary Fig. 11.

Comment in

References

    1. Clement AM, et al. Wild-type nonneuronal cells extend survival of SOD1 mutant motor neurons in ALS mice. Science. 2003;302:113–117. - PubMed
    1. Boillee S, et al. Onset and progression in inherited ALS determined by motor neurons and microglia. Science. 2006;312:1389–1392. - PubMed
    1. Yamanaka K, et al. Astrocytes as determinants of disease progression in inherited amyotrophic lateral sclerosis. Nat Neurosci. 2008;11:251–253. - PMC - PubMed
    1. Ilieva H, Polymenidou M, Cleveland DW. Non-cell autonomous toxicity in neurodegenerative disorders: ALS and beyond. J Cell Biol. 2009;187:761–772. - PMC - PubMed
    1. Kang SH, Fukaya M, Yang JK, Rothstein JD, Bergles DE. NG2+ CNS glial progenitors remain committed to the oligodendrocyte lineage in postnatal life and following neurodegeneration. Neuron. 2010;68:668–681. - PMC - PubMed

Publication types

MeSH terms

Substances