. 2013 Aug;38(9):1770-9.
doi: 10.1038/npp.2013.76. Epub 2013 Mar 29.

Prefrontal cortical kappa-opioid receptor modulation of local neurotransmission and conditioned place aversion

Affiliations

Prefrontal cortical kappa-opioid receptor modulation of local neurotransmission and conditioned place aversion

Hugo A Tejeda et al. Neuropsychopharmacology. 2013 Aug.

Abstract

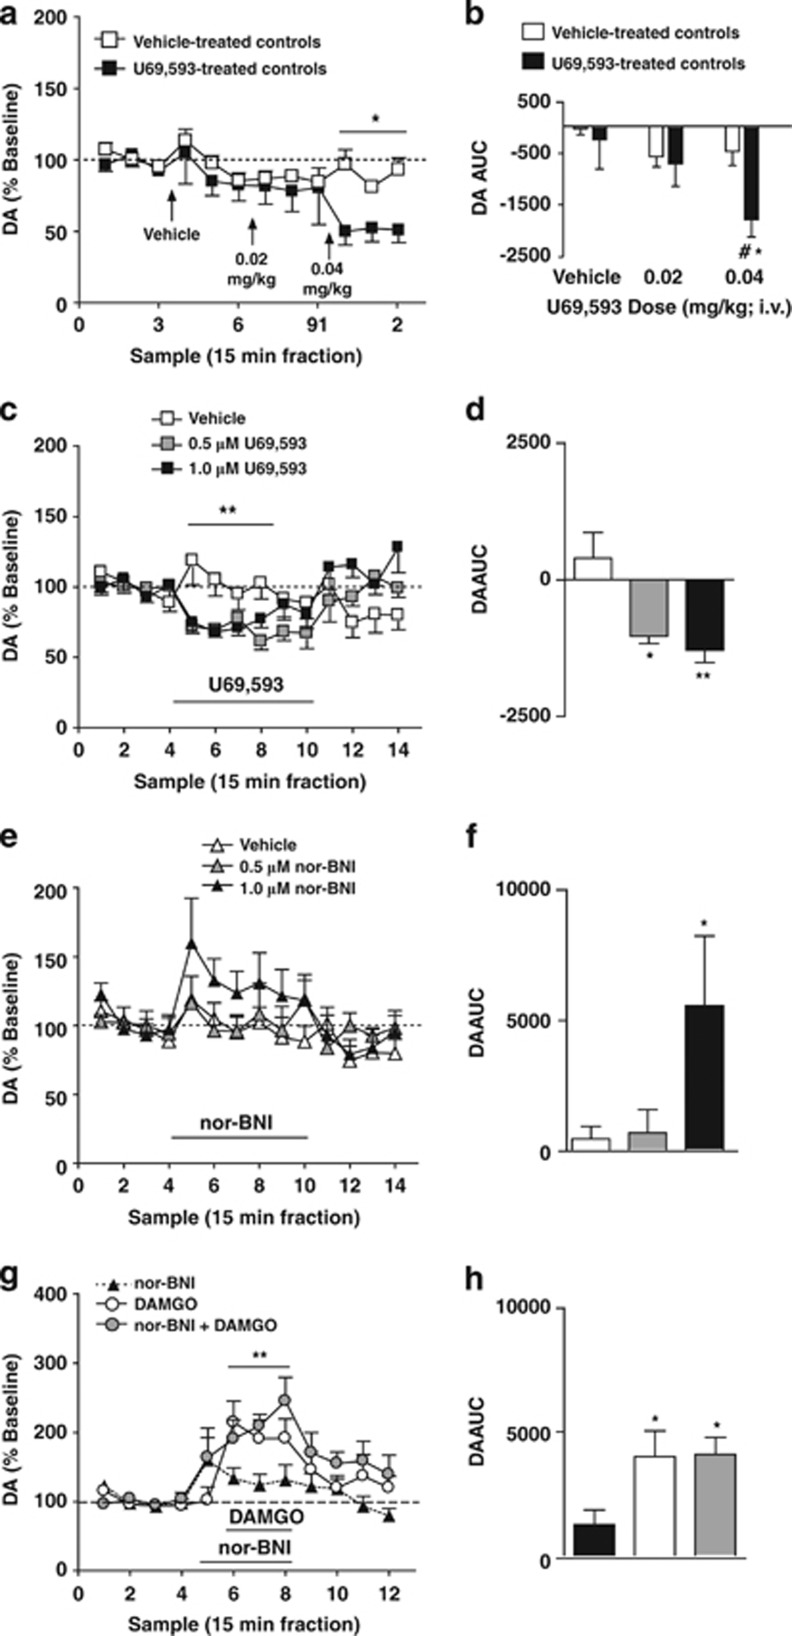
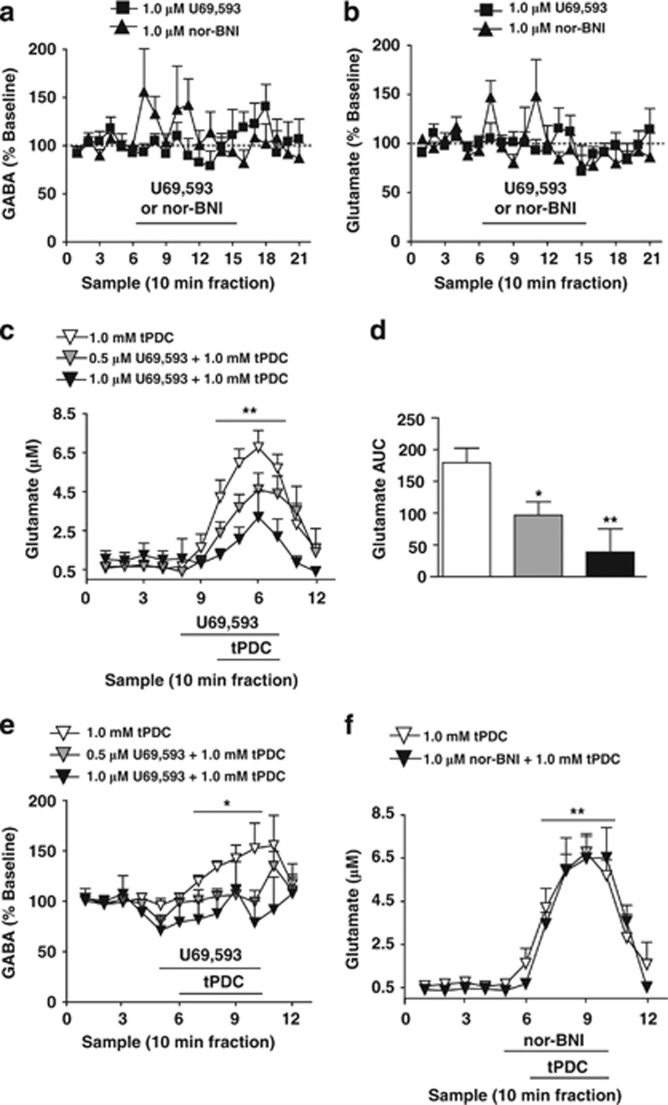
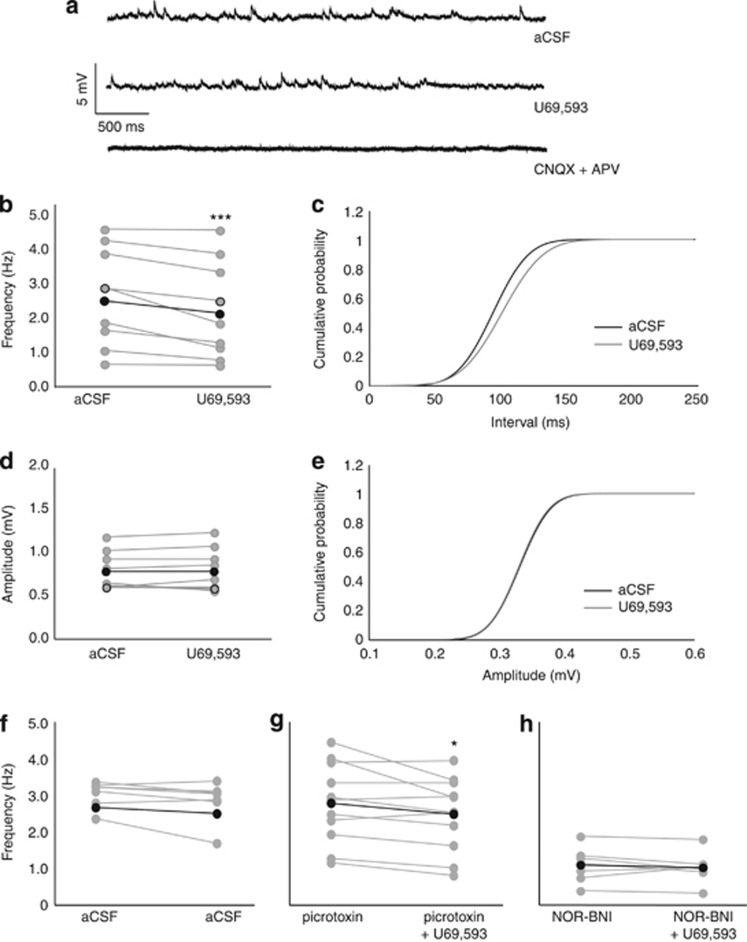
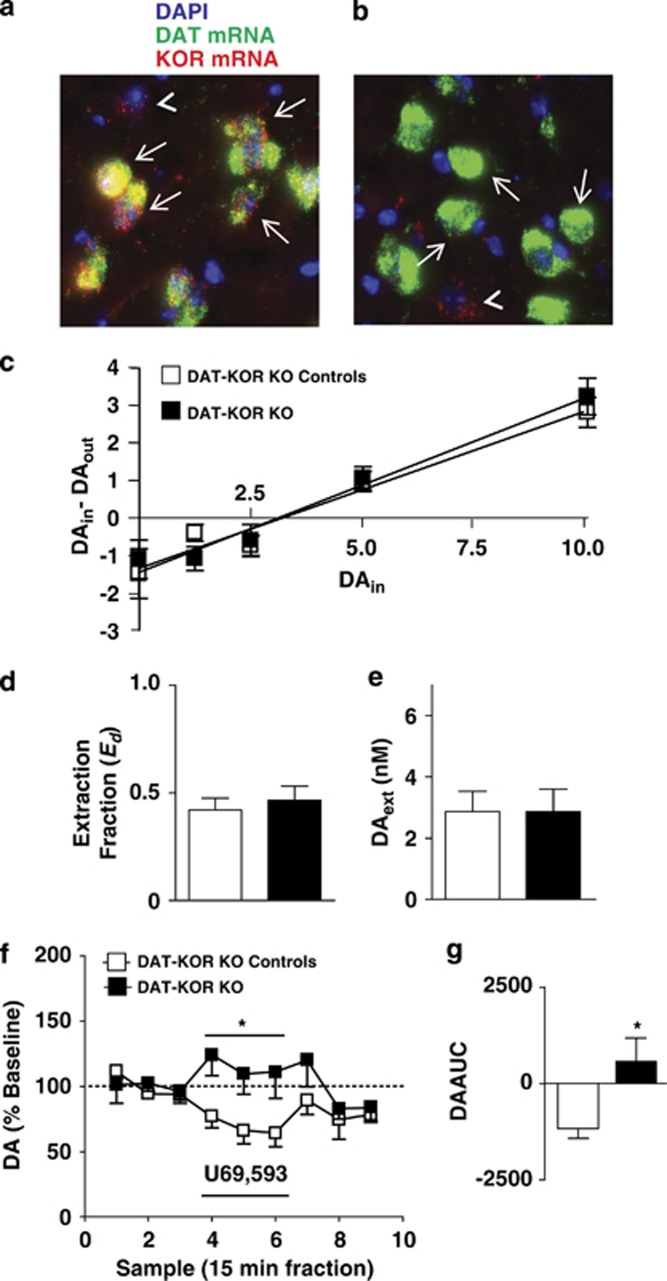
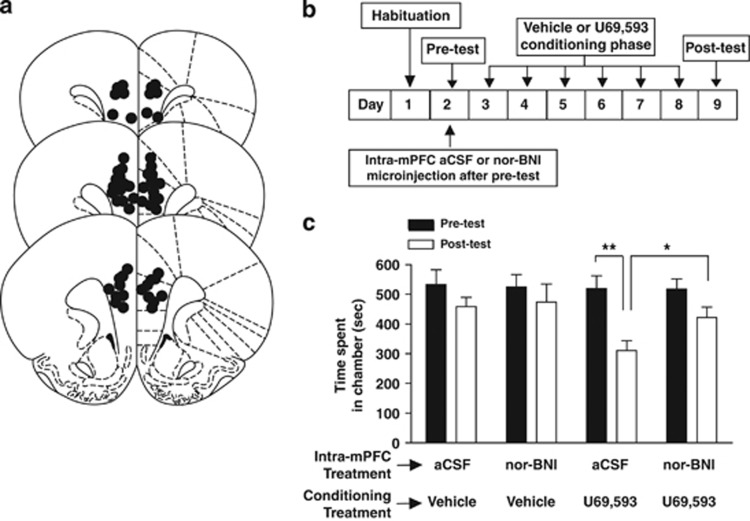
Kappa-opioid receptors (KORs) are important for motivation and other medial prefrontal cortex (mPFC)-dependent behaviors. Although KORs are present in the mPFC, their role in regulating transmission in this brain region and their contribution to KOR-mediated aversion are not known. Using in vivo microdialysis in rats and mice, we demonstrate that intra-mPFC administration of the selective KOR agonist U69,593 decreased local dopamine (DA) overflow, while reverse dialysis of the KOR antagonist nor-Binaltorphimine (nor-BNI) enhanced mPFC DA overflow. Extracellular amino-acid levels were also affected by KORs, as U69,593 reduced glutamate and GABA levels driven by the glutamate reuptake blocker, l-trans-pyrrolidine-2,4-dicarboxylate. Whole-cell recordings from mPFC layer V pyramidal neurons revealed that U69,593 decreased the frequency, but not amplitude, of glutamatergic mini EPSPs. To determine whether KOR regulation of mPFC DA overflow was mediated by KOR on DA terminals, we utilized a Cre recombinase-driven mouse line lacking KOR in DA neurons. In these mice, basal DA release or uptake was unaltered relative to controls, but attenuation of mPFC DA overflow by local U69,593 was not observed, indicating KOR acts directly on mPFC DA terminals to locally inhibit DA levels. Conditioning procedures were then used to determine whether mPFC KOR signaling was necessary for KOR-mediated aversion. U69,593-mediated conditioned place aversion was blocked by intra-mPFC nor-BNI microinjection. These findings demonstrate that mPFC KORs negatively regulate DA and amino-acid neurotransmission, and are necessary for KOR-mediated aversion.


Figures

Figure 1
Figure 1
mPFC KORs tonically inhibit local DA overflow. (a) Time course of mPFC dialysate DA levels after repeated challenge with systemic administration of vehicle (open squares; n=7) or escalating doses of U69,593 (filled squares; n=7). Vertical arrows depict the time of vechicle or U69,593 (0.02 mg/kg then subsequently 0.04 mg/kg). *Reflects a significant sample-type x treatment interaction. (b) AUC values of DA levels after vehicle or U69,593 challenge in control (open bars) and U69,593-treated (filled bars) groups. *and #reflect a significant difference from baseline and from vehicle controls after intravenous administration of 0.04 mg/kg at that corresponding time point, respectively. (c) Time course of mPFC dialysate DA levels after reverse dialysis administration of vehicle (white squares; n=8), 0.5 μM U69,593 (gray squares; n=8), or 1.0 μM U69,593 (black squares; n=8). **Reflects a significant sample-type x treatment interaction. (d) AUC values of DA levels after vehicle or U69,593 challenge. *and **reflect a significant difference from vehicle controls. (e) Time course of mPFC dialysate DA levels after reverse dialysis administration of vehicle (white triangles; n=8), 0.5 μM nor-BNI (gray triangles; n=7), or 1.0 μM nor-BNI (black triangles; n=6). (f) AUC values of DA levels after vehicle or nor-BNI challenge. *Reflects a significant difference from vehicle controls. (g) Time course of mPFC DA overflow after reverse dialysis administration of 1.0 μM nor-BNI (black triangles; n=6), 100 μM DAMGO (white squares; n=6), or 100 μM DAMGO/1.0 μM nor-BNI (black squares; n=8). **Reflects a main effect of sample-type. (h) AUC values of DA overflow after nor-BNI and/or DAMGO challenge. *Reflects a significant difference from rats challenged with nor-BNI alone. (a, c, e, g) Abscissa, microdialysis fractions (15 min). Data points reflect the mean±SEM. Black bar depicts period of infusion of the indicated drug.
Figure 2
Figure 2
mPFC KORs inhibit tPDC-evoked elevations in extracellular glutamate and glutamate-driven enhancements in extracellular GABA in rats. (a) Time course of basal mPFC extracellular GABA levels after reverse dialysis administration of 1.0 μM U69,593 (filled squares; n=10) or 1.0 μM nor-BNI (filled triangles; n=6). (b) Time course of mPFC basal dialysate glutamate levels after reverse dialysis administration of 1.0 μM U69,593 (filled squares; n=10) or 1.0 μM nor-BNI (filled triangles; n=6). (c) Time course of mPFC extracellular glutamate levels in response to local administration of tPDC in rats pretreated with vehicle (white triangles; n=8), 0.5 μM U69,593 (gray triangles; n=8), or 1.0 μM U69,593 (black triangles; n=4). **Reflects a significant sample-type x treatment interaction. (d) AUC values of tPDC-evoked elevations in dialysate glutamate levels after vehicle, 0.5 μM U69,593, or 1.0 μM U69,593 pretreatment. *and **reflect a significant difference from vehicle controls. (e) Time course of mPFC GABA dialysate levels in response reverse dialysis of tPDC in animals pretreated with vehicle (white triangles; n=8), 0.5 μM U69,593 (gray triangles; n=8), or 1.0 μM U69,593 (black triangles; n=4). *Reflects a significant sample-type x treatment interaction. (f) Time course of mPFC extracellular glutamate levels in response to local administration of tPDC in rats pretreated with vehicle (white triangles; n=8) or 1.0 μM nor-BNI (gray triangles; n=6). Data points reflect the mean±SEM. Black bar depicts period of infusion of the indicated drug.
Figure 3
Figure 3
mPFC KORs inhibit presynaptic glutamate release in rats. (a) Representative trace depicting glutamatergic CNQX/APV-sensitive mEPSPs before (top) and after (middle) bath application of U69,593 (1.0 μM). CNQX/APV bath application abolished the presence of all mEPSPs (bottom). (b, c) mEPSP frequency, but not amplitude (d, e) is decreased after U69,593 application in the presence of physiological aCSF (n=9 cells from four animals). ***Reflect a significant difference in mEPSP frequency after U69,593 application relative to baseline. Open circles indicate example trace. Black circles indicate the mean. (f) These effects are not observed in cells treated with physiological aCSF (n=7 cells from two animals). (g) In the presence of picrotoxin, U69,593 similarly decreases mEPSP frequency (n=11 cells from five animals). *Reflect a significant difference in mEPSP frequency after U69,593 application relative to baseline. (h) Nor-BNI (0.1 μM) pretreatment blocks U69,593-induced decreases in mEPSP frequency (n=7 cells from three animals) in the presence of normal aCSF.
Figure 4
Figure 4
mPFC KOR activation inhibits local extracellular DA levels via direct activation KORs on DA varicosities in mice. (a, b) Representative images of dual fluorescence in situ hybridization of DAT mRNA (green) and KOR mRNA (red) in the VTA of a control (a) and DAT-KOR KO (b) mouse. Blue, green, and red signals represent DAPI nucleic acid stain, DAT mRNA, and KOR mRNA, respectively. Arrows indicate cells expressing DAT mRNA. DAT-positive neurons co-express KOR mRNA in control animals (a). As predicted DAT-positive neurons do not express KOR mRNA in DAT-KOR KO mice (b). Additionally, KOR mRNA was present in DAT-negative neurons in both control and KO animals (arrowheads in a, b). (c) DAin-DAout plotted against DAin with fitted regression lines for control (open squares; n=9) and DAT-KOR KO (filled squares; n=9) mice depicting similar x intercepts (DAext) and slopes (Ed). (d) Ed (an indirect measure of DA uptake) in control (open bar) and DAT-KOR KO (filled bar) mice. (e) mPFC DAext in control (open bar) and DAT-KOR KO (filled bar) mice. (f) Time course of mPFC dialysate DA levels after reverse dialysis administration of 1.0 μM U69,593 in control (open squares; n=6) and DAT-KOR KO (filled squares; n=5) mice. *Reflects a significant sample-type x-treatment interaction. (g) AUC values of DA levels after 1.0 μM U69,593 challenge in control (open bar) and DAT-KOR KO (filled bar) mice. *Reflects a significant difference from control mice. Data points reflect the mean±SEM. Black bar depicts period of infusion of the indicated drug.
Figure 5
Figure 5
mPFC KOR signaling is necessary for KOR-mediated CPA in rats. (a) Placements of guide cannulae microinjector tips (black dots) in the mPFC. Diagrams were adapted from Paxinos and Watson (1987). (b) Schema depicting CPA procedures. Rats were implanted with guide cannula 4 to 5 days before CPA procedures. In CPA procedures, rats are initially tested for their preference (pre-test). Rats were divided into one of four sub-groups: aCSF/vehicle (n=6), nor-BNI/vehicle (n=6), aCSF/U69,593 (n=9), or nor-BNI/U69,593 (n=12). Rats received intra-mPFC aCSF or nor-BNI (5 μg/0.5 μl) microinjections 3–5 h after CPA pre-test. During the conditioning phase, the initially preferred compartment of the conditioning apparatus is paired with systemic vehicle or U69,593 administration (0.32 mg/kg), while the other compartment is paired with vehicle on the subsequent day. This 2-day procedure is repeated three times over 6 consecutive days of conditioning. Conditioned drug effects are assayed on the post-test day when rats are allowed access to both compartments in a drug-free state. (c) Time spent in the U69,593-paired compartment during the pre-test (black bar) and post-test (white bar) of CPA procedures. **Reflects a significant difference in the time-spent in the U69,593-paired compartment during the post-test relative to the pre-test in rats microinjected with intra-mPFC aCSF. This effect was not observed in rats treated with intra-mPFC nor-BNI that were similarly conditioned with U69,593 and rats that were conditioned with vehicle. *Reflects a significant difference in the time-spent in the U69,593-paired compartment during the post-test between intra-mPFC aCSF-treated and nor-BNI-treated rats. Data points reflect the mean±SEM.

Similar articles

Cited by

References

    1. Backman CM, Malik N, Zhang Y, Shan L, Grinberg A, Hoffer BJ, et al. Characterization of a mouse strain expressing Cre recombinase from the 3′ untranslated region of the dopamine transporter locus. Genesis. 2006;44:383–390. - PubMed
    1. Bals-Kubik R, Ableitner A, Herz A, Shippenberg TS. Neuroanatomical sites mediating the motivational effects of opioids as mapped by the conditioned place preference paradigm in rats. J Pharmacol Exp Ther. 1993;264:489–495. - PubMed
    1. Bruchas MR, Land BB, Chavkin C. The dynorphin/kappa opioid system as a modulator of stress-induced and pro-addictive behaviors. Brain Res. 2010;1314:44–55. - PMC - PubMed
    1. Chefer VI, Denoroy L, Zapata A, Shippenberg TS. Mu opioid receptor modulation of somatodendritic dopamine overflow: GABAergic and glutamatergic mechanisms. Eur J Neurosci. 2009;30:272–278. - PMC - PubMed
    1. Chefer VI, Czyzyk T, Bolan EA, Moron J, Pintar JE, Shippenberg TS. Endogenous kappa-opioid receptor systems regulate mesoaccumbal dopamine dynamics and vulnerability to cocaine. J Neurosci. 2005;25:5029–5037. - PMC - PubMed

Publication types

MeSH terms

LinkOut - more resources