. 2013 May;123(5):2155-68.
doi: 10.1172/JCI65780. Epub 2013 Apr 1.

Melanoma adapts to RAF/MEK inhibitors through FOXD3-mediated upregulation of ERBB3

Affiliations

Melanoma adapts to RAF/MEK inhibitors through FOXD3-mediated upregulation of ERBB3

Ethan V Abel et al. J Clin Invest. 2013 May.

Abstract

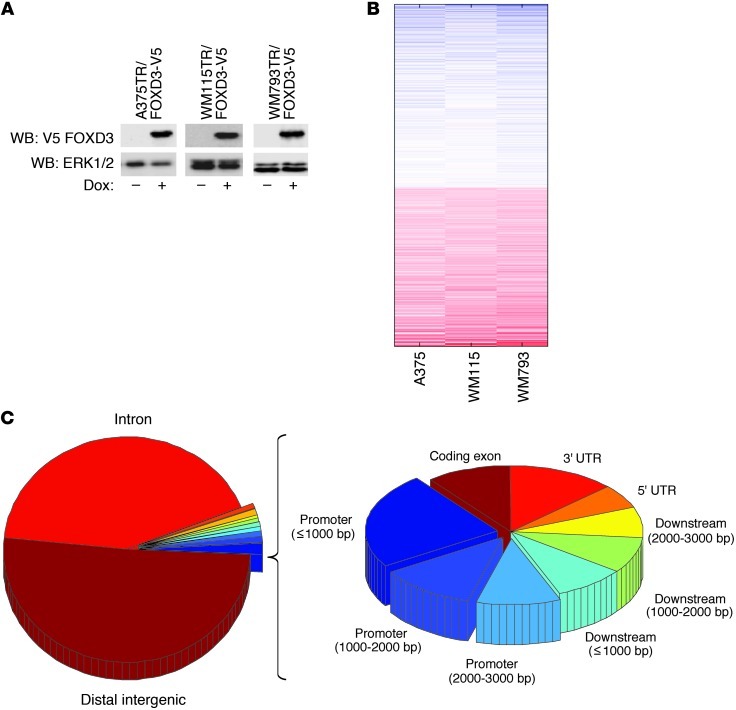
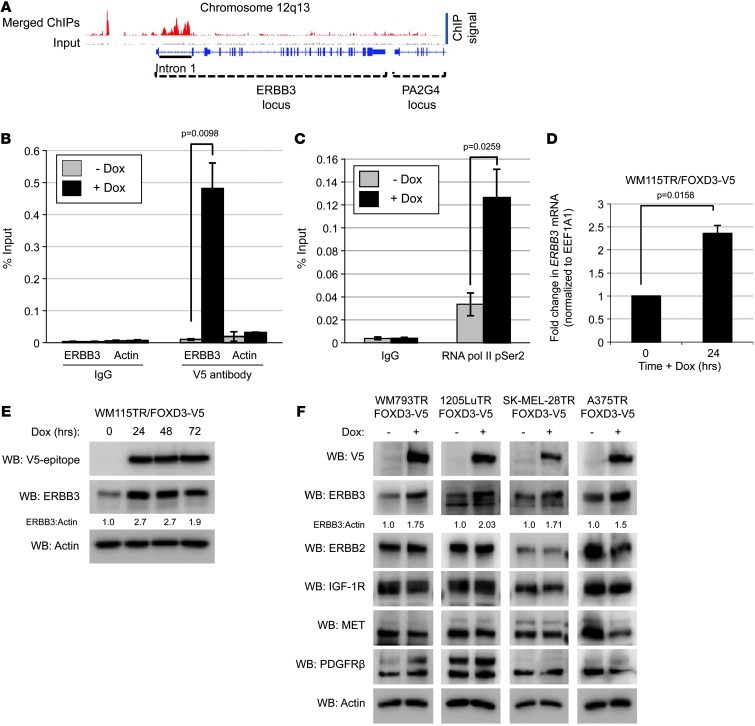
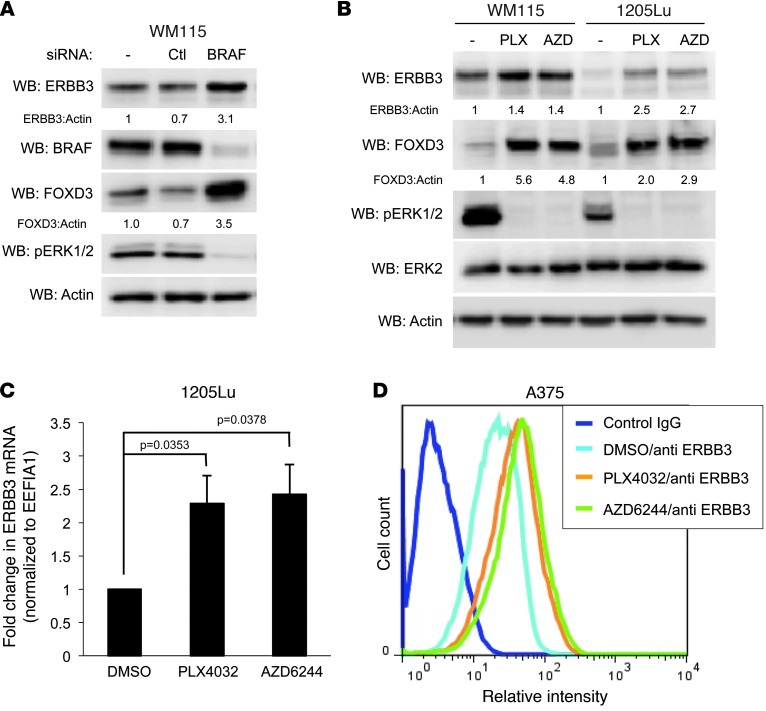
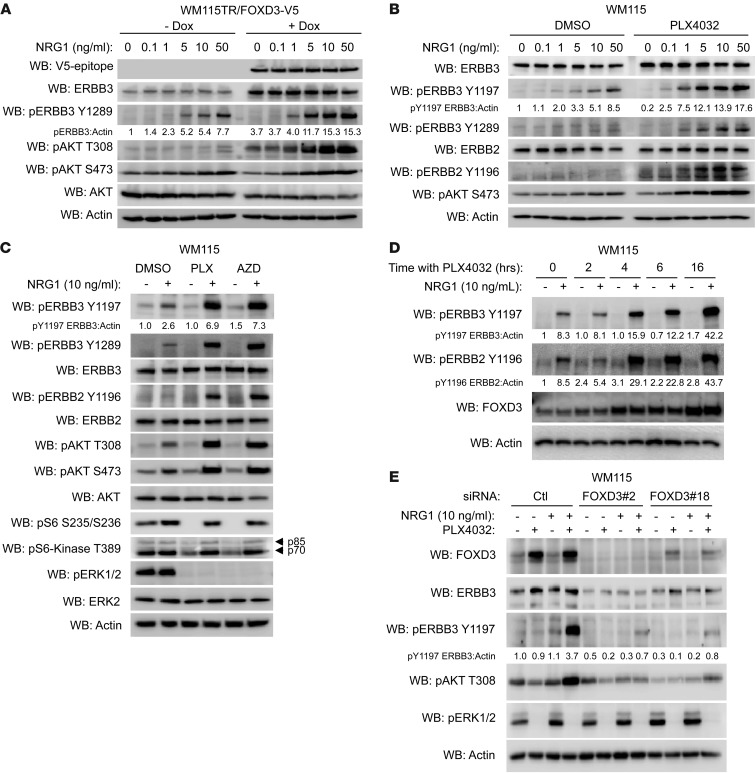
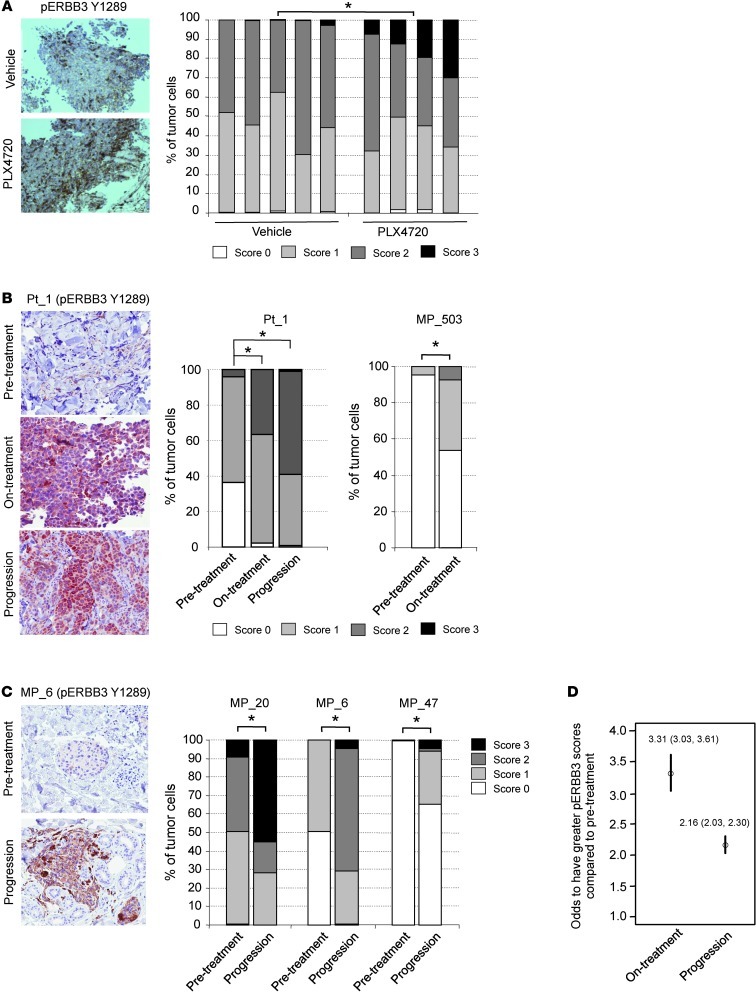
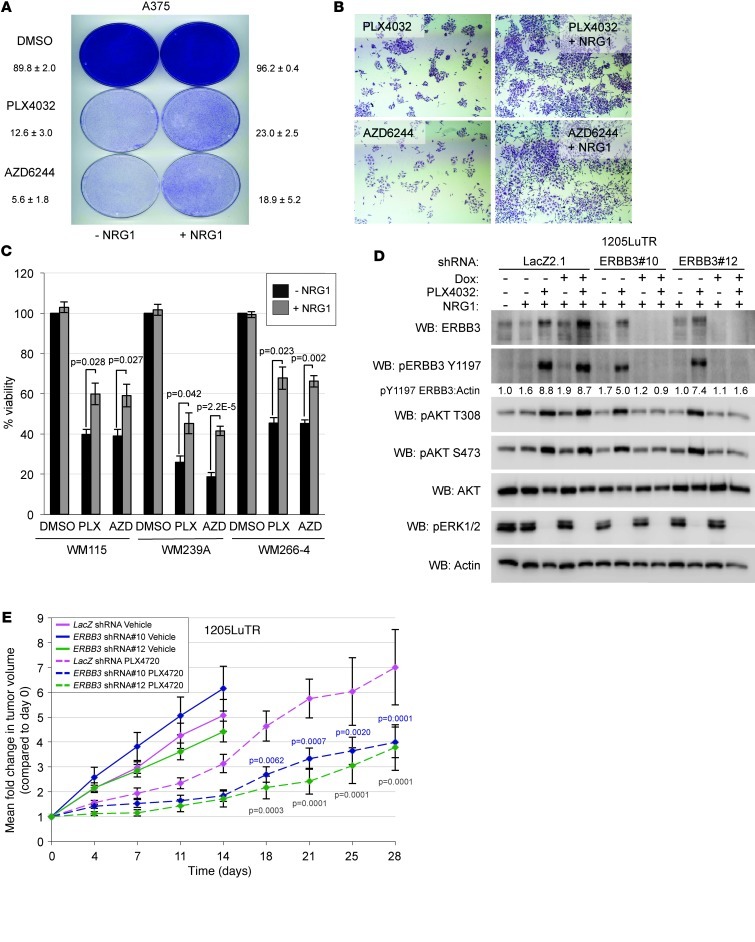
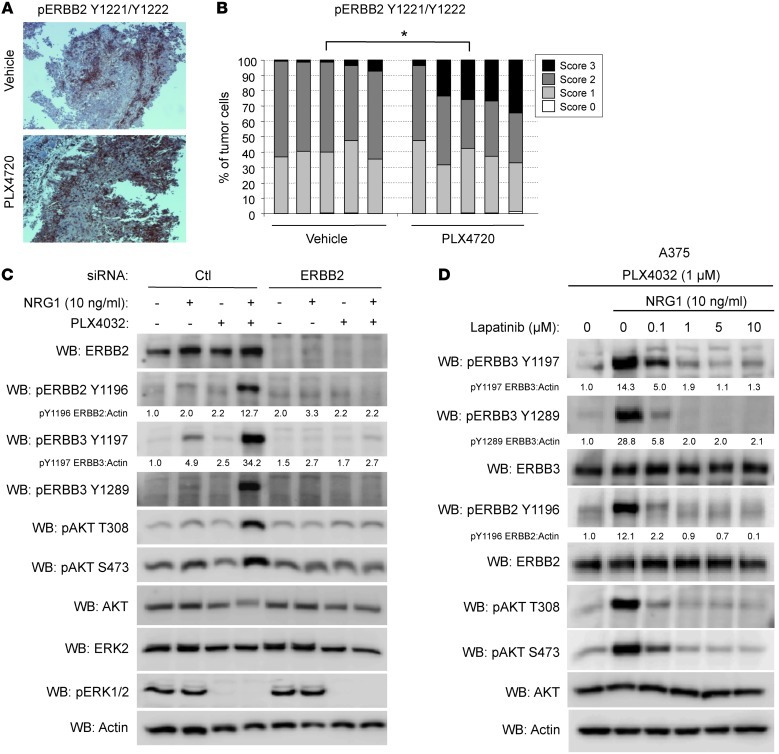
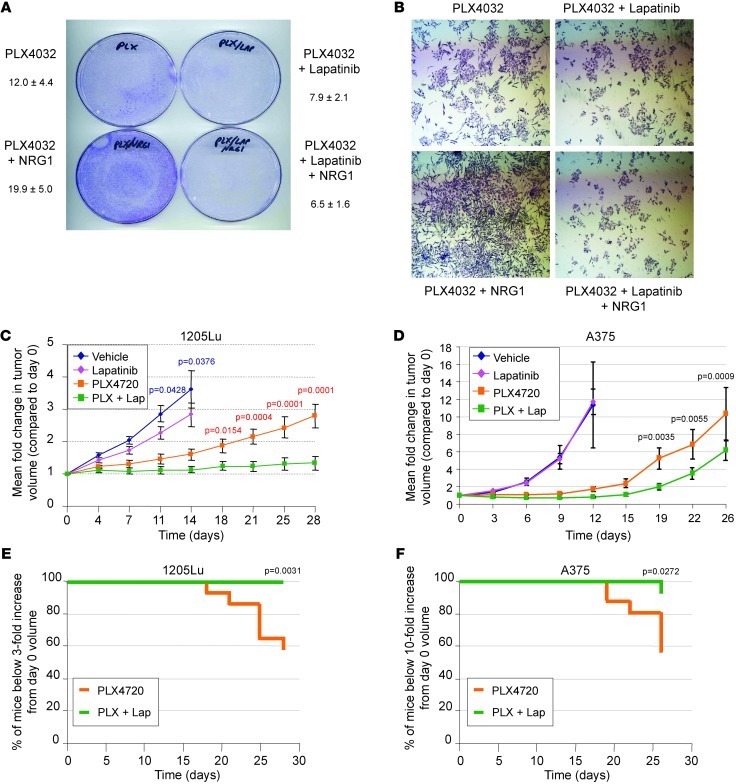
The mechanisms underlying adaptive resistance of melanoma to targeted therapies remain unclear. By combining ChIP sequencing with microarray-based gene profiling, we determined that ERBB3 is upregulated by FOXD3, a transcription factor that promotes resistance to RAF inhibitors in melanoma. Enhanced ERBB3 signaling promoted resistance to RAF pathway inhibitors in cultured melanoma cell lines and in mouse xenograft models. ERBB3 signaling was dependent on ERBB2; targeting ERBB2 with lapatinib in combination with the RAF inhibitor PLX4720 reduced tumor burden and extended latency of tumor regrowth in vivo versus PLX4720 alone. These results suggest that enhanced ERBB3 signaling may serve as a mechanism of adaptive resistance to RAF and MEK inhibitors in melanoma and that cotargeting this pathway may enhance the clinical efficacy and extend the therapeutic duration of RAF inhibitors.


Figures

Figure 1
Figure 1. Microarray and ChIP-seq analysis of FOXD3 target genes.
(A) A375TR, WM115TR, and WM793TR cells expressing Dox-inducible FOXD3 were treated with or without 100 ng/ml Dox overnight. Induced V5-tagged FOXD3 was detected by immunoblotting for V5 and ERK1/2 as a loading control. WB, Western blot. (B) Heat map of common target genes downregulated (blue) or upregulated (red) by expression of FOXD3 compared with cells expressing LacZ. (C) Pie chart representation of the distribution of FOXD3 enrichment foci from ChIP-seq across the genome of WM115TR cells. Data represent 3 independent ChIP experiments compared with a pooled input control.
Figure 2
Figure 2. ERBB3 is a direct transcriptional target of FOXD3.
(A) Map of the ERBB3 locus showing read coverage for IP and input; aligned reads were visualized using the Integrated Genomics Viewer 2.0 (57). Relative signal of merged ChIP experiments is represented by red peaks, while the signal of the pooled inputs is represented with light gray peaks. The intron 1 enhancer region is underlined. (B and C) WM115TR/FOXD3-V5 cells were treated with 100 ng/ml Dox (+ Dox) or without (– Dox) for 24 hours. Cells were lysed, DNA was sheared, and protein/chromatin complexes were IP with normal IgG (B and C), anti-V5 antibody (B), or anti-RNA pol II pSer2 (C). Enrichment of ERBB3 intron 1 was validated by qPCR. Enrichment of the β-actin promoter is included as a control for specificity. Results represent the mean ± SEM (n = 4). P values are indicated. (D) WM115TR/FOXD3-V5 cells were treated with or without Dox for 24 hours. qRT-PCR was performed following RNA extraction. Fold change in ERBB3 transcript was normalized to housekeeping gene EEF1A1. Results represent mean ± SEM (n = 3). P value is indicated. (E) WM115TR/FOXD3-V5 cells were treated with or without Dox (100 ng/ml) for 24, 48, or 72 hours, and then lysed and immunoblotted as indicated. (F) Lysates from WM793TR, 1205LuTR, SK-MEL-28TR, and A375TR expressing FOXD3 for 24 hours were blotted as indicated.
Figure 3
Figure 3. Inhibition of mutant BRAF and MEK1/2 enhances ERBB3 expression in melanoma cells.
(A) WM115 cells were transfected with reagent alone (–), a nontargeting control siRNA (Ctl), or BRAF-targeting siRNA alone (BRAF) for 96 hours. Cells were lysed and immunoblotted as indicated. (B) WM115 and 1205Lu cells were treated overnight with DMSO (–), 1 μM PLX4032 (PLX), or 3.3 μM AZD6244 (AZD), lysed, and immunoblotted as indicated. (C) qRT-PCR analysis of ERBB3 mRNA levels in 1205Lu cells treated with DMSO, PLX4032, or AZD6244 overnight. Housekeeping gene EEF1A1 transcript was used for normalization. Results represent mean ± SEM (n = 4). P values are indicated. (D) Flow cytometry analysis of ERBB3 surface expression in A375 cells treated with DMSO, PLX4032, or AZD6244 overnight.
Figure 4
Figure 4. FOXD3 and RAF/MEK inhibition enhance responsiveness to NRG1β.
(A and B) WM115TR/FOXD3-V5 (A) or WM115 (B) were treated with or without Dox (100 ng/ml) or PLX4032 (1 μM), respectively, for 24 hours followed by treatment with the indicated concentration of NRG1β for 1 hour. Cell lysates were immunoblotted as indicated. (C) WM115 cells were treated overnight with DMSO, PLX4032 (1 μM), or AZD6244 (3.3 μM), followed by 1 additional hour with or without NRG1β (10 ng/ml). Cells were lysed and lysates immunoblotted as indicated. (D) WM115 cells were pretreated with PLX4032 for 0, 2, 4, 6, and 16 hours and then stimulated with NRG1β (10 ng/ml) for 30 minutes. Cell lysates were immunoblotted as indicated. (E) WM115 cells were transfected with either control siRNA or 2 distinct FOXD3-targeting siRNAs for 72 hours. Cells were then treated for an additional 24 hours with PLX4032 (1 μM) or DMSO, after which NRG1β (10 ng/ml) was added for an additional hour to activate ERBB3. Cell lysates were immunoblotted as indicated.
Figure 5
Figure 5. Increased ERBB3 phosphorylation following RAF inhibitor treatment in vivo.
(A) A375 xenografts taken from animals fed vehicle (n = 5) or PLX4720-laced chow (n = 4) for 5 days analyzed by IHC for phospho-ERBB3 (Y1289). Representative images are shown. Original magnification, ×20. The graph shows quantitation of phospho-ERBB3 intensity. Cells were scored by intensity of membrane-associated staining from 0 (no staining) to 3 (strong staining). *P = 0.016. (B) Biopsies from patient taken prior to vemurafenib treatment, on-treatment, or upon disease progression were stained for phospho-ERBB3. Representative images are shown from patient 1 (Pt_1). The graph shows quantitation of cellular staining. Tumor cells in each slide were scored in a blinded manner, and statistical differences among the 3 conditions were analyzed using the cumulative link model (i.e., proportional odds model). The level of phospho-ERBB3 in the on-treatment and progression samples is statistically different from the pretreatment sample (*P < 0.001). The on-treatment biopsies for patient 1 and melanoma patient_503 (MP_503) were taken after 15 days and 16 months, respectively. Original magnification, ×200. (C) ERBB3 phosphorylation was analyzed by immunohistochemical staining of paired pretreatment and progression samples. MP_20 and MP_6 progressed after 6 and 9 months, respectively, on RAF/MEK inhibitor. MP_47 progressed on RAF inhibitor after 7.5 months. Representative images are shown for MP_6. Graphs show quantitation of phospho-ERBB3 intensity staining on scale of 0–3. *P < 0.001. Original magnification, ×200. (D) Statistical analysis across samples from all 9 patients that displayed staining for phospho-ERBB3. Analysis was performed using an ordered logistic regression model with random intercept for each patient.
Figure 6
Figure 6. NRG1β/ERBB3 signaling promotes resistance to RAF/MEK inhibitors.
(A) A375 cells were plated at clonal density and treated with either DMSO, DMSO with NRG1β (10 ng/ml), PLX4032 (1 μM), PLX4032 with NRG1β, AZD6244 (3.3 μM), or AZD6244 with NRG1β. Medium and drugs were replenished every 3 days for 7 days, after which cells were fixed and stained with crystal violet. (B) Magnification of colonies in A (×40). (C) WM115, WM239A, and WM266-4 cells were treated with DMSO, PLX4032 (1 μM), or AZD6244 (3.3 μM) with or without NRG1β (10 ng/ml) for 72 hours, after which AlamarBlue was added to medium for 2 hours. Reduced AlamarBlue as analyzed by spectrophotometer to determine cell viability. DMSO-treated cell groups were set to 100% viable, and all other groups were normalized to these groups. Mean ± SEM (n = 4) and P values are shown. (D) 1205LuTR cells stably expressing Dox-inducible LacZ-targeting (LacZ 2.1) or 2 distinct ERBB3-targeting shRNAs were treated with or without Dox for 5 days, followed by treatment with PLX4032 (+) or DMSO (–) for 24 hours, and finally stimulated with 10 ng/ml NRG1β for 1 hour prior to lysis. Lysates were immunoblotted as indicated. (E) Mean fold change of tumor volume in 1205LuTR xenografts (n = 16 per condition) in nude mice fed either PLX4720 or vehicle-laced chow, expressing either LacZ-targeting or ERBB3-targeting shRNAs. Statistically significant comparisons of the LacZ-targeting and ERBB3-targeting shRNA xenografts are indicated by blue P values (LacZ vs. ERBB3 shRNA#10) or green P values (LacZ vs. ERBB3 shRNA#12).
Figure 7
Figure 7. ERBB2 is required for NRG1β/ERBB3 signaling in melanoma.
(A) Representative images of A375 xenografts taken from animals fed vehicle or PLX4720-laced chow for 5 days analyzed by IHC for phospho-ERBB2 (Y1221/Y1222). Original magnification, ×100. (B) Quantitation of phospho-ERBB2 intensity of tumor cells from vehicle (n = 5) or PLX4720-treated A375 xenografts (n = 5). *P = 0.001. (C) WM115 cells were transfected with control or ERBB2-targeting siRNA for 72 hours, then treated with PLX4720 or DMSO for an additional 24 hours followed by treatment with or without NRG1β (10 ng/ml) for 1 hour, lysed, and immunoblotted as indicated. (D) A375 cells were pretreated for 24 hours with PLX4032 (1 μM) and then treated with or without NRG1β and a dose range of lapatinib for 1 hour, lysed, and immunoblotted as indicated.
Figure 8
Figure 8. Inhibition of ERBB2 ablates NRG1β/ERBB3-mediated growth in vitro and reduces tumor burden in vivo.
(A) A375 cells were plated in the presence of PLX4032 (1 μM) alone or with lapatinib (1 μM), NRG1β (10 ng/ml), or NRG1β combined with lapatinib. Medium and additives were replaced every 3 days, with cells fixed and stained with crystal violet after 7 days. (B) Magnification of colonies in A (×40). (C) Mean fold change ± SEM of tumor volume in 1205Lu xenografts (n = 16 per condition) in nude mice fed either PLX4720 or vehicle chow with or without daily lapatinib (100 mg/kg) by oral gavage. Statistically significant comparisons of the vehicle and lapatinib monotherapy groups are indicated by blue P values, whereas statistically significant comparisons of the PLX4720 monotherapy and PLX4720/lapatinib (PLX + Lap) combined therapy groups are indicated by red P values. (D) Mean fold change ± SEM of tumor volume in A375 xenografts (n = 16 per condition) in nude mice fed either PLX4720 or vehicle-laced chow with or without daily lapatinib (100 mg/kg) by oral gavage. Statistically significant comparisons of the PLX4720 monotherapy and PLX4720/lapatinib combined therapy groups are indicated by their respective P values. (E) Kaplan-Meier plot showing time to 3-fold increase in initial tumor volume of 1205Lu xenografts following treatment with PLX4720 chow alone or with lapatinib (100 mg/kg). P value is indicated. (F) Kaplan-Meier plot showing time to 10-fold increase in initial tumor volume of A375 xenografts following treatment with PLX4720 chow alone or with lapatinib (100 mg/kg). P value is indicated.

References

    1. Satyamoorthy K, et al. Constitutive mitogen-activated protein kinase activation in melanoma is mediated by both BRAF mutations and autocrine growth factor stimulation. Cancer Res. 2003;63(4):756–759. - PubMed
    1. Reifenberger J, et al. Frequent alterations of Ras signaling pathway genes in sporadic malignant melanomas. Int J Cancer. 2004;109(3):377–384. doi: 10.1002/ijc.11722. - DOI - PubMed
    1. Davies H, et al. Mutations of the BRAF gene in human cancer. Nature. 2002;417(6892):949–954. doi: 10.1038/nature00766. - DOI - PubMed
    1. Sumimoto H, et al. Inhibition of growth and invasive ability of melanoma by inactivation of mutated BRAF with lentivirus-mediated RNA interference. Oncogene. 2004;23(36):6031–6039. doi: 10.1038/sj.onc.1207812. - DOI - PubMed
    1. Wellbrock C, Rana S, Paterson H, Pickersgill H, Brummelkamp T, Marais R. Oncogenic BRAF regulates melanoma proliferation through the lineage specific factor MITF. PLoS One. 2008;3(7):e2734. doi: 10.1371/journal.pone.0002734. - DOI - PMC - PubMed

Publication types

MeSH terms