. 2013 May 17;288(20):14599-14611.
doi: 10.1074/jbc.M113.466235. Epub 2013 Mar 29.

Loss of calcium/calmodulin-dependent protein kinase II activity in cortical astrocytes decreases glutamate uptake and induces neurotoxic release of ATP

Affiliations

Loss of calcium/calmodulin-dependent protein kinase II activity in cortical astrocytes decreases glutamate uptake and induces neurotoxic release of ATP

Nicole M Ashpole et al. J Biol Chem. .

Abstract

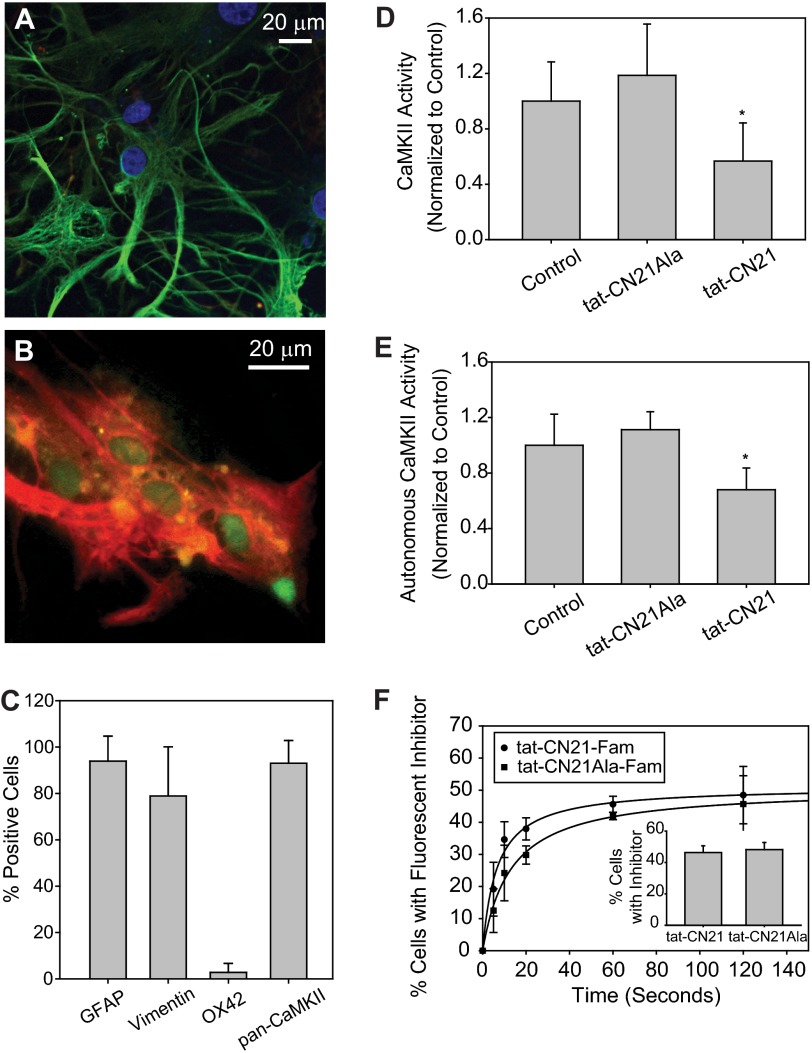
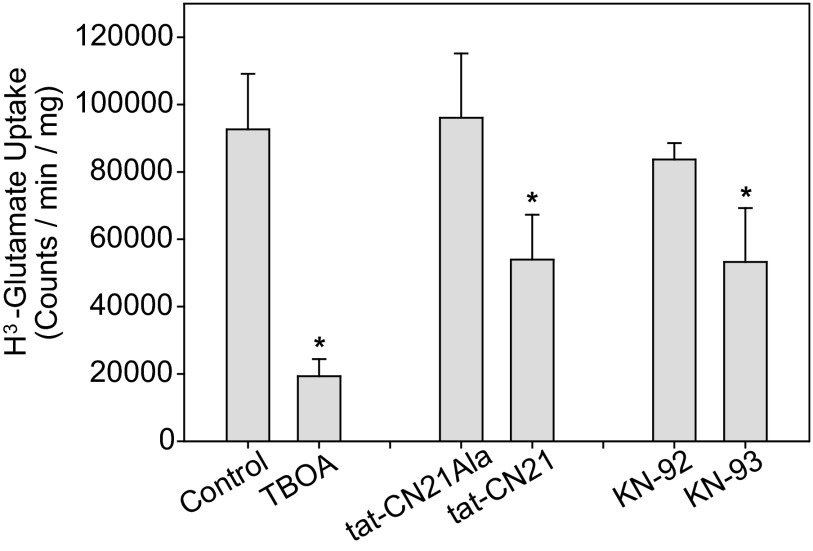
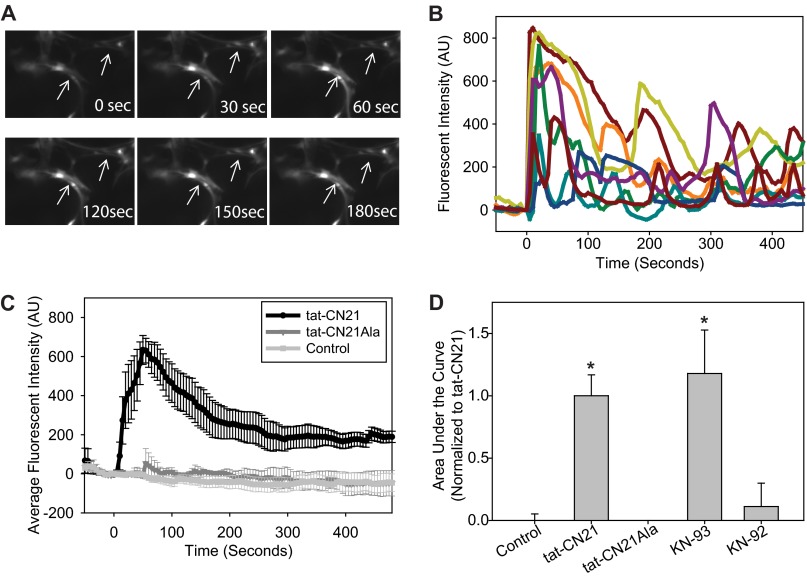
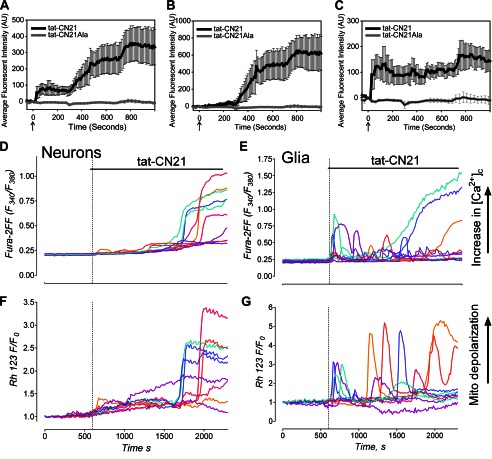
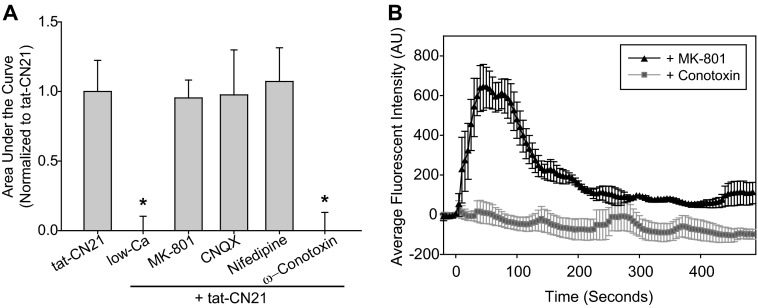
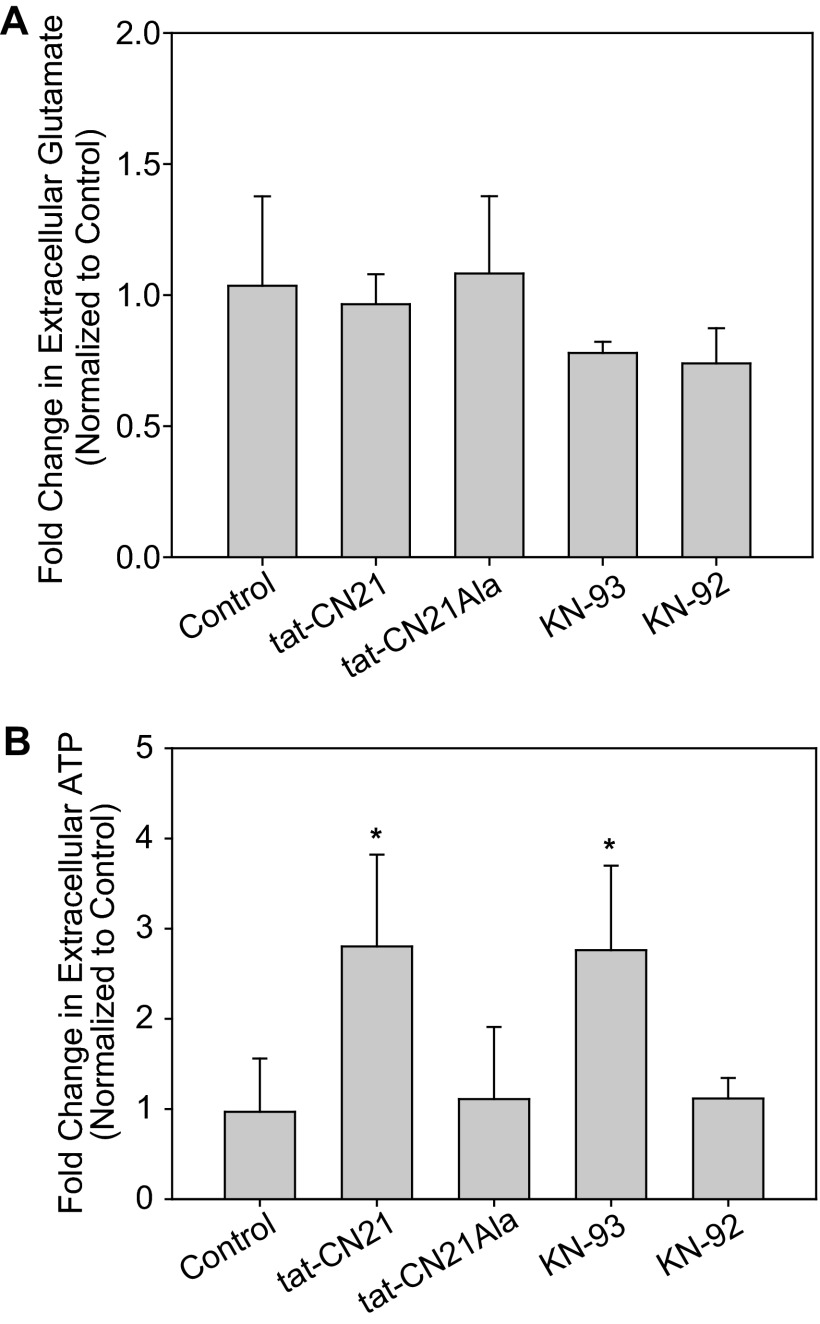
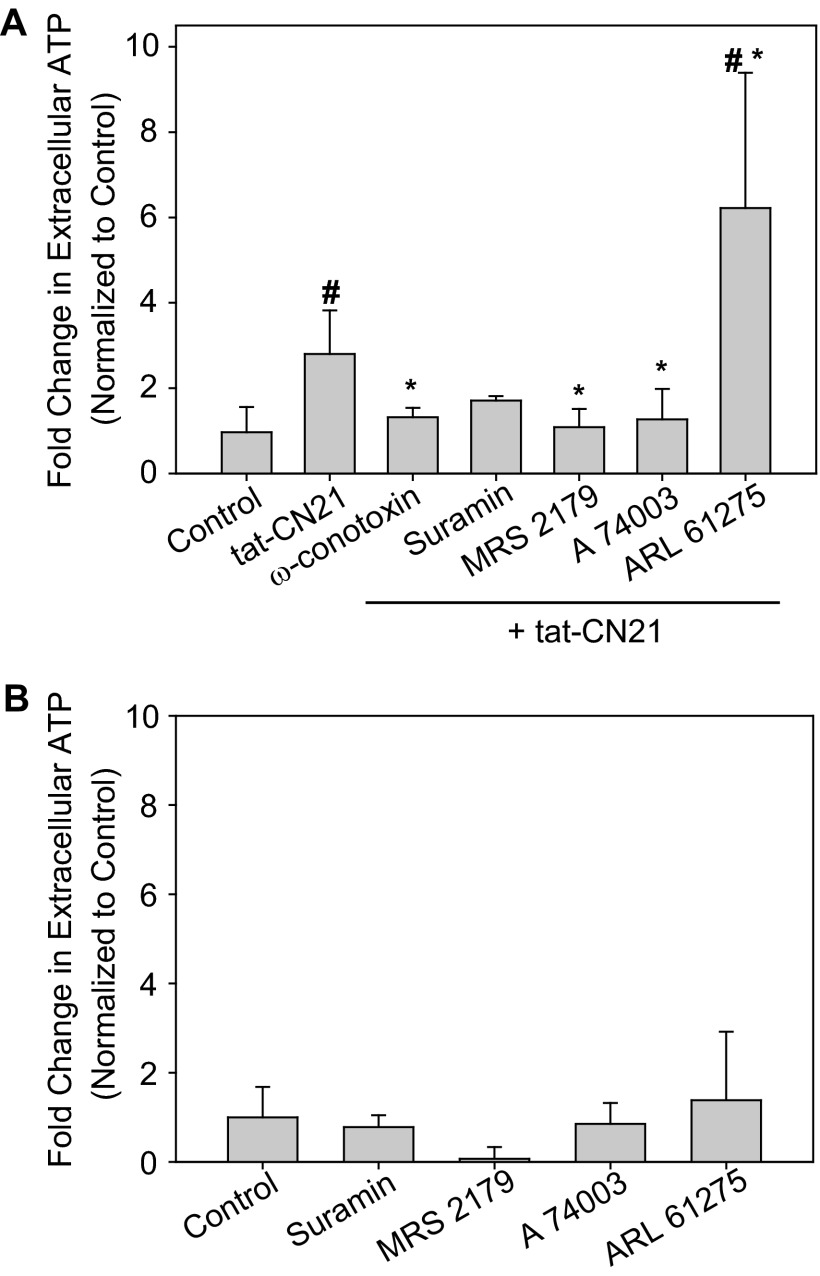
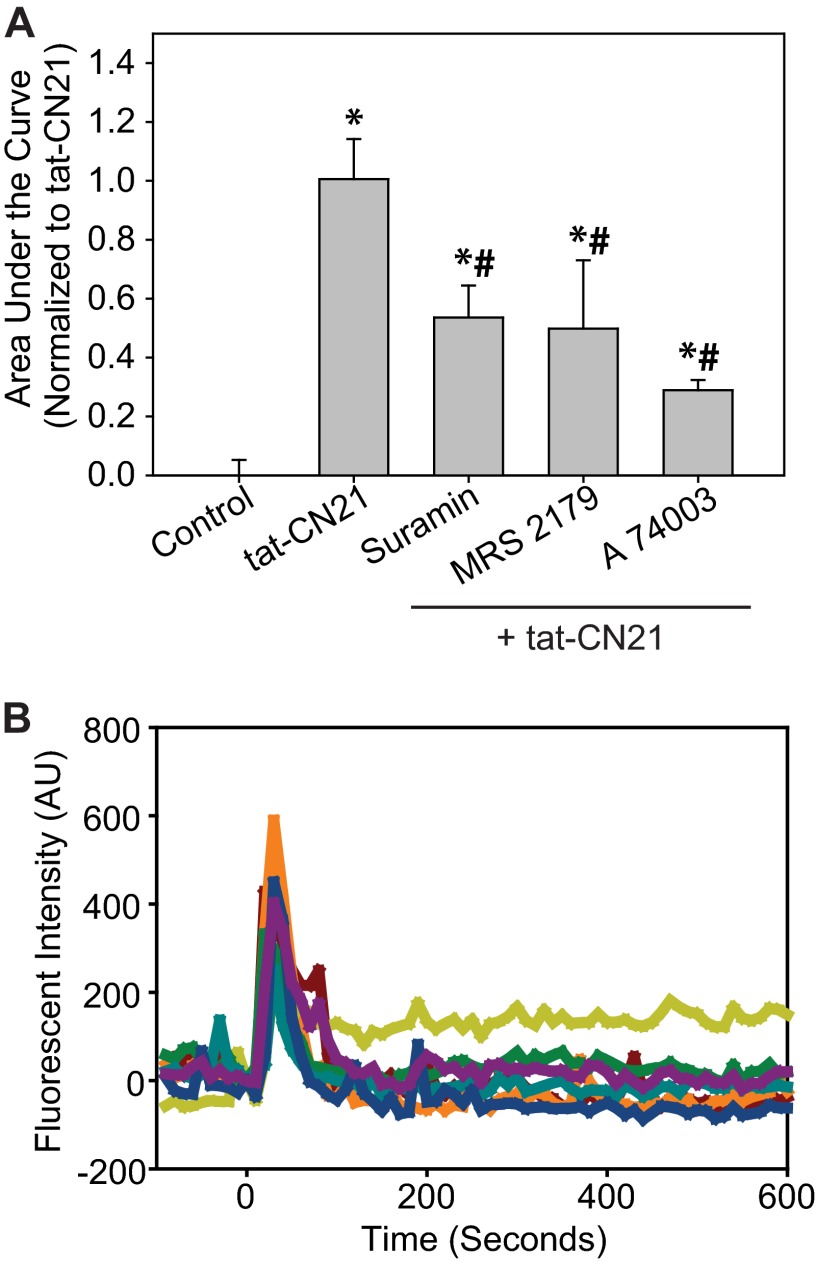
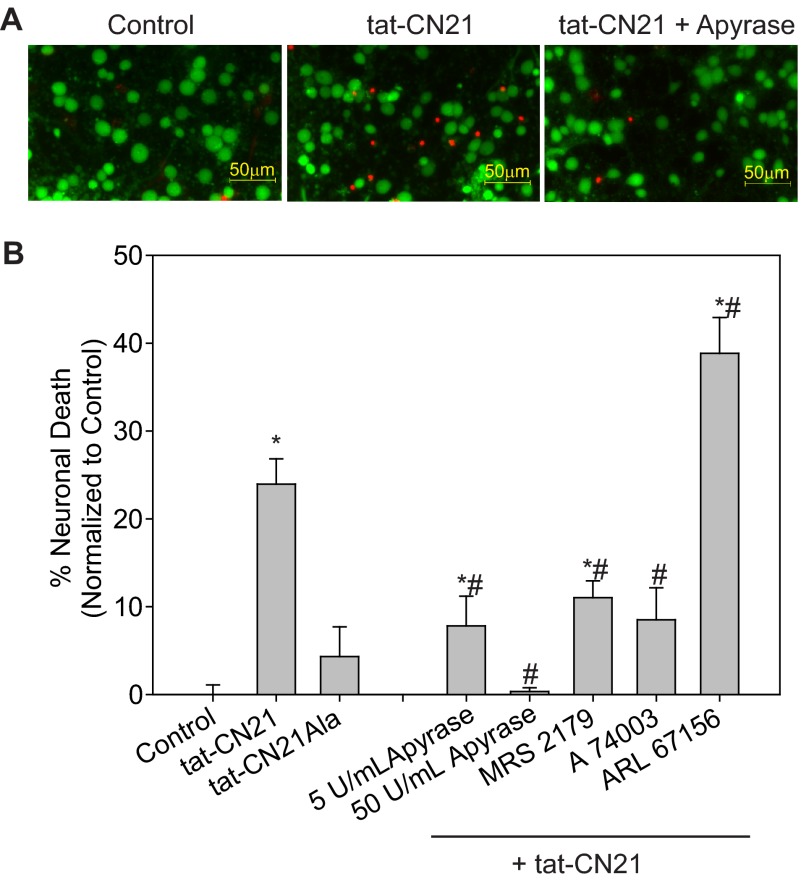
The extent of calcium/calmodulin-dependent protein kinase II (CaMKII) inactivation in the brain after ischemia correlates with the extent of damage. We have previously shown that a loss of CaMKII activity in neurons is detrimental to neuronal viability by inducing excitotoxic glutamate release. In the current study we extend these findings to show that the ability of astrocytes to buffer extracellular glutamate is reduced when CaMKII is inhibited. Furthermore, CaMKII inhibition in astrocytes is associated with the rapid onset of intracellular calcium oscillations. Surprisingly, this rapid calcium influx is blocked by the N-type calcium channel antagonist, ω-conotoxin. Although the function of N-type calcium channels within astrocytes is controversial, these voltage-gated calcium channels have been linked to calcium-dependent vesicular gliotransmitter release. When extracellular glutamate and ATP levels are measured after CaMKII inhibition within our enriched astrocyte cultures, no alterations in glutamate levels are observed, whereas ATP levels in the extracellular environment significantly increase. Extracellular ATP accumulation associated with CaMKII inhibition contributes both to calcium oscillations within astrocytes and ultimately cortical neuron toxicity. Thus, a loss of CaMKII signaling within astrocytes dysregulates glutamate uptake and supports ATP release, two processes that would compromise neuronal survival after ischemic/excitotoxic insults.

Keywords: CaMKII; Calcium Signaling; Glia; Glutamate; Neurodegeneration; Neuronal-Glial Communication.


Figures

FIGURE 1.
FIGURE 1.
CaMKII Expression and activity in cultured cortical astrocytes. A, shown is a representative image of a field of astrocytes immunostained with GFAP (green), OX42 (red), and Hoechst (blue). B, shown is a representative image of field of astrocytes immunostained with vimentin (red) and pan-CaMKII (green). C, shown is the average number of cells (n = 3, ±S.E.) positively stained with GFAP, vimentin, OX42, and CaMKII. D, shown is the average Ca2+/CaM-stimulated (total) CaMKII activity within astrocyte lysates treated with 10 μm tat-CN21 or tat-CN21Ala. Inhibitors were added to the cultures 10 min before lysis, and activity was measured in vitro via 32P incorporation into the CaMKII peptide substrate AC-2. The asterisk indicates significant difference compared with control (*, p < 0.05, one-way ANOVA, post-hoc Dunnett's test). E, shown is the average CaM-independent (autonomous) CaMKII activity within astrocyte lysates treated with 10 μm tat-CN21 or tat-CN21Ala as described in D. The asterisk indicates significant difference compared with control (*, p < 0.05, one-way ANOVA, post-hoc Dunnett's test). F, astrocyte uptake of fluorescent-conjugated tat-CN21 and tat-CN21Ala (10 μm) was examined using fluorescent microscopy. Total cell number was determined by Hoechst staining. Inset, shown is the average number of cells with fluorescently conjugated tat-CN21 and tat-CN21Ala 20 min after application.
FIGURE 2.
FIGURE 2.
Decreased glutamate uptake in astrocytes with CaMKII inhibition. Average [3H]glutamate uptake (n = 3, ±S.D.) in astrocytes pretreated with either 0.2% DMSO, 100 μm DL-threo-β-Benzyloxyaspartic acid (TBOA), 10 μm tat-CN21, 10 μm tat-CN21Ala, 1 μm KN-93, or 1 μm KN-92 for 20 min is shown. The asterisk indicates significant difference compared with DMSO control (*, p < 0.05, one-way ANOVA, post-hoc Dunnett's test).
FIGURE 3.
FIGURE 3.
CaMKII inhibition induces calcium oscillations in astrocytes. A, shown are astrocytes loaded with Fluo-4AM exhibit calcium transients after exposure to the CaMKII inhibitor tat-CN21 (10 μm). B, shown are representative Fluo-4AM traces of a field of astrocytes in response to tat-CN21 application at time 0. AU, arbitrary units. C, shown is the average trace (±S.E., n = 3) of calcium response in astrocytes treated with DMSO control, tat-CN21, or tat-CN21Ala (10 μm). D, shown is the average area under the curve from time 0 to 500 s (± S.E., n = 3–5) after treatment with tat-CN21 (10 μm), KN-93 (1 μm), or inactive controls-tat-CN21-Ala (10 μm) and KN-92 (1 μm), as indicated.
FIGURE 4.
FIGURE 4.
Alterations in intracellular calcium and mitochondrial membrane potential in neuronal/astrocyte co-cultures after CaMKII inhibition. A, shown is the average trace (±S.E., n = 3) of calcium response in mixed cultures of cortical neurons and astrocytes treated with 10 μm tat-CN21 or tat-CN21Ala as measured by Fluo-4AM. AU, arbitrary units. B, shown is an average calcium response (± S.E., n = 3) after application of 10 μm tat-CN21 or tat-CN21Ala in cells responding to a depolarizing 20 mm KCl pulse at time −300 s (considered neurons). C, shown is an average trace (± S.E., n = 3) of calcium response with 10 μm tat-CN21 or tat-CN21Ala application in cells that did not respond to the KCl pulse at time −300 s (considered astrocytes). D, shown are representative traces of Fura-2FF calcium response in hippocampal neurons (identified by KCl pulse at time 0) after 10 μm tat-CN21 application. E, shown are representative traces of Fura-2FF calcium response in astrocytes (which did not respond to KCl at time 0) after tat-CN21 application. F and G, shown are representative traces of Rhodamine123 mitochondrial membrane potential responses in the same hippocampal neurons (F) and astrocytes (G) as in D and E.
FIGURE 5.
FIGURE 5.
Mechanisms underlying astrocytic calcium influx induced by CaMKII inhibition. A, shown is the average area under the curve (±S.E., n = 3–5) after treatment with 10 μm tat-CN21 in combination with various pharmacological inhibitors as indicated. Pharmacological inhibitors were added at −120 s; none of the inhibitors altered the base line. The asterisk indicates significant difference compared with control, whereas the pound sign indicates a significant difference compared with tat-CN21 (*, p < 0.05, One-way ANOVA, post-hoc Dunnett's test). B, shown are representative traces of a field of astrocytes in response to pharmacological inhibitor application at −120 s and tat-CN21 application at time 0. AU, arbitrary units.
FIGURE 6.
FIGURE 6.
CaMKII inhibition induces ATP release from astrocytes. A, shown is the average change in extracellular glutamate concentration (n = 6, ±S.D.) in astrocyte cultures after 24 h application of various CaMKII inhibitors and controls (p > 0.05, one-way ANOVA). B, shown is the average change in extracellular ATP concentration (n = 6, ±S.D.) in astrocyte cultures after 24 h application of various CaMKII inhibitors and control. The asterisk indicates significant difference compared with control (*, p < 0.05, one-way ANOVA, post-hoc Dunnett's test).
FIGURE 7.
FIGURE 7.
Purinergic signaling modulates ATP release in response to CaMKII inhibition. A, shown is the average change in extracellular ATP concentration when tat-CN21 was applied alone or in combination with various pharmacological modulators of purinergic signaling and the N-type calcium channel blocker, ω-conotoxin. The asterisk indicates significant difference compared with tat-CN21, whereas the pound sign (#) indicates significant difference compared with control (* and #: p < 0.05, one-way ANOVA, post-hoc Dunnett's test). B, shown is the average fold change in extracellular ATP levels (n = 3–4, ±S.D.) when astrocytes were treated with various pharmacological modulators of purinergic signaling in the absence of CaMKII inhibition compared with control (p > 0.05, one-way ANOVA).
FIGURE 8.
FIGURE 8.
ATP signaling is required for calcium oscillations in astrocytes induced by CaMKII inhibition. A, shown is the average area under the curve (± S.E., n = 3–5) for Fluo-4AM-loaded cells (calcium influx) after treatment with 10 μm tat-CN21 and/or co-treatment with various other pharmacological inhibitors, as indicated. Pharmacological inhibitors were added at −120 s; none of the inhibitors altered base line. The asterisk indicates significant difference compared with control, whereas the pound sign (#) indicates a significant difference compared with tat-CN21 (one-way ANOVA, post-hoc Dunnett's test, * and #, p < 0.05). B, shown are representative traces of astrocytic calcium response after tat-CN21 application at time 0 with suramin pretreatment at time −120 s. AU, arbitrary units.
FIGURE 9.
FIGURE 9.
Neuronal death induced by extracellular ATP released by astrocytes after CaMKII inhibition. Average neuronal death (n = 5–8, ±S.E.) in neurons treated (24 h) with conditioned media from astrocytes subjected to 10 μm tat-CN21Ala or tat-CN21 alone or in combination with MRS 2179 (1 μm), A 740003 (1 μm), or ARL 67156 (10 μm) for 24 h is shown. The asterisk indicates significant difference compared with control, whereas the pound sign indicates significant difference compared with tat-CN21 alone (* and #, p < 0.05, one-way ANOVA, post-hoc Dunnett's test).

References

    1. Sakagami H., Watanabe M., Kondo H. (1992) Gene expression of Ca2+/calmodulin-dependent protein kinase of the cerebellar granule cell type or type IV in the mature and developing rat brain. Brain. Res. Mol. Brain. Res. 16, 20–28 - PubMed
    1. Bayer K. U., Löhler J., Schulman H., Harbers K. (1999) Developmental expression of the CaM kinase II isoforms. Ubiquitous γ- and δ-CaM kinase II are the early isoforms and most abundant in the developing nervous system. Brain. Res. Mol. Brain. Res. 70, 147–154 - PubMed
    1. Ouimet C. C., McGuinness T. L., Greengard P. (1984) Immunocytochemical localization of calcium/calmodulin-dependent protein kinase II in rat brain. Proc. Natl. Acad. Sci. U.S.A. 81, 5604–5608 - PMC - PubMed
    1. Erondu N. E., Kennedy M. B. (1985) Regional distribution of type II Ca2+/calmodulin-dependent protein kinase in rat brain. J. Neurosci. 5, 3270–3277 - PMC - PubMed
    1. McGuinness T. L., Lai Y., Greengard P. (1985) Ca2+/calmodulin-dependent protein kinase II. Isozymic forms from rat forebrain and cerebellum. J. Biol. Chem. 260, 1696–1704 - PubMed

Publication types

LinkOut - more resources