. 2013 Mar;25(3):820-33.
doi: 10.1105/tpc.113.109355. Epub 2013 Mar 29.

Interlocking feedback loops govern the dynamic behavior of the floral transition in Arabidopsis

Affiliations

Interlocking feedback loops govern the dynamic behavior of the floral transition in Arabidopsis

Katja E Jaeger et al. Plant Cell. 2013 Mar.

Abstract

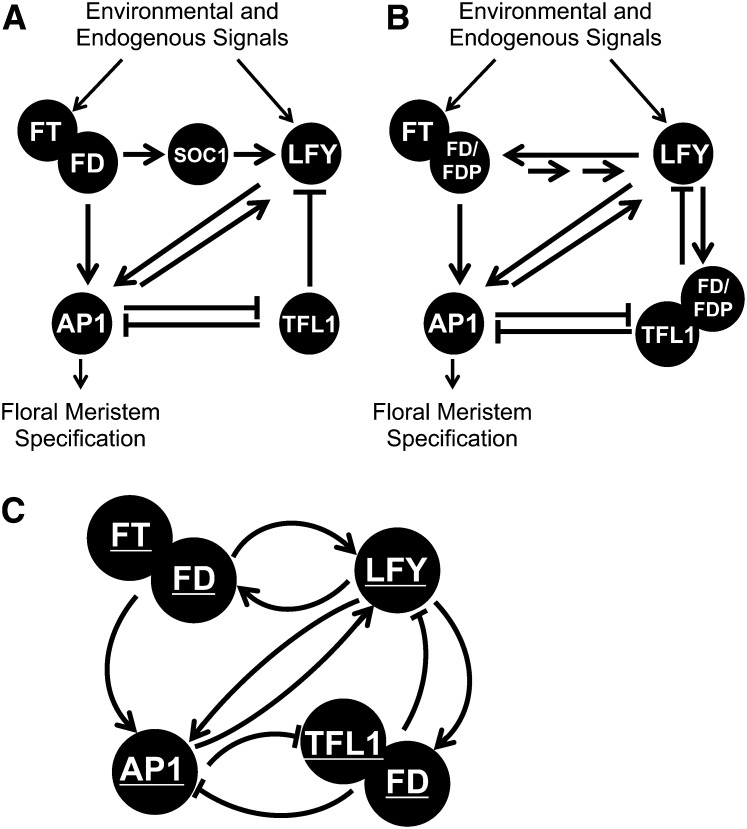
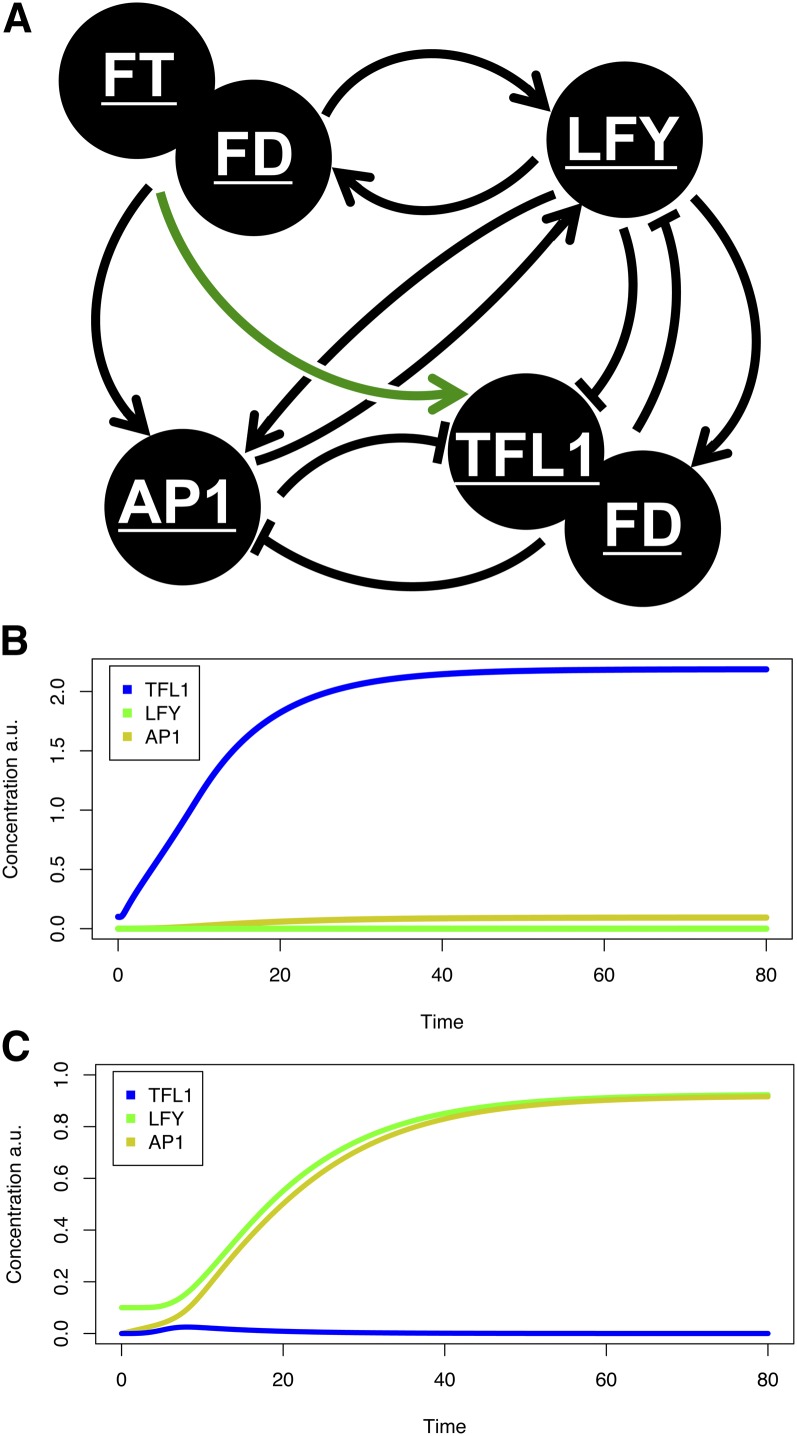
During flowering, primordia on the flanks of the shoot apical meristem are specified to form flowers instead of leaves. Like many plants, Arabidopsis thaliana integrates environmental and endogenous signals to control the timing of reproduction. To study the underlying regulatory logic of the floral transition, we used a combination of modeling and experiments to define a core gene regulatory network. We show that FLOWERING LOCUS T (FT) and TERMINAL FLOWER1 (TFL1) act through FD and FD PARALOG to regulate the transition. The major floral meristem identity gene LEAFY (LFY) directly activates FD, creating a positive feedback loop. This network predicts flowering behavior for different genotypes and displays key properties of the floral transition, such as signal integration and irreversibility. Furthermore, modeling suggests that the control of TFL1 is important to flexibly counterbalance incoming FT signals, allowing a pool of undifferentiated cells to be maintained despite strong differentiation signals in nearby cells. This regulatory system requires TFL1 expression to rise in proportion to the strength of the floral inductive signal. In this network, low initial levels of LFY or TFL1 expression are sufficient to tip the system into either a stable flowering or vegetative state upon floral induction.


Figures

Figure 1.
Figure 1.
Major Regulatory Networks Governing the Floral Transition. (A) Environmental and endogenous floral promoting signals stimulate increasing expression of the floral pathway integrator genes FT and LFY. Rising levels of FT and LFY proteins stimulate the expression of floral meristem identity genes, such as AP1, leading to the specification of flowers. (B) Regulatory interactions in the core network, including activities verified experimentally in this work. FDP acts redundantly with FD to activate flowering. LFY directly binds the FD promoter, accounting for the increase in FD expression upon the floral transition. The TFL1 floral repressive signal is mediated by FD. (C) A network of five regulatory hubs captures the major properties of the floral transition. Hubs are denoted by underlining, and reflect the likely activity of multiple genes in the plant. For example, the FT hub encompasses the activity of at least FT and TSF, the FD hub FD and FDP, while AP1 includes the biological activity of AP1, CAULIFLOWER, and FRUITFULL.
Figure 2.
Figure 2.
Gene Expression Patterns in the Wild Type the pny pnf Background. Analysis of the mRNA expression of marker genes in Arabidopsis apices under inductive and noninductive conditions by in situ hybridization. Asterisks denote the SAM. (A) FDP expression in a wild-type vegetative apex under noninductive conditions. Bar = 50 µm. (B) FDP expression in a wild-type apex undergoing floral transition. (C) FDP in pny pnf under inductive conditions. (D) FD in a wild-type vegetative apex, noninductive conditions. (E) FD in wild-type apex transitioning, note the increased expression compared with (D). (F) FD in pny pnf is not upregulated under inductive conditions. (G) LFY expression in a wild-type vegetative apex under noninductive conditions. (H) LFY expression is strongly induced during the floral transition. (I) LFY in pny pnf is not upregulated under inductive conditions. (J) TFL1 in wild-type plants under noninductive short-day conditions is absent from the apex but note strong expression in the axillary meristem (arrow). (K) TFL1 is strongly upregulated in the center of the apex in the wild type under inductive conditions. (L) TFL1 is strongly expressed outside of its normal zone of expression in pny pnf; note the strong expression in the vasculature.
Figure 3.
Figure 3.
Genetic Interactions Reveal That FD and FDP Are Necessary for FT to Accelerate Flowering. According to convention, developmental time is measured by the number of rosette and cauline leaves produced on the main shoot prior to flowering. (A) A point mutation, fdp-1, was obtained in the DNA binding domain of FDP. fdp-1 (right) enhances the late flowering phenotype of fd-2 (center) such that fdp-1 fd-2 double mutants (left) are even later flowering than fd-2. Plants were grown 39 d. (B) 35S:FT (right) is suppressed in the fd-2 fdp-1 background (left), indicating that most FT signaling is mediated by FD and FDP, which are partially redundant with each other. Plants were grown 37 d. (C) The phenotype of tfl1-1 (left) is largely suppressed by fd-2 (tfl1-1 fd-2, center left) compared with the wild type (center right) and fd-2 (right), showing that FD is required for the phenotypic effects of tfl1-1 to be observed. Plants were grown 37 d. Col-0, Columbia-0. (D) 35S:TFL1 (left) is largely suppressed by fd-2 (right), showing that FD mediates TFL1 signaling. Plants were grown 42 d.
Figure 4.
Figure 4.
Positive Feedback in the Flowering Pathway. (A) Analysis of the FD promoter by fusion to the GUS reporter gene and examination of GUS enzyme activity reveals two regions necessary for FD upregulation during the floral transition (+/− denotes promoter upregulation as measured by GUS staining). Each of these regions, shown in gray in the context of the FD promoter sequence, at top, contains an LBS. Promoter constructs, with deletions indicated, are shown below. (B) Histochemical staining for the GUS reporter gene in Arabidopsis apices under inductive and non-inductive conditions. shows that deletion of the LBS in the FD promoter abolishes FD up-regulation upon the floral transition. (C) LFY binds directly to the LBS in the FD promoter in vivo as measured by ChIP. 35S:3XFLAG:LFY plants were harvested after 14 d and cross-linked. Enrichment for LBSI and LBSII in the FD promoter was assayed by quantitative PCR in FLAG:LFY as well as control plants (Columbia-0 [Col-0]). The known binding of LFY to LBSI and II in the AP1 promoter was used as a positive control. Error bars are sd for two biological experiments each with three technical replicates.
Figure 5.
Figure 5.
The Floral Network Model Captures Key Properties of the Floral Transition in Arabidopsis. (A) The definition of developmental decisions via AP1 hub levels. The AP1 hub determines the output of the floral induction pathway. The introduced thresholds correspond to developmental changes that we map onto and characterize by leaf numbers and allows for leaf number data to be used to fit model parameters. a.u., arbitrary units. (B) The modeled floral transition is characterized by rising AP1. The initiation of flowering occurs when AP1 crosses the 0.2 threshold, resulting in a switch from rosette to cauline leaf production. Flowering is completed when AP1 exceeds 0.3. The curves show the effect withdrawal of FT production after different lengths of developmental time. When FT production is stopped after the developmental time of 10 leaves (shown in dark blue), flowering is identical to the wild type (WT) where FT is maintained (magenta). Halting FT production after the formation of five leaves (green) in simulations causes a delayed time to flower. Flowering is still accelerated when FT production is withdrawn after the formation of only two leaves (red) compared with a simulated complete lack of FT (ft-10; cyan). (C) The network is able to integrate simulated circadian oscillations in FT. Strongly modulated FT levels are given as input, but the resulting AP1 from the network is only marginally perturbed. (D) The network is able to filter simulated noise in FT. Uniform random noise of up to 200% FT was given as input, but the network integrates this out, resulting in an almost smooth AP1 curve.
Figure 6.
Figure 6.
Relative Levels of the FT and TFL1 Hubs Determine the Flowering Landscape. Plot showing the influence of varying levels of the FT and TFL1 hubs on floral transition behavior (as measured by the number of leaves produced before flowering). High levels of the FT hub and moderate levels of the TFL1 hub lead to early flowering, whereas high TFL1 at low to moderate FT levels is able to completely prevent flowering in the model. Levels of the FT and TFL1 hubs are given in arbitrary units.
Figure 7.
Figure 7.
TFL1 Rises with FT Levels. Quantitative PCR was used to analyze how TFL1 and FT expression varies upon the floral transition in the whole rosette. Plants were grown for 20 d under noninductive 8-h short days and shifted into inductive 16-h long days to trigger flowering. Samples were taken immediately before shifting and every day following the shift for 5 d at dusk. This observation confirms as indicated by in situ hybridization (Figures 2J and 2K) that TFL1 expression rises in proportion to the floral inductive signal (FT).
Figure 8.
Figure 8.
An Extended Network That Captures Cell Fate Determination in the SAM during the Floral Transition. (A) The initial network used to determine flowering time was unable to produce states with high stable TFL1 hub activity. We found two further interactions were necessary: repression of TFL1 by LFY (Winter et al., 2011) and the proportional upregulation of TFL1 by FT (green arrow). (B) Priming the system with low initial levels of TFL1 (to simulate the vegetative center of the SAM) results in a stable vegetative state upon the induction of flowering. a.u., arbitrary units. (C) Reversing the scenario above (B), with TFL1 starting at 0 and LFY at 0.1 (representative of a presumptive floral meristem), gives the opposite behavior with TFL1 becoming stably repressed and AP1 expressed at a high level. The network therefore shows qualitatively flowering or nonflowering behavior depending on the initial conditions. Blue, TFL1; green, LFY; yellow, AP1.

References

    1. Abe M., Kobayashi Y., Yamamoto S., Daimon Y., Yamaguchi A., Ikeda Y., Ichinoki H., Notaguchi M., Goto K., Araki T. (2005). FD, a bZIP protein mediating signals from the floral pathway integrator FT at the shoot apex. Science 309: 1052–1056 - PubMed
    1. Ahn J.H., Miller D., Winter V.J., Banfield M.J., Lee J.H., Yoo S.Y., Henz S.R., Brady R.L., Weigel D. (2006). A divergent external loop confers antagonistic activity on floral regulators FT and TFL1. EMBO J. 25: 605–614 - PMC - PubMed
    1. Alvarez-Buylla E.R., Balleza E., Benítez M., Espinosa-Soto C., Padilla-Longoria P. (2008a). Gene regulatory network models: A dynamic and integrative approach to development. SEB Exp. Biol. Ser. 61: 113–139 - PubMed
    1. Alvarez-Buylla E.R., Chaos A., Aldana M., Benítez M., Cortes-Poza Y., Espinosa-Soto C., Hartasánchez D.A., Lotto R.B., Malkin D., Escalera Santos G.J., Padilla-Longoria P. (2008b). Floral morphogenesis: Stochastic explorations of a gene network epigenetic landscape. PLoS ONE 3: e3626. - PMC - PubMed
    1. Amaya I., Ratcliffe O.J., Bradley D.J. (1999). Expression of CENTRORADIALIS (CEN) and CEN-like genes in tobacco reveals a conserved mechanism controlling phase change in diverse species. Plant Cell 11: 1405–1418 - PMC - PubMed

Publication types

MeSH terms