

Changes in task-related functional connectivity across multiple spatial scales are related to reading performance
- PMID: 23544057
- PMCID: PMC3609744
- DOI: 10.1371/journal.pone.0059204
Changes in task-related functional connectivity across multiple spatial scales are related to reading performance
Abstract
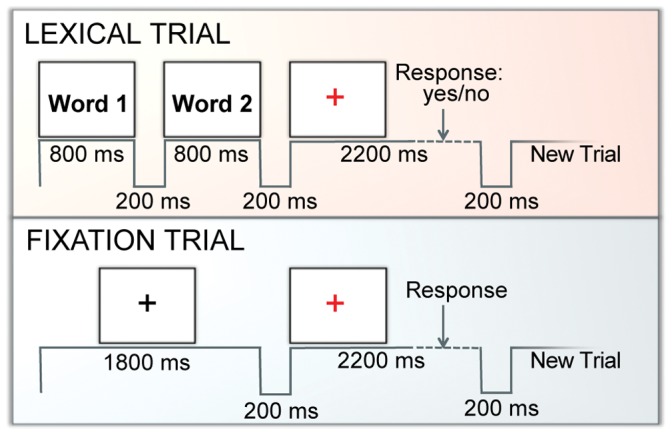
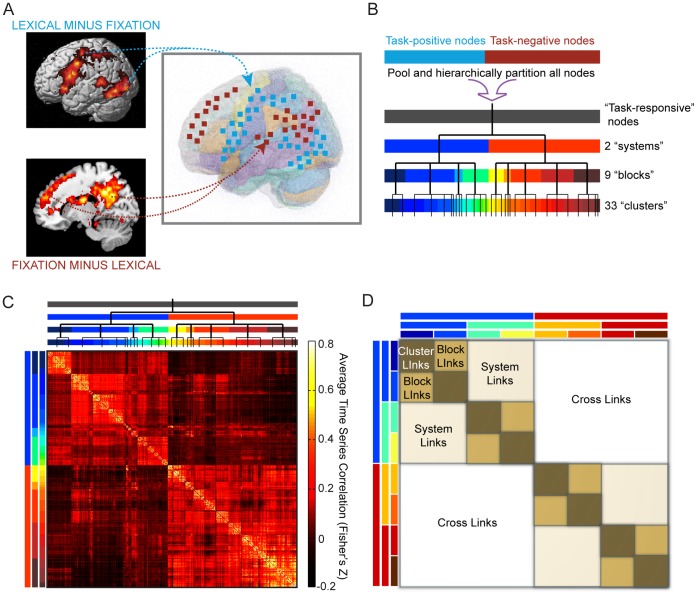
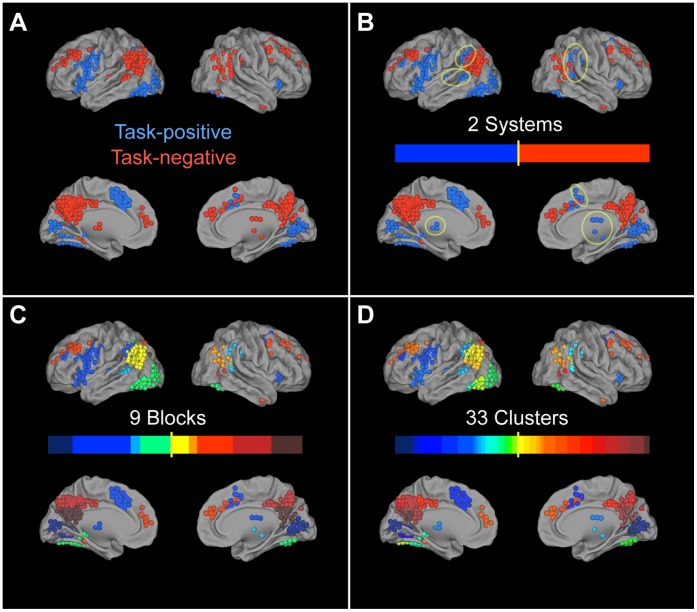
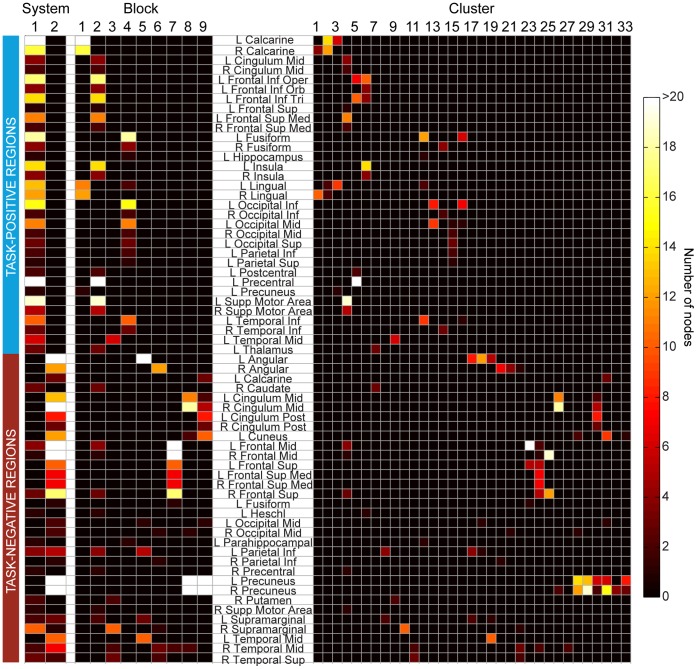
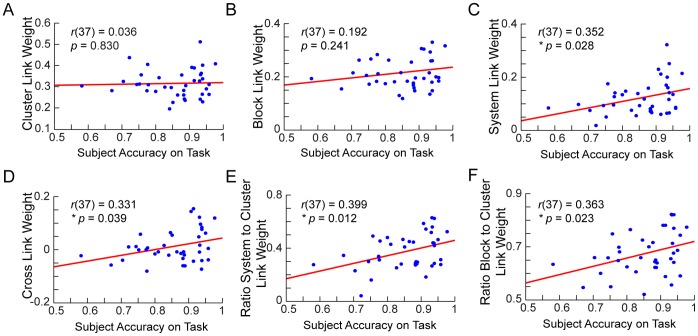
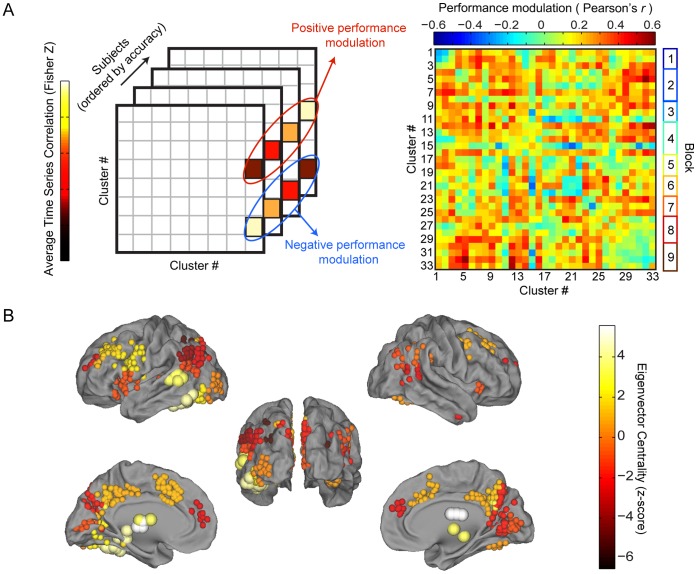
Reading requires the interaction of a distributed set of cortical areas whose distinct patterns give rise to a wide range of individual skill. However, the nature of these neural interactions and their relation to reading performance are still poorly understood. Functional connectivity analyses of fMRI data can be used to characterize the nature of interactivity of distributed brain networks, yet most previous studies have focused on connectivity during task-free (i.e., "resting state") conditions. Here, we report new methods for assessing task-related functional connectivity using data-driven graph theoretical methods and describe how large-scale patterns of connectivity relate to individual variability in reading performance among children. We found that connectivity patterns of subjects performing a reading task could be decomposed hierarchically into multiple sub-networks, and we observed stronger long-range interaction between sub-networks in subjects with higher task accuracy. Additionally, we found a network of hub regions known to be critical to reading that displays increased short-range synchronization in higher accuracy subjects. These individual differences in task-related functional connectivity reveal that increased interaction between distant regions, coupled with selective local integration within key regions, is associated with better reading performance. Importantly, we show that task-related neuroimaging data contains far more information than usually extracted via standard univariate analyses--information that can meaningfully relate neural connectivity patterns to cognition and task.
Conflict of interest statement
Figures
Similar articles
-
Resting-State Network Patterns Underlying Cognitive Function in Bipolar Disorder: A Graph Theoretical Analysis.Brain Connect. 2020 Sep;10(7):355-367. doi: 10.1089/brain.2019.0709. Epub 2020 Jul 21. Brain Connect. 2020. PMID: 32458698 Free PMC article.
-
Task- and stimulus-related cortical networks in language production: Exploring similarity of MEG- and fMRI-derived functional connectivity.Neuroimage. 2015 Oct 15;120:75-87. doi: 10.1016/j.neuroimage.2015.07.017. Epub 2015 Jul 11. Neuroimage. 2015. PMID: 26169324
-
A computational study of whole-brain connectivity in resting state and task fMRI.Med Sci Monit. 2014 Jun 20;20:1024-42. doi: 10.12659/MSM.891142. Med Sci Monit. 2014. PMID: 24947491 Free PMC article.
-
Brain connectivity and visual attention.Brain Connect. 2013;3(4):317-38. doi: 10.1089/brain.2012.0139. Epub 2013 Jun 8. Brain Connect. 2013. PMID: 23597177 Free PMC article. Review.
-
Resting-state functional magnetic resonance imaging: review of neurosurgical applications.Neurosurgery. 2014 May;74(5):453-64; discussion 464-5. doi: 10.1227/NEU.0000000000000307. Neurosurgery. 2014. PMID: 24492661 Review.
Cited by
-
Activation and functional connectivity of cerebellum during reading and during arithmetic in children with combined reading and math disabilities.Front Neurosci. 2024 Apr 29;18:1135166. doi: 10.3389/fnins.2024.1135166. eCollection 2024. Front Neurosci. 2024. PMID: 38741787 Free PMC article.
-
Neural pathways of phonological and semantic processing and its relations to children's reading skills.Front Neurosci. 2022 Oct 12;16:984328. doi: 10.3389/fnins.2022.984328. eCollection 2022. Front Neurosci. 2022. PMID: 36312011 Free PMC article.
-
Large-scale network interactions supporting item-context memory formation.PLoS One. 2019 Jan 10;14(1):e0210167. doi: 10.1371/journal.pone.0210167. eCollection 2019. PLoS One. 2019. PMID: 30629666 Free PMC article.
-
Functional connectivity in the developing language network in 4-year-old children predicts future reading ability.Dev Sci. 2021 Mar;24(2):e13041. doi: 10.1111/desc.13041. Epub 2020 Oct 28. Dev Sci. 2021. PMID: 33032375 Free PMC article.
-
Longitudinal Task-Related Functional Connectivity Changes Predict Reading Development.Front Psychol. 2018 Sep 19;9:1754. doi: 10.3389/fpsyg.2018.01754. eCollection 2018. Front Psychol. 2018. PMID: 30283393 Free PMC article.
References
-
- Odegard TN, Farris EA, Ring J, McColl R, Black J (2009) Brain connectivity in non-reading impaired children and children diagnosed with developmental dyslexia. Neuropsychologia 47: 1972–1977. - PubMed
-
- Beaulieu C, Plewes C, Paulson LA, Roy D, Snook L, et al. (2005) Imaging brain connectivity in children with diverse reading ability. Neuroimage 25: 1266–1271. - PubMed
-
- van der Mark S, Klaver P, Bucher K, Maurer U, Schulz E, et al. (2011) The left occipitotemporal system in reading: disruption of focal fMRI connectivity to left inferior frontal and inferior parietal language areas in children with dyslexia. Neuroimage 54: 2426–2436. - PubMed
Publication types
MeSH terms
Grants and funding
LinkOut - more resources
Full Text Sources
Other Literature Sources
Medical
