

Transcriptional profiling of rice early response to Magnaporthe oryzae identified OsWRKYs as important regulators in rice blast resistance
- PMID: 23544090
- PMCID: PMC3609760
- DOI: 10.1371/journal.pone.0059720
Transcriptional profiling of rice early response to Magnaporthe oryzae identified OsWRKYs as important regulators in rice blast resistance
Abstract
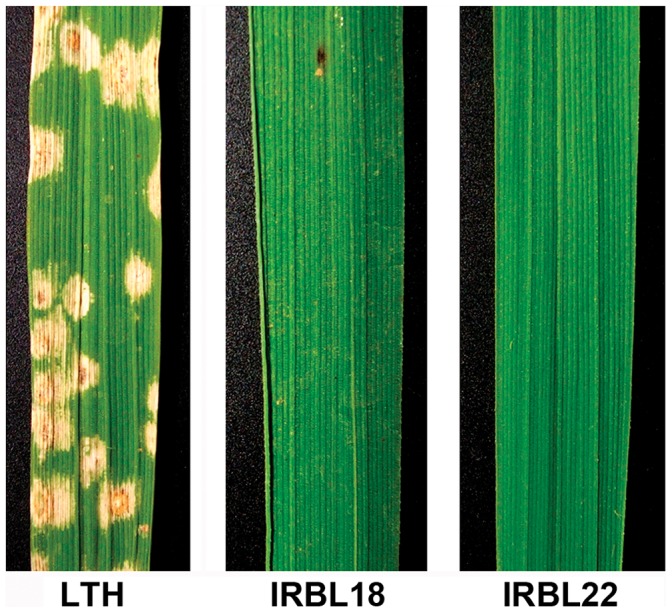
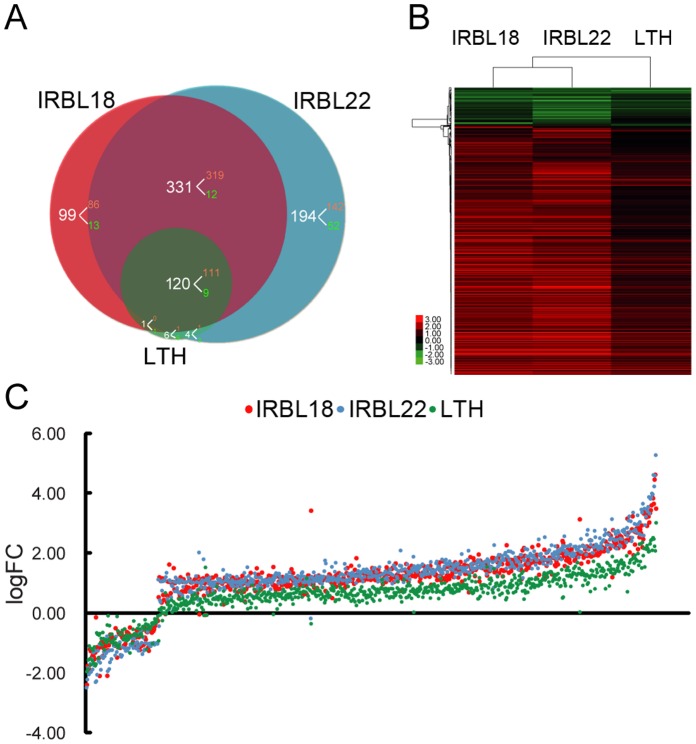
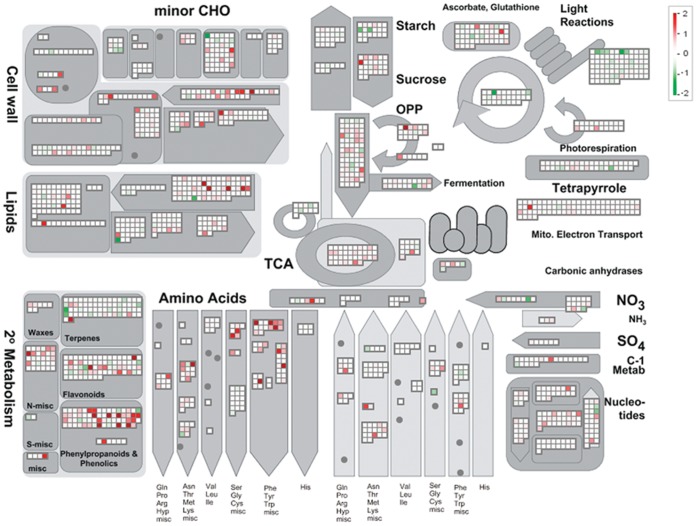
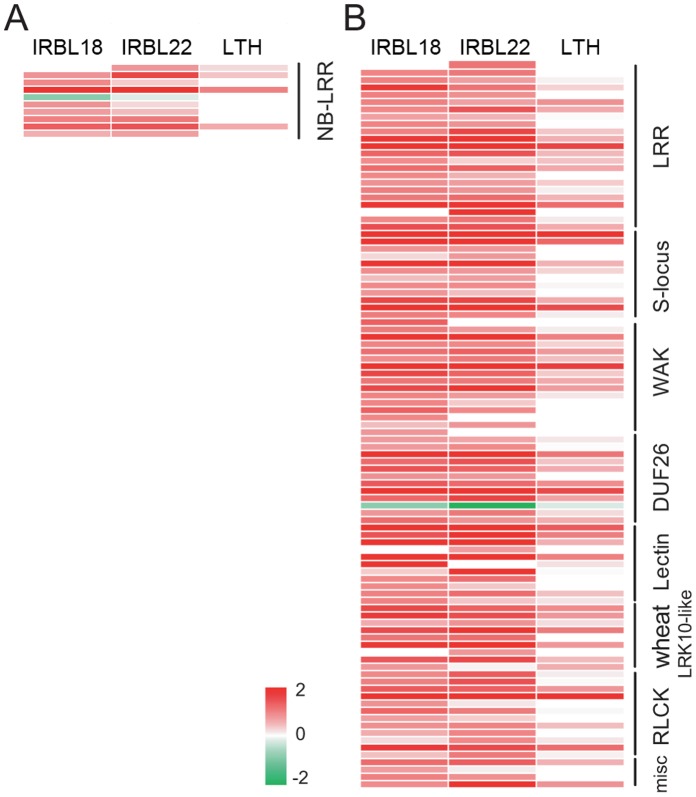
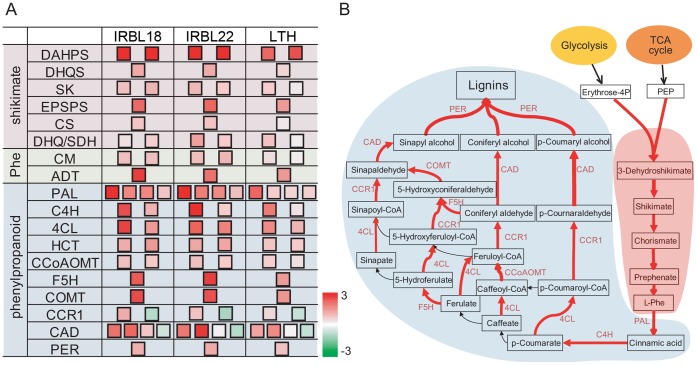
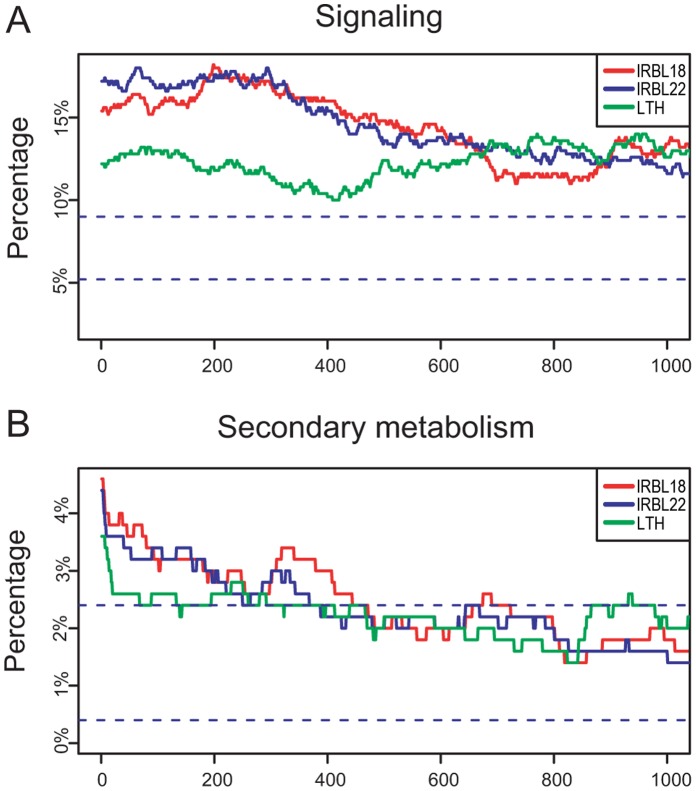
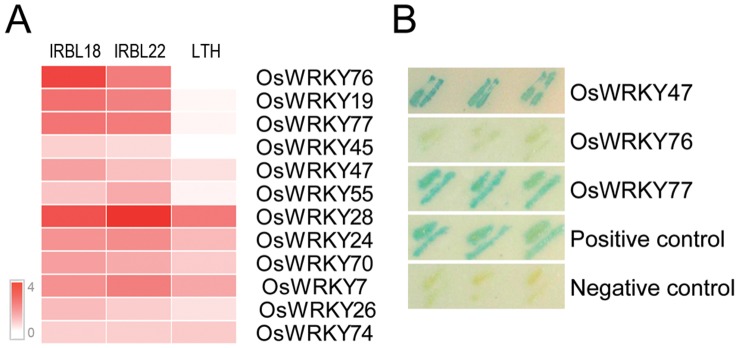
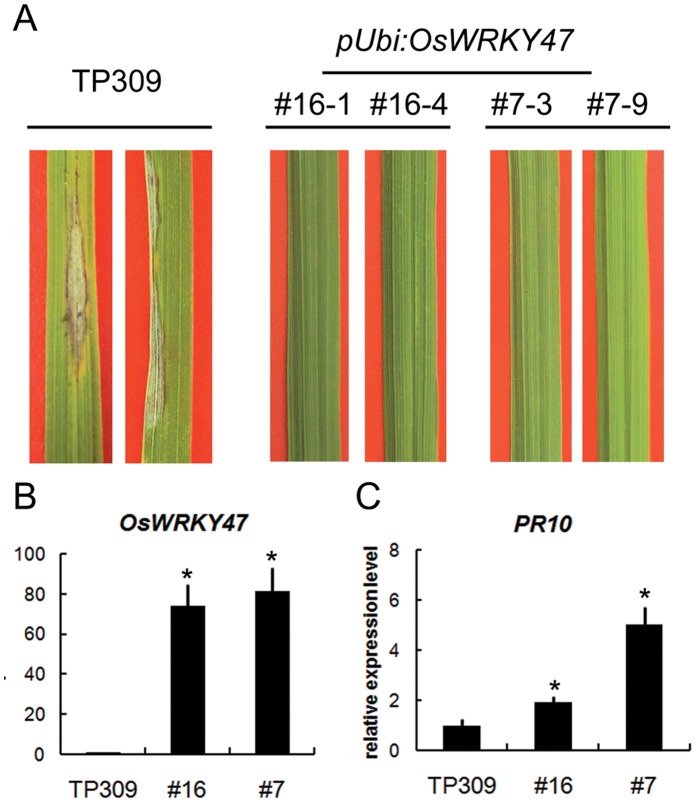
Rice blast disease is a major threat to rice production worldwide, but the mechanisms underlying rice resistance to the causal agent Magnaporthe oryzae remain elusive. Therefore, we carried out a transcriptome study on rice early defense response to M. oryzae. We found that the transcriptional profiles of rice compatible and incompatible interactions with M. oryzae were mostly similar, with genes regulated more prominently in the incompatible interactions. The functional analysis showed that the genes involved in signaling and secondary metabolism were extensively up-regulated. In particular, WRKY transcription factor genes were significantly enriched among the up-regulated genes. Overexpressing one of these WRKY genes, OsWRKY47, in transgenic rice plants conferred enhanced resistance against rice blast fungus. Our results revealed the sophisticated transcriptional reprogramming of signaling and metabolic pathways during rice early response to M. oryzae and demonstrated the critical roles of WRKY transcription factors in rice blast resistance.
Conflict of interest statement
Figures
Similar articles
-
Multiple rice microRNAs are involved in immunity against the blast fungus Magnaporthe oryzae.Plant Physiol. 2014 Feb;164(2):1077-92. doi: 10.1104/pp.113.230052. Epub 2013 Dec 13. Plant Physiol. 2014. PMID: 24335508 Free PMC article.
-
The durably resistant rice cultivar Digu activates defence gene expression before the full maturation of Magnaporthe oryzae appressorium.Mol Plant Pathol. 2016 Apr;17(3):354-68. doi: 10.1111/mpp.12286. Epub 2015 Jul 14. Mol Plant Pathol. 2016. PMID: 26095454 Free PMC article.
-
Comparative transcriptome profiling of the early response to Magnaporthe oryzae in durable resistant vs susceptible rice (Oryza sativa L.) genotypes.PLoS One. 2012;7(12):e51609. doi: 10.1371/journal.pone.0051609. Epub 2012 Dec 12. PLoS One. 2012. PMID: 23251593 Free PMC article.
-
Oscillating Transcriptome during Rice-Magnaporthe Interaction.Curr Issues Mol Biol. 2016;19:99-120. Epub 2015 Sep 11. Curr Issues Mol Biol. 2016. PMID: 26363736 Review.
-
[Recent advances in understanding the innate immune mechanisms and developing new disease resistance breeding strategies against the rice blast fungus Magnaporthe oryzae in rice].Yi Chuan. 2014 Aug;36(8):756-65. doi: 10.3724/SP.J.1005.2014.0756. Yi Chuan. 2014. PMID: 25143273 Review. Chinese.
Cited by
-
OsWRKY93 Dually Functions Between Leaf Senescence and in Response to Biotic Stress in Rice.Front Plant Sci. 2021 Mar 22;12:643011. doi: 10.3389/fpls.2021.643011. eCollection 2021. Front Plant Sci. 2021. PMID: 33828575 Free PMC article.
-
Differential Regulation of Maize and Sorghum Orthologs in Response to the Fungal Pathogen Exserohilum turcicum.Front Plant Sci. 2021 May 25;12:675208. doi: 10.3389/fpls.2021.675208. eCollection 2021. Front Plant Sci. 2021. PMID: 34113371 Free PMC article.
-
CaWRKY22 Acts as a Positive Regulator in Pepper Response to RalstoniaSolanacearum by Constituting Networks with CaWRKY6, CaWRKY27, CaWRKY40, and CaWRKY58.Int J Mol Sci. 2018 May 10;19(5):1426. doi: 10.3390/ijms19051426. Int J Mol Sci. 2018. PMID: 29747470 Free PMC article.
-
OsWRKY80-OsWRKY4 Module as a Positive Regulatory Circuit in Rice Resistance Against Rhizoctonia solani.Rice (N Y). 2016 Dec;9(1):63. doi: 10.1186/s12284-016-0137-y. Epub 2016 Nov 25. Rice (N Y). 2016. PMID: 27888467 Free PMC article.
-
The WRKY45-2 WRKY13 WRKY42 transcriptional regulatory cascade is required for rice resistance to fungal pathogen.Plant Physiol. 2015 Mar;167(3):1087-99. doi: 10.1104/pp.114.256016. Epub 2015 Jan 26. Plant Physiol. 2015. PMID: 25624395 Free PMC article.
References
-
- Chisholm ST, Coaker G, Day B, Staskawicz BJ (2006) Host-microbe interactions: Shaping the evolution of the plant immune response. Cell 124: 803–814. - PubMed
-
- Jones JDG, Dangl JL (2006) The plant immune system. Nature 444: 323–329. - PubMed
-
- Dodds PN, Rathjen JP (2010) Plant immunity: towards an integrated view of plant-pathogen interactions. Nature Reviews Genetics 11: 539–548. - PubMed
-
- Talbot NJ (2003) On the trail of a cereal killer: Exploring the biology of Magnaporthe grisea . Annu Rev Microbiol 57: 177–202. - PubMed
Publication types
MeSH terms
Substances
LinkOut - more resources
Full Text Sources
Other Literature Sources
Molecular Biology Databases
Research Materials
