

Global taxonomic diversity of living reptiles
- PMID: 23544091
- PMCID: PMC3609858
- DOI: 10.1371/journal.pone.0059741
Global taxonomic diversity of living reptiles
Abstract
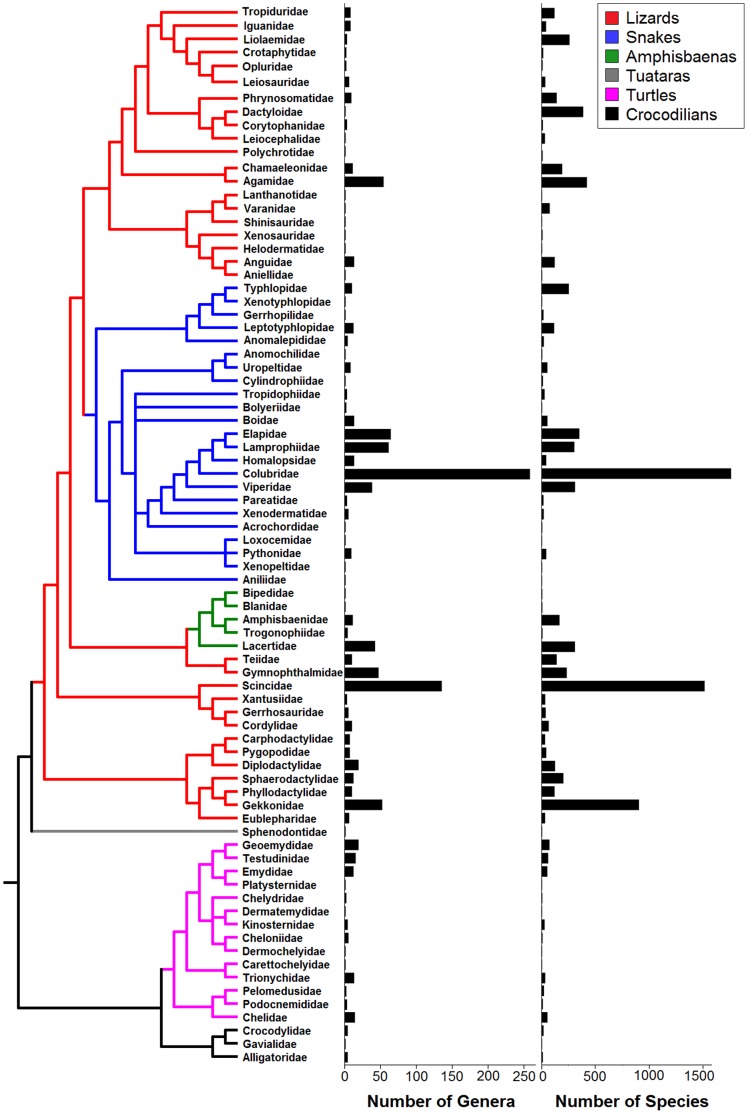
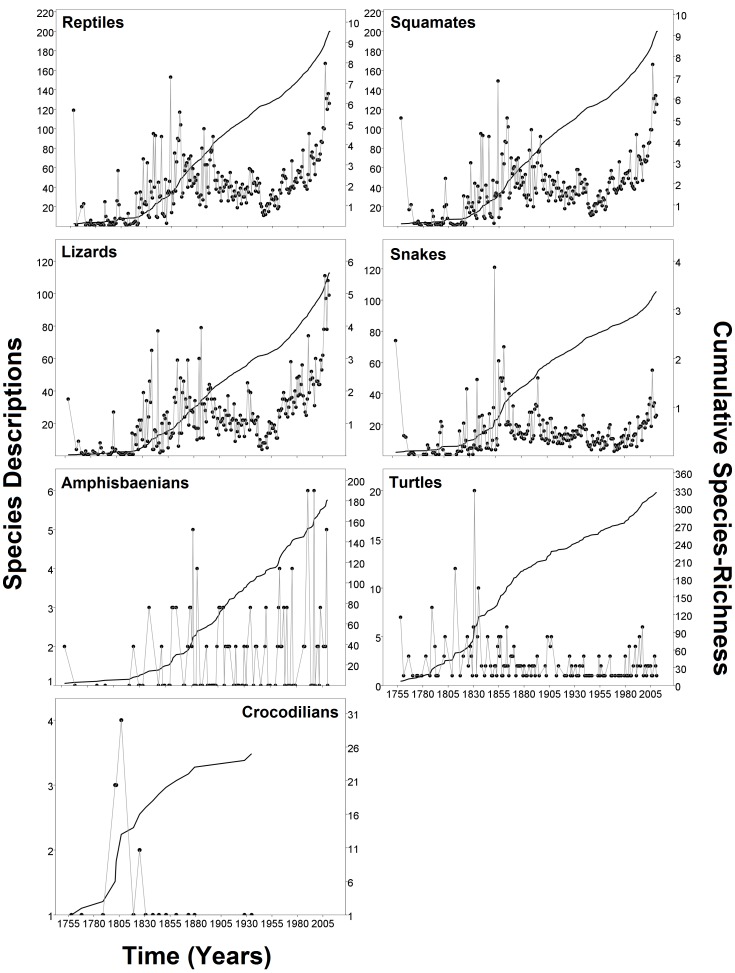
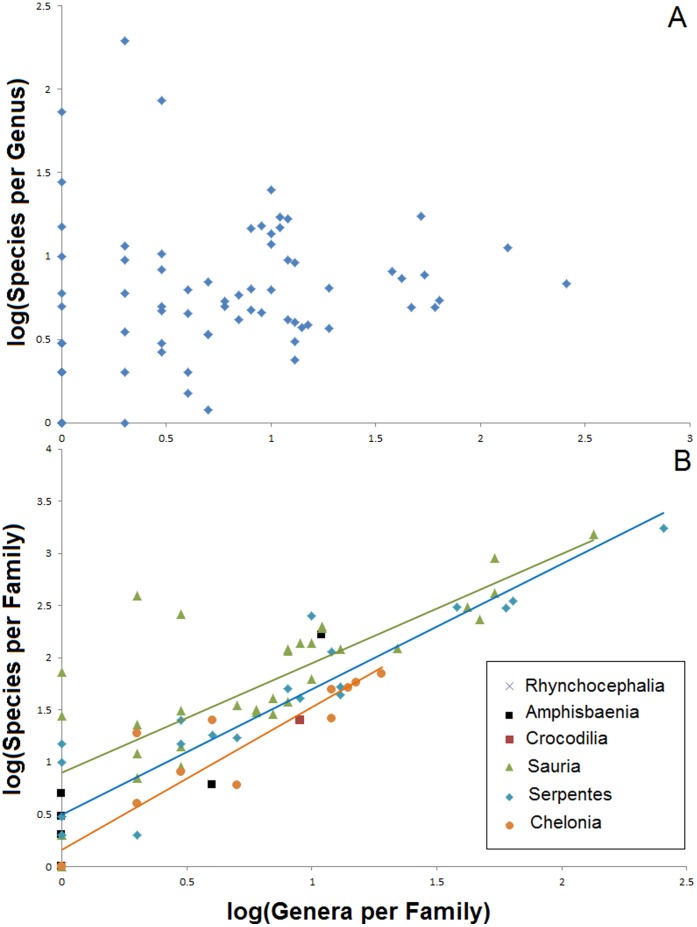
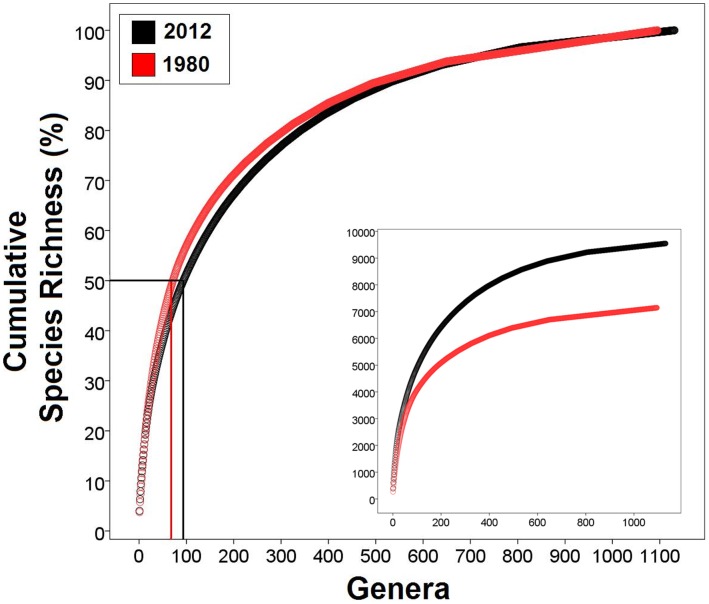
Reptiles are one of the most ecologically and evolutionarily remarkable groups of living organisms, having successfully colonized most of the planet, including the oceans and some of the harshest and more environmentally unstable ecosystems on earth. Here, based on a complete dataset of all the world's diversity of living reptiles, we analyse lineage taxonomic richness both within and among clades, at different levels of the phylogenetic hierarchy. We also analyse the historical tendencies in the descriptions of new reptile species from Linnaeus to March 2012. Although (non-avian) reptiles are the second most species-rich group of amniotes after birds, most of their diversity (96.3%) is concentrated in squamates (59% lizards, 35% snakes, and 2% amphisbaenians). In strong contrast, turtles (3.4%), crocodilians (0.3%), and tuataras (0.01%) are far less diverse. In terms of species discoveries, most turtles and crocodilians were described early, while descriptions of lizards, snakes and amphisbaenians are multimodal with respect to time. Lizard descriptions, in particular, have reached unprecedented levels during the last decade. Finally, despite such remarkably asymmetric distributions of reptile taxonomic diversity among groups, we found that the distributions of lineage richness are consistently right-skewed, with most clades (monophyletic families and genera) containing few lineages (monophyletic genera and species, respectively), while only a few have radiated greatly (notably the families Colubridae and Scincidae, and the lizard genera Anolis and Liolaemus). Therefore, such consistency in the frequency distribution of richness among clades and among phylogenetic levels suggests that the nature of reptile biodiversity is fundamentally fractal (i.e., it is scale invariant). We then compared current reptile diversity with the global reptile diversity and taxonomy known in 1980. Despite substantial differences in the taxonomies (relative to 2012), the patterns of lineage richness remain qualitatively identical, hence reinforcing our conclusions about the fractal nature of reptile biodiversity.
Conflict of interest statement
Figures

References
-
- Sumida SS, Martin KLM (1997) Amniote origins. Completing the transition to land. San Diego: Academic Press.
-
- Reisz RR (1997) The origin and early evolutionary history of amniotes. Trends in Ecology & Evolution 12: 218–222. - PubMed
-
- Pough FH, Andrews RM, Cadle JE, Crump ML, Savitzky AH, et al.. (2004) Herpetology. New Jersey: Pearson, Prentice Hall.
-
- Vitt LJ, Caldwell JP (2009) Herpetology. Massachusetts: Academic Press.
MeSH terms
LinkOut - more resources
Full Text Sources
Other Literature Sources
