. 2013;8(3):e59934.
doi: 10.1371/journal.pone.0059934. Epub 2013 Mar 27.

Increased antigen specific T cell numbers in the absence of altered migration or division rates as a result of mucosal cholera toxin administration

Affiliations

Increased antigen specific T cell numbers in the absence of altered migration or division rates as a result of mucosal cholera toxin administration

Maria Kaparakis-Liaskos et al. PLoS One. 2013.

Abstract

Cholera toxin (CT) is a mucosal adjuvant capable of inducing strong immune responses to co-administered antigens following oral or intranasal immunization of mice. To date, the direct effect of CT on antigen-specific CD4(+) T cell migration and proliferation profiles in vivo is not well characterized. In this study, the effect of CT on the migration pattern and proliferative responses of adoptively transferred, CD4(+) TCR transgenic T cells in orally or intranasally vaccinated mice, was analyzed by flow cytometry. GFP-expressing or CFSE-labeled OT-II lymphocytes were adoptively transferred to naïve C57BL/6 mice, and mice were subsequently vaccinated with OVA with or without CT via the oral or intranasal route. CT did not alter the migration pattern of antigen-specific T cells, regardless of the route of immunization, but increased the number of transgenic CD4(+) T cells in draining lymphoid tissue. This increase in the number of transgenic CD4(+) T cells was not due to cells undergoing more rounds of cellular division in vivo, suggesting that CT may exert an indirect adjuvant effect on CD4(+) T cells. The findings reported here suggest that CT functions as a mucosal adjuvant by increasing the number of antigen specific CD4(+) T cells independent of their migration pattern or kinetics of cellular division.


Conflict of interest statement

Competing Interests: Dr Martin Pearse is employed by CSL Ltd. There are no patents, products in development or marketed products that work from this study will impact, therefore, Dr Pearse and CSL Ltd have no financial gain from this research. Furthermore, Dr Pearse’s, association with CSL has no impact on the design, analysis and interpretation of the data. Some of the findings reported in this manuscript were performed during Dr Kaparakis-Liaskos PhD studies, during which time Dr Pearse was an associate PhD supervisor. Hence, he is an author for his intellectual contribution to this study. The authors would like to emphasize that Dr Pearse’s employment by CSL does not alter the authors' adherence in any way to all the PLOS ONE policies on sharing material.

Figures

Figure 1
Figure 1. Oral administration of CT increases the number of antigen-specific CD4+ T cells without altering their migration pattern in vivo.
GFP+/− OT-II lymphocytes (5×10⁶) were adoptively transferred to C57BL/6 recipient mice and one day later the mice were orally immunized with PBS (A, C) or 10 µg CT (B, D). One (A–B) and five days (C–D) after oral immunization, the number of GFP+/− OT-II cells (identified as GFP+CD4+) present in the spleen (SPL), mesenteric lymph nodes (MLN), peripheral lymph nodes (PLN), Peyers patches (PP), gut, intraepithelial lymphocyte compartment (IEL) and stomach (STO) was determined by flow cytometry. The lymphocyte preparations from the IEL, STO and PP of mice were pooled to obtain sufficient numbers of cells. Represented are the results from individual mice, as well as the average number of lymphocytes per group (dash, n = 3). Lymphocytes from the PP of mice were pooled (n = 3 each). Results are representative of one out of three independently performed experiments. E–G: GFP+/− OT-II lymphocytes (5×10⁶) were adoptively transferred to C57BL/6 recipient mice. One day later, recipient mice were orally immunized with either PBS, 10 µg CT, 15 mg OVA or 15 mg OVA with 10 µg CT. Five days after oral immunization, the number of transgenic GFP+/− OT-II (GFP, Vα2, CD4+) cells present in MLN (E), spleen (F) and PP (G) was determined by flow cytometry. E–F: Symbols represent results from individual mice obtained in 2 independently performed experiments, the columns represent the mean of each treatment group. G: symbols represent the results from three independent experiments each performed with PP cells pooled from 3 mice, the column represents the mean of the 3 experiments. *denotes P<0.05 (one way ANOVA).
Figure 2
Figure 2. CT induces an increase in the number of dividing OT-II cells without altering the number of cellular divisions in the draining MLN.
CFSE-labeled OT-II cells (5×10⁶) were i.v. injected into recipient C57BL/6 mice. One day later, mice were orally immunized with either PBS (n = 3), 10 µg CT (n = 3), 15 mg OVA (n = 10) or 10 µg CT with 15 mg OVA (n = 10). Five days after immunization, MLN were removed and dilution of CFSE from OT-II cells as a measurement of cellular division was analyzed using flow cytometry. Propidium iodide was used to exclude dead cells from the analysis. A: Shown is a representative histogram from one individual animal of each group. B: Mice were analyzed for the total number of CFSE-labeled CD4+ T cells within each cellular division. Shown are OVA fed (filled squares) and CT with OVA fed (filled circle) mice. Data is represented as the mean ± SEM of each group of mice (n = 10). *denotes P<0.05, Students’ t-test. C) The total number of CFSE-labeled, viable CD4+ T cells per 5×10⁵ lymphocytes is shown. All data are representative of 2 independent experiments and represented as the mean ± SEM of each group of mice.
Figure 3
Figure 3. Intranasal administration of CT with OVA increases the number of GFP OT-II cells in draining lymph node.
GFP+/− OT-II cells were injected into C57BL/6 mice. One day later, mice were i.n. immunized with PBS, 5 µg CT, 5 µg CT with 25 µg OVA or 25 µg OVA alone. Five days after immunization, the number of GFP+/− OT-II (GFP, Vα2, CD4+) cells in the PLN, MLN, cervical lymph nodes (CLN) and mediastinal lymph nodes (MeLN) were enumerated by flow cytometry. Shown are the number of cells detected in the PLN, MLN and CLN of individual mice (symbols). The MeLN of groups of 3 mice were pooled (each symbol representing a pool of 3 mice). The columns indicate the average of each treatment group. Data were obtained from 2 individual experiments. *denotes P<0.05 (one way ANOVA).
Figure 4
Figure 4. Intranasal administration of OVA with the adjuvant CT results in an increased proliferation of CFSE labeled OT-II cells in vivo.
CFSE -labeled OT-II cells (5×10⁶) were adoptively transferred into C57BL/6 mice. One day after transfer, mice were i.n immunized with either PBS, CT, OVA or CT with OVA (n = 3 per group). Five days after immunization, MeLN (pooled), CLN and MLN were removed and analyzed using flow cytometry to determine the presence and number of divisions undergone by CFSE OT-II cells in vivo. Propidium iodide (PI) was used to exclude dead cells from the analysis. (A) Shown is a representative histogram from one individual animal of each group. The number of dividing CFSE-labeled, PI negative, Vα2+, CD4+ T cells in the MeLN (B) and CLN (C) was determined per 5×10e5 lymphocytes. Data are representative of 3 individual experiments. *denotes P<0.05, Students’ t-test.
Figure 5
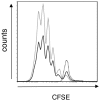
Figure 5. Increased proliferation of OT-II cells stimulated with CT and OVA pulsed BMDCs.
BMDC were pulsed with CT or media (dashed line), OVA peptide (black line) or OVA peptide with CT (grey line) and cultured with CFSE-labeled OT-II lymphocytes for 4 days. Lymphocyte proliferation was determined using flow cytometry. PI was used to exclude dead cells from the analysis. The flow cytometry plots represent cells harvested from triplicate cultures. Data are representative of 2 independent experiments.

Similar articles

References

    1. Lycke N, Holmgren J (1986) Strong adjuvant properties of cholera toxin on gut mucosal immune responses to orally presented antigens. Immunology. 59: 301–308. - PMC - PubMed
    1. Northrup RS, Fauci AS (1972) Adjuvant effect of cholera enterotoxin on the immune response of the mouse to sheep red blood cells. J Infect Dis. 125: 672–3. - PubMed
    1. Wu HY, Nikolova EB, Beagley KW, Eldridge JH, Russell MW (1997) Development of antibody-secreting cells and antigen-specific T cells in cervical lymph nodes after intranasal immunization. Infect Immun. 65: 227–35. - PMC - PubMed
    1. Raghavan S, Ostberg AK, Flach CF, Ekman A, Blomquist M, et al. (2010) Sublingual immunization protects against Helicobacter pylori infection and induces T and B cell responses in the stomach. Infection and immunity. [Research Support, Non-U.S. Gov’t]. 78: 4251–60. - PMC - PubMed
    1. Holmgren J, Lindholm L, Lonnroth I (1974) Interaction of cholera toxin and toxin derivatives with lymphocytes. I. Binding properties and interference with lectin-induced cellular stimulation. The Journal of experimental medicine. 139: 801–19. - PMC - PubMed

Publication types

MeSH terms

LinkOut - more resources