

Conservation priorities for Prunus africana defined with the aid of spatial analysis of genetic data and climatic variables
- PMID: 23544118
- PMCID: PMC3609728
- DOI: 10.1371/journal.pone.0059987
Conservation priorities for Prunus africana defined with the aid of spatial analysis of genetic data and climatic variables
Abstract
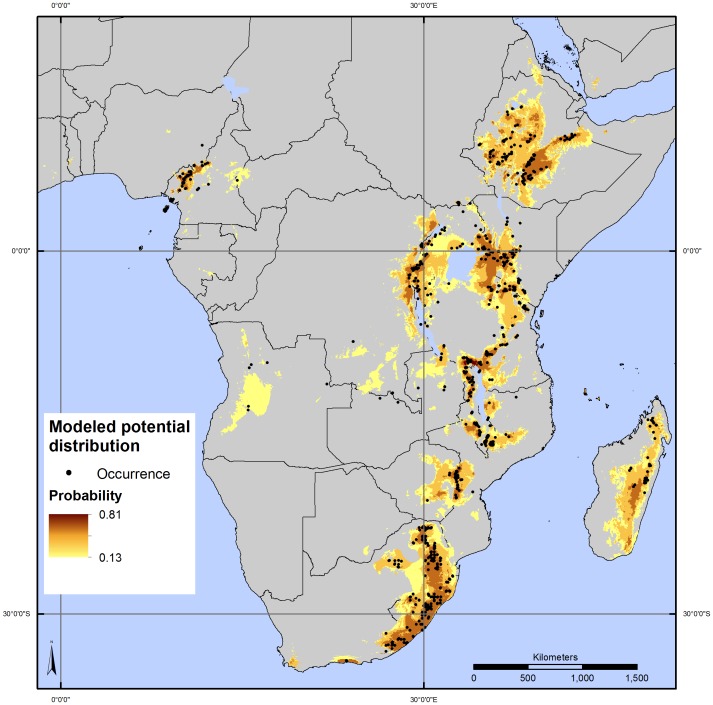
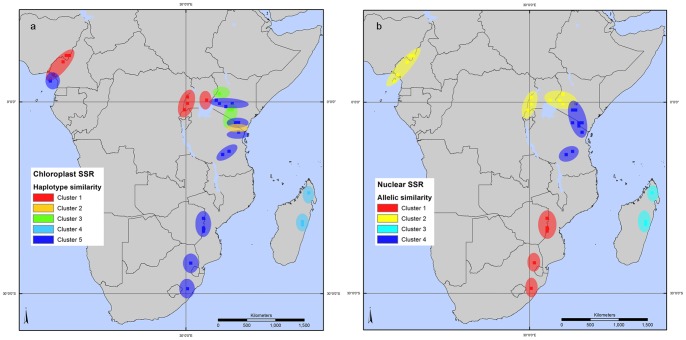
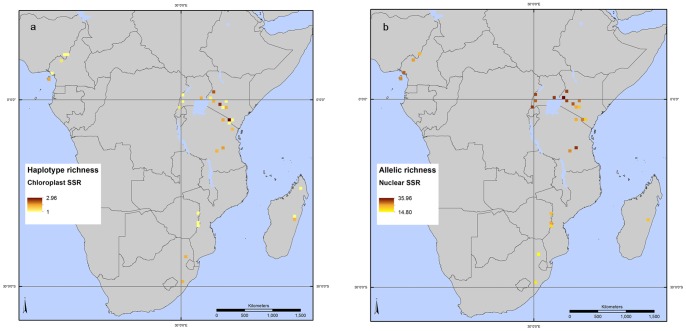
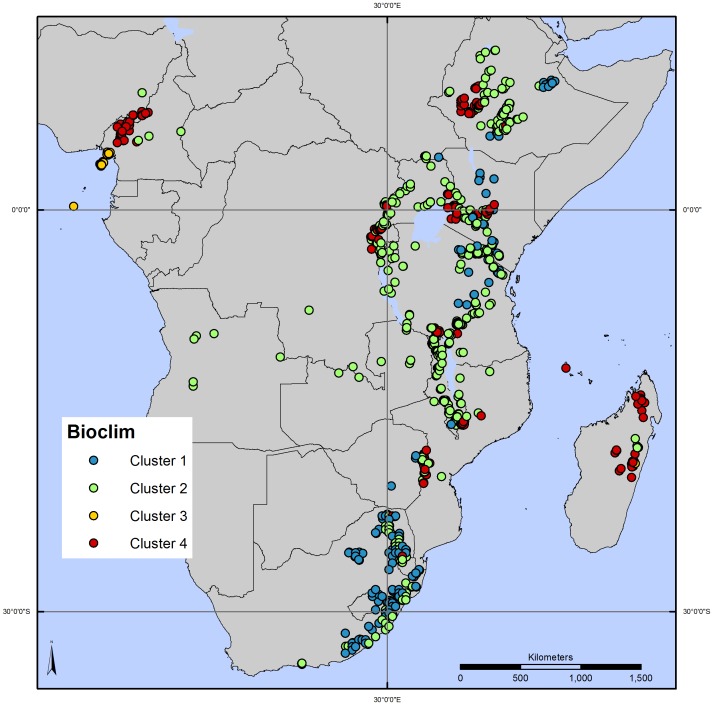
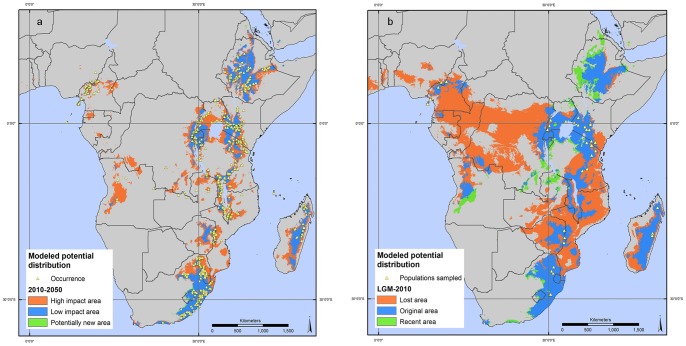
Conservation priorities for Prunus africana, a tree species found across Afromontane regions, which is of great commercial interest internationally and of local value for rural communities, were defined with the aid of spatial analyses applied to a set of georeferenced molecular marker data (chloroplast and nuclear microsatellites) from 32 populations in 9 African countries. Two approaches for the selection of priority populations for conservation were used, differing in the way they optimize representation of intra-specific diversity of P. africana across a minimum number of populations. The first method (S1) was aimed at maximizing genetic diversity of the conservation units and their distinctiveness with regard to climatic conditions, the second method (S2) at optimizing representativeness of the genetic diversity found throughout the species' range. Populations in East African countries (especially Kenya and Tanzania) were found to be of great conservation value, as suggested by previous findings. These populations are complemented by those in Madagascar and Cameroon. The combination of the two methods for prioritization led to the identification of a set of 6 priority populations. The potential distribution of P. africana was then modeled based on a dataset of 1,500 georeferenced observations. This enabled an assessment of whether the priority populations identified are exposed to threats from agricultural expansion and climate change, and whether they are located within the boundaries of protected areas. The range of the species has been affected by past climate change and the modeled distribution of P. africana indicates that the species is likely to be negatively affected in future, with an expected decrease in distribution by 2050. Based on these insights, further research at the regional and national scale is recommended, in order to strengthen P. africana conservation efforts.
Conflict of interest statement
Figures

References
-
- Faith DP (1996) Conservation priorities and phylogenetic patterns. Conserv Biol 10: 1286–1289.
-
- Metrick A, Weitzman ML (1998) Conflicts and choices in biodiversity preservation. J Econ Perspect 12: 21–34.
-
- Solow A, Polasky S, Broadus J (1993) On the measurement of biological diversity. J Environ Econ Manage 24: 60–68.
-
- van der Heide CM, van den Bergh JCJM, van Ierland EC (2005) Extending Weitzman’s economic ranking of biodiversity protection: combining ecological and genetic considerations. Ecol Econ 55: 218–223.
-
- Weitzman ML (1998) The Noah’s ark problem. Econometrica 66: 1279–1298.
Publication types
MeSH terms
LinkOut - more resources
Full Text Sources
Other Literature Sources
Medical
Miscellaneous
