. 2013 Feb;131(2):194-204.
doi: 10.1001/2013.jamaophthalmol.271.

A novel rodent model of posterior ischemic optic neuropathy

Affiliations

A novel rodent model of posterior ischemic optic neuropathy

Yan Wang et al. JAMA Ophthalmol. 2013 Feb.

Abstract

Objectives: To develop a reliable, reproducible rat model of posterior ischemic optic neuropathy (PION) and study the cellular responses in the optic nerve and retina.

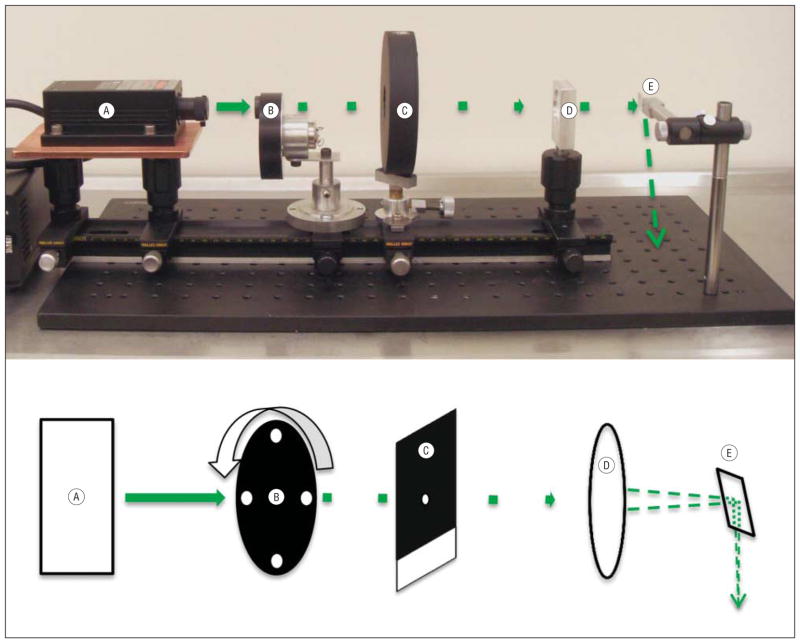
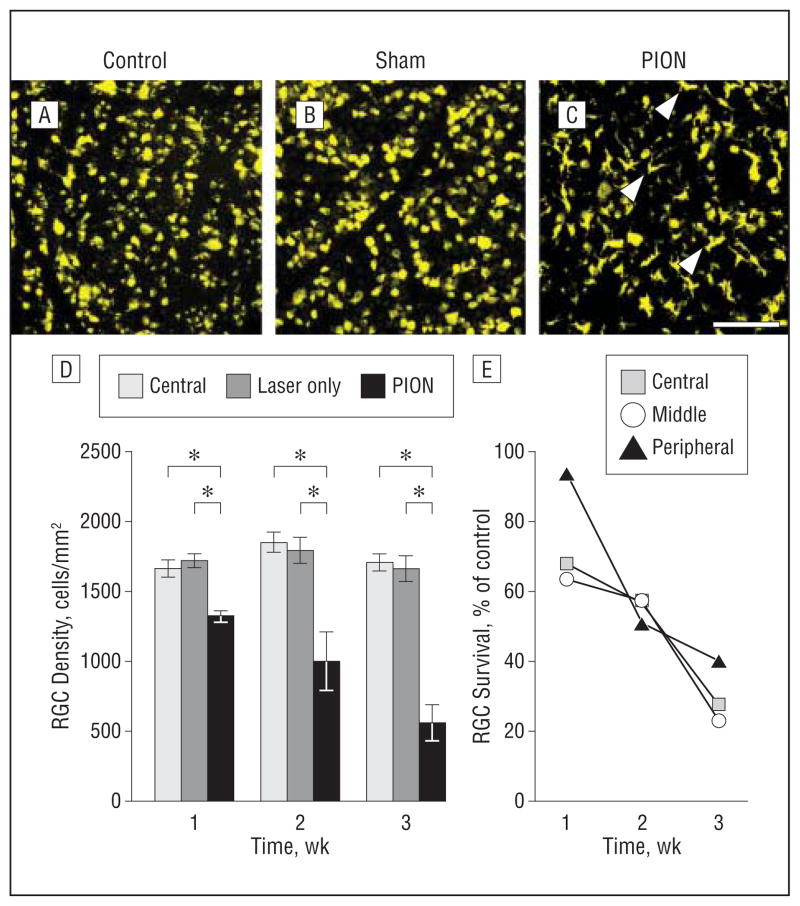
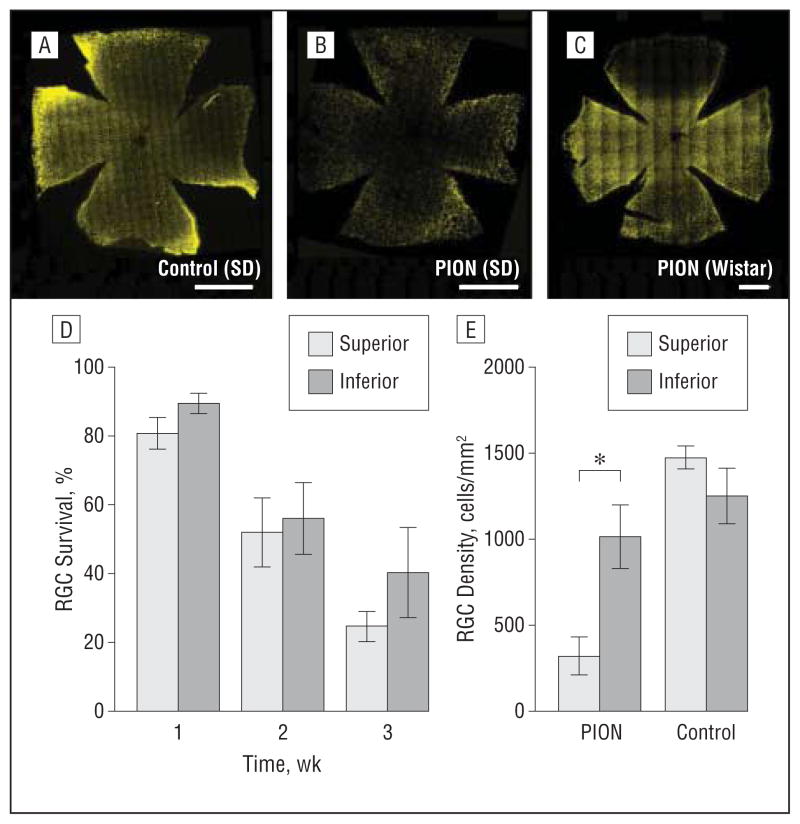
Methods: Posterior ischemic optic neuropathy was induced in adult rats by photochemically induced ischemia. Retinal and optic nerve vasculature was examined by fluorescein isothiocyanate–dextran extravasation. Tissue sectioning and immunohistochemistry were used to investigate the pathologic changes. Retinal ganglion cell survival at different times after PION induction, with or without neurotrophic application, was quantified by fluorogold retrograde labeling.

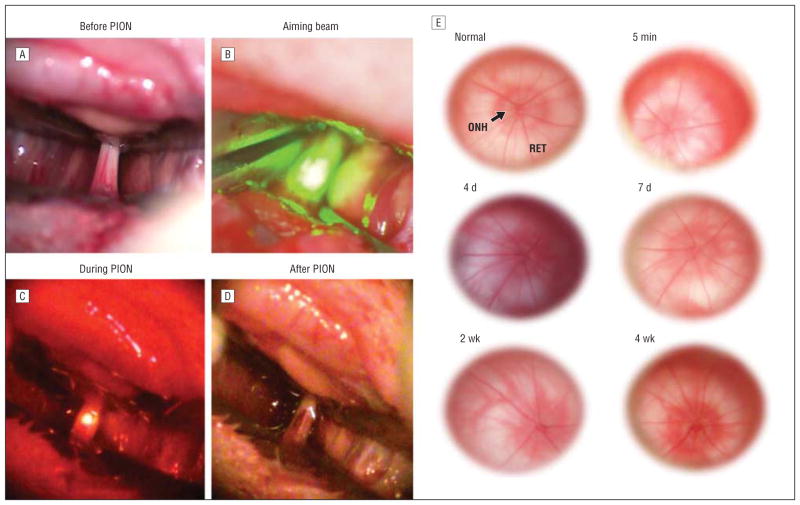
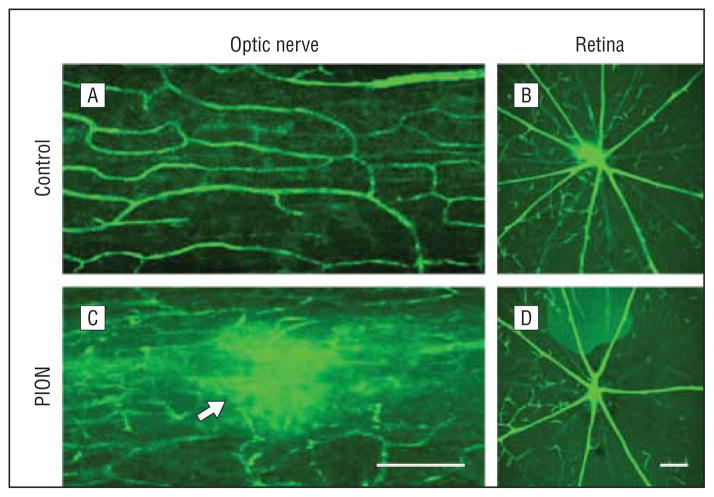
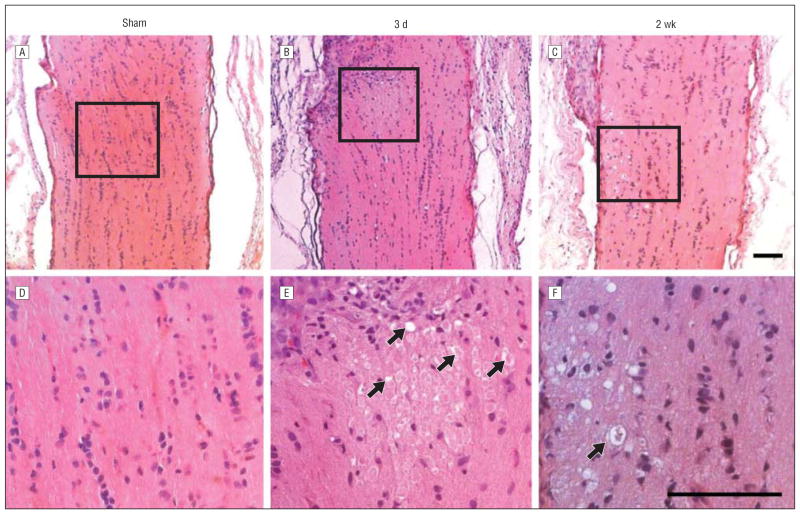
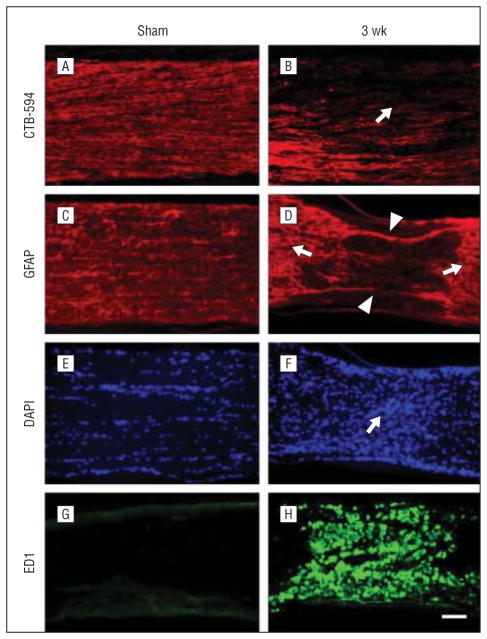
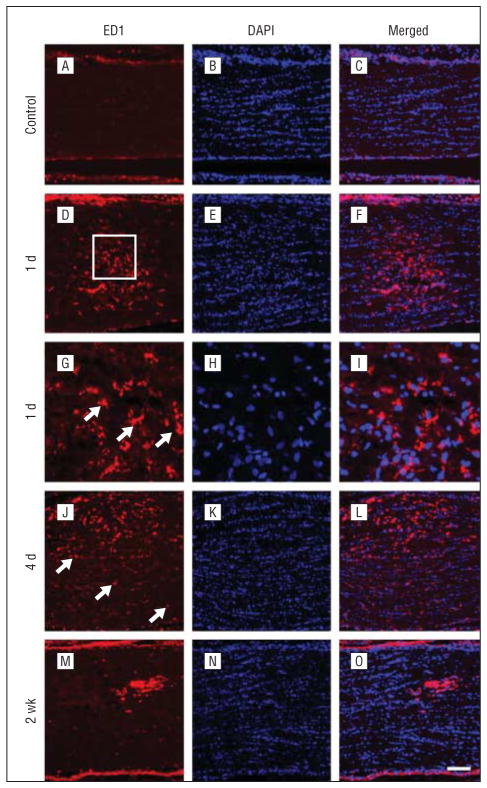
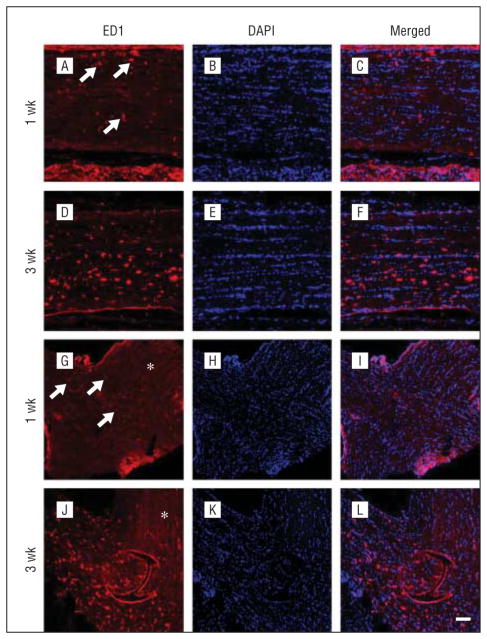
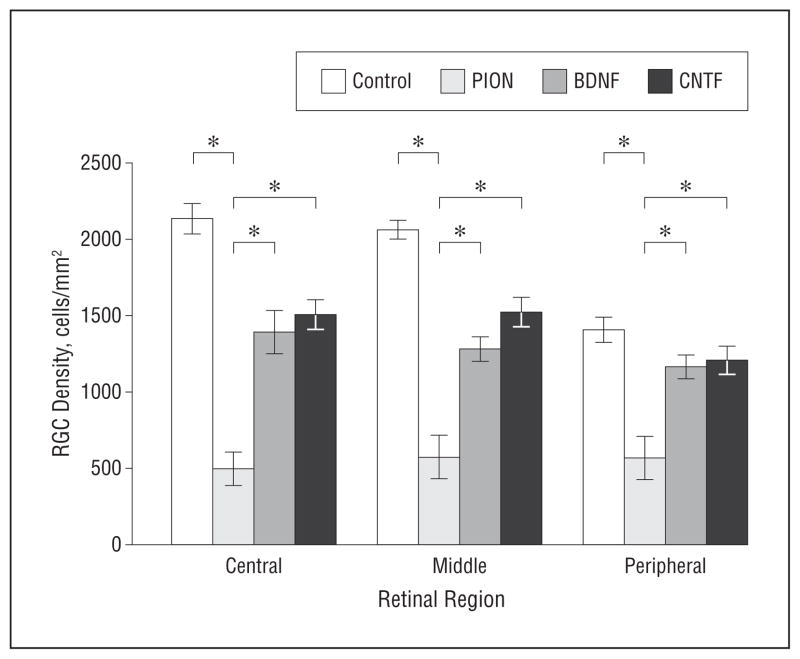
Results: Optic nerve injury was confirmed after PION induction, including local vascular leakage, optic nerve edema, and cavernous degeneration. Immunostaining data revealed microglial activation and focal loss of astrocytes, with adjacent astrocytic hypertrophy. Up to 23%, 50%, and 70% retinal ganglion cell loss was observed at 1 week, 2 weeks, and 3 weeks, respectively, after injury compared with a sham control group. Experimental treatment by brain-derived neurotrophic factor and ciliary neurotrophic factor remarkably prevented retinal ganglion cell loss in PION rats. At 3 weeks after injury, more than 40% of retinal ganglion cells were saved by the application of neurotrophic factors.

Conclusions: Rat PION created by photochemically induced ischemia is a reproducible and reliable animal model for mimicking the key features of human PION.

Clinical relevance: The correspondence between the features of this rat PION model to those of human PION makes it an ideal model to study the pathophysiologic course of the disease, most of which remains to be elucidated. Furthermore, it provides an optimal model for testing therapeutic approaches for optic neuropathies.


Figures

Figure 1
Figure 1
Image and corresponding schematic diagram of the laser irradiation system and laser pathway. The laser irradiation system consists of a 532-nm continuous-wave Nd:YAG laser (with power supply, far left) (A), a custom-made beam chopper (B), a mechanical shutter and corresponding shutter drive timer (C), a 25-cm focal length spherical lens (D), and a right-angle prism to reflect the beam downward onto the optic nerve (E). The beam is designated by a solid green line from A to B; afterward, the beam is shown as chopped. The tip of the last dashed arrow (far right) on the mounting plate shows the approximate beam position, as projected by the right-angle prism, below its focal point on the optic nerve.
Figure 2
Figure 2
Rat surgical procedure and optic nerve photographs following posterior ischemic optic neuropathy (PION) induction. A, 5 mm of retrobulbar optic nerve surrounded by peripheral microvessels is exposed. B, The aiming beam is centered on the exposed optic nerve segment. C, After beam positioning, 90 seconds of laser irradiation with an average intensity of 16 W/cm2 was administered to erythrosin B–infused rats. Orange-filtered fluorescence arose only from vessels exposed directly to the laser beam. D, Slight hemorrhage may be observed immediately after PION induction. E, Funduscopic examination of optic nerve heads reveals no obvious differences immediately following or at 4 or 7 days or 2 or 4 weeks after PION induction. ONH indicates optic nerve head; RET, retina.
Figure 3
Figure 3
Optic nerve and retinal circulation evaluated by fluorescein isothiocyanate–dextran perfusion in vivo. A, Optic nerve vasculature in a sham-treated animal shows a clear capillary network and normal circulation. C, One hour after posterior ischemic optic neuropathy (PION) induction, fluorescein dye leakage is visible in the lesion area (arrow) and circulation appears compromised. The intraretinal vasculature in both sham-treated (B) and PION-treated (D) eyes 1 hour after surgical procedures appears unaffected, without leakage or interruption. Scale bars=200 μm.
Figure 4
Figure 4
Histologic changes of optic nerve after posterior ischemic optic neuropathy (PION). Posterior optic nerves appear normal 3 days after sham control surgical procedures (laser only/no erythrosin B) (A and D). B, However, 3 days after PION, an area of tissue edema is present. C, Atrophy and degenerative changes appear in posterior optic nerves 2 weeks after PION induction. E, Higher magnification of the boxed region in part B reveals swollen cells and caverns (arrows) within the edema area. F, Higher magnification of the boxed region in part C shows marked degeneration of neural tissue in the infarct region, producing an appearance resembling cavernous degeneration (arrow). Scale bars=100 μm.
Figure 5
Figure 5
Axon degeneration and glia activation after posterior ischemic optic neuropathy (PION). Longitudinal sections of optic nerve labeled for CTB-594 (axons), glial fibrillary acidic protein (GFAP; astrocyte processes), 4′6-diamidino-2-phenylindole (DAPI; nuclear), and ED1 (microglia/macrophages) in the sham-treated and PION-induced optic nerve. Anterograde labeling of retinal ganglion cell axons with CTB-594 (A and B). Axonal fluorescence appears dense and uniform in sham-operated animals (A, laser only/no erythrosin B). The fluorescence becomes much weaker in the lesioned area of the optic nerve at 3 weeks after PION induction (B, arrow). In the sham-treated optic nerve (laser only/no erythrosin B), astrocytic processes are transversely arranged (C); 3 weeks after PION, there was a loss of processes in the lesioned area (D, arrowheads), with adjacent astrocytic hypertrophy (D, arrows). The hypercellularity indicated by DAPI nuclear staining was found in the lesioned area of PION-induced instead of sham-treated optic nerve (E and F, arrow). Dramatic upregulation of ED1 staining is observed in the lesioned area in some animals 3 weeks after PION (G and H). Scale bar=100 μm.
Figure 6
Figure 6
Temporal characterization of microglia/macrophage activation in the optic nerve after posterior ischemic optic neuropathy. Sections taken from the proximal optic nerve in representative animals are shown. In the control rats, no ED1-labeled microglia/macrophages are detected (A–C). B, Nuclei are labeled by 4′6-diamidino-2-phenylindole (DAPI). At 1 day, many ED1-positive microglia/macrophages are observed but are restricted to the infarct core (D–F). G, Higher magnification of the boxed region reveals ameboid-shaped ED1-positive cells (arrows). An increased number of ED1-positive microglia/macrophages is present in the infarct core at 4 days (J–L). Scattered cells in the peri-ischemic area are also observed ( J, arrows). However, by 2 weeks, the accumulation of ED1-positive cells decreases in the infarct core (M–O). Scale bar=100 μm in A–F and J–O; 25 μm in G–I.
Figure 7
Figure 7
Temporal characterization of microglia/macrophage activation in the distal optic nerve and optic chiasm. Sections taken from representative animals euthanized at 1 week (A–C and G–I) and 3 weeks (D–F and J–L) after the induction of PION are shown. Some ED1-positive microglia/macrophages (A, arrows) are present in the distal optic nerve at 1 week after posterior ischemic optic neuropathy induction (A–C). A few ED1-positive cells in the optic chiasm are also found at this point (G–I, arrows). Three weeks after surgery, an increased number of ED1-positive microglia/macrophages is noted both in the distal optic nerve (D–F) and optic chiasm (J–L). No ED1-positive microglia/macrophages are detected in the contralateral optic nerve (G and J, asterisk). Scale bar=100 μm. DAPI indicates 4′6-diamidino-2-phenylindole.
Figure 8
Figure 8
Temporal characterization of retinal ganglion cell (RGC) survival after posterior ischemic optic neuropathy (PION). Retinal ganglion cells retrograde labeled with fluorogold and representative images of flat mounted retinal segments approximately 2 mm from the optic disk are shown (A–C). In the normal control (A) and sham-treated (B, laser only/no erythrosin B) eyes, RGCs are labeled with punctate fluorescence. C, Two weeks after PION induction, the number of fluorogold-labeled RGCs is markedly reduced. Some of the ameboid, densely fluorescent cells are microglia, which phagocytose fluorogold from dead RGCs (arrowheads). D, RGC quantification demonstrated no difference in the number of fluorogold-labeled RGCs between normal control animals and sham-treated animals at different points after surgery. However, the number of fluorogold-labeled RGCs is decreased in a time-dependent manner after PION induction. These decreases are statistically significant (error bars indicate mean [standard error of the mean]; *P<.001; 1-way analysis of variance; n=4 animals per group). E, RGC survival rate at different points after injury in the central, middle, and peripheral areas of the retina. Scale bar=100 μm.
Figure 9
Figure 9
Spatial characterization of retinal ganglion cell (RGC) death after posterior ischemic optic neuropathy (PION) induction. Representative mosaic images of whole flat mounted retinas are shown (A–C). At 2 weeks after PION induction, a decreased number of fluorogold-labeled RGCs is detected throughout the retina (B) compared with the contralateral retina (A) in Sprague-Dawley (SD) rats. C, In Wistar rats, a dramatic decrease of fluorogold-labeled RGCs is restricted to the superior portion of the retina 2 weeks after PION induction. The spread of fluorogold-positive cells is confirmed by counting those cells in the superior and inferior portions of the retina (D and E). D, RGC death was uniform throughout the retina at different points in SD rats. E, In Wistar rats, RGC density in the superior portion of the retina is significantly less than in the inferior portion at 2 weeks after PION (error bars indicate mean [standard error of the mean]; *P<.001; t test comparing superior and inferior retinas within each strain; n=3 animals per group). Scale bar=1000 μm.
Figure 10
Figure 10
Effect of brain-derived neurotrophic factor (BDNF) or ciliary neurotrophic factor (CNTF) on retinal ganglion cell (RGC) survival at 3 weeks after posterior ischemic optic neuropathy (PION) induction. The average density of surviving fluorogold-positive RGCs in the central, middle, and peripheral regions of the retina after PION and multiple intravitreal injections of BDNF or CNTF is shown. In animals receiving 3 injections (days 3, 7, and 14), BDNF and CNTF both significantly enhance RGC survival (error bars indicate mean [standard error of the mean]; *P<.01; 1-way analysis of variance, BDNF or CNTF compared with the PION-only group; n=4 animals per group).

References

    1. Rucker JC, Biousse V, Newman NJ. Ischemic optic neuropathies. Curr Opin Neurol. 2004;17(1):27–35. - PubMed
    1. Hayreh SS. Posterior ischaemic optic neuropathy: clinical features, pathogenesis, and management. Eye (Lond) 2004;18(11):1188–1206. - PubMed
    1. Hayreh SS. Ischemic optic neuropathy. Prog Retin Eye Res. 2009;28(1):34–62. - PubMed
    1. Hayreh SS. Inter-individual variation in blood-supply of the optic nerve head: its importance in various ischemic disorders of the optic nerve head, and glaucoma, low-tension glaucoma and allied disorders. Doc Ophthalmol. 1985;59 (3):217–246. - PubMed
    1. Jacobson DM, Vierkant RA, Belongia EA. Nonarteritic anterior ischemic optic neuropathy: a case-control study of potential risk factors. Arch Ophthalmol. 1997;115(11):1403–1407. - PubMed

Publication types

MeSH terms

Substances