

Quantifying tumour heterogeneity with CT
- PMID: 23545171
- PMCID: PMC3613789
- DOI: 10.1102/1470-7330.2013.0015
Quantifying tumour heterogeneity with CT
Abstract
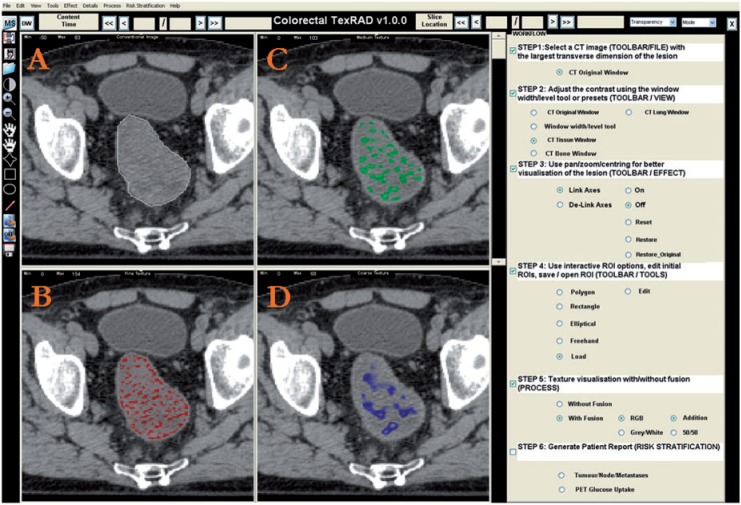
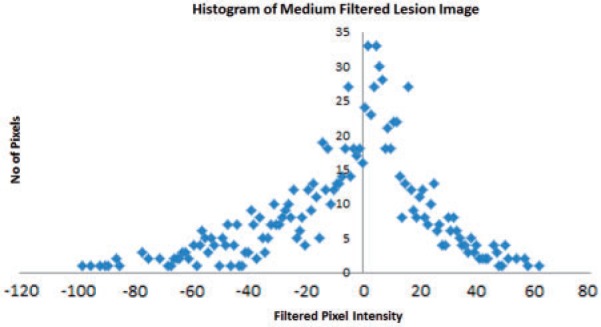
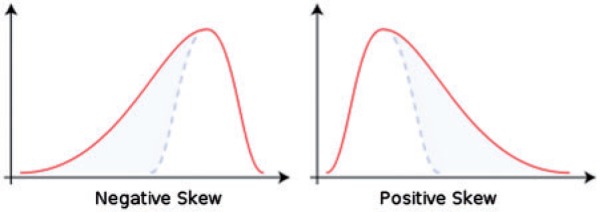
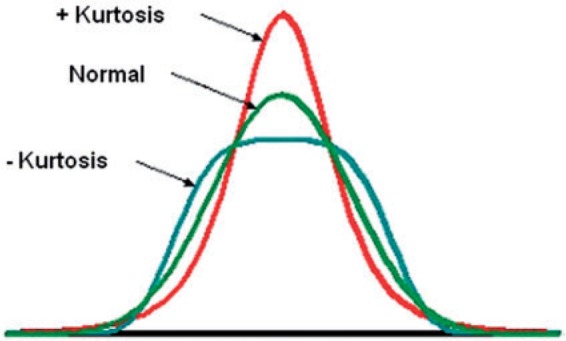
Heterogeneity is a key feature of malignancy associated with adverse tumour biology. Quantifying heterogeneity could provide a useful non-invasive imaging biomarker. Heterogeneity on computed tomography (CT) can be quantified using texture analysis which extracts spatial information from CT images (unenhanced, contrast-enhanced and derived images such as CT perfusion) that may not be perceptible to the naked eye. The main components of texture analysis can be categorized into image transformation and quantification. Image transformation filters the conventional image into its basic components (spatial, frequency, etc.) to produce derived subimages. Texture quantification techniques include structural-, model- (fractal dimensions), statistical- and frequency-based methods. The underlying tumour biology that CT texture analysis may reflect includes (but is not limited to) tumour hypoxia and angiogenesis. Emerging studies show that CT texture analysis has the potential to be a useful adjunct in clinical oncologic imaging, providing important information about tumour characterization, prognosis and treatment prediction and response.
Figures
References
-
- Ganeshan B, Hosur A, Skogen K, Tasker F, Dizdarevic S, Miles KA. Multi-parametric FDG PET-CT in thoracic malignancies: opportunities for combined prognostic imaging biomarkers; Presented at: UK Radiological Congress 2012, Manchester, UK.
-
- Cubitt G. Investigation of texture analysis for assessing image quality of CT pancreas examinations. MSc thesis. University College London, London, UK; 2006.
-
- Rosenfeld A, Weszka J. Picture recognition. In: Fu K, editor. Digital pattern recognition. Heidelberg: Springer-Verlag; 1980. pp. p. 135–166.
MeSH terms
LinkOut - more resources
Full Text Sources
Other Literature Sources
Medical