Review
. 2013 Apr 1;5(4):a013227.
doi: 10.1101/cshperspect.a013227.

Endoplasmic reticulum structure and interconnections with other organelles

Affiliations
Review

Endoplasmic reticulum structure and interconnections with other organelles

Amber R English et al. Cold Spring Harb Perspect Biol. .

Abstract

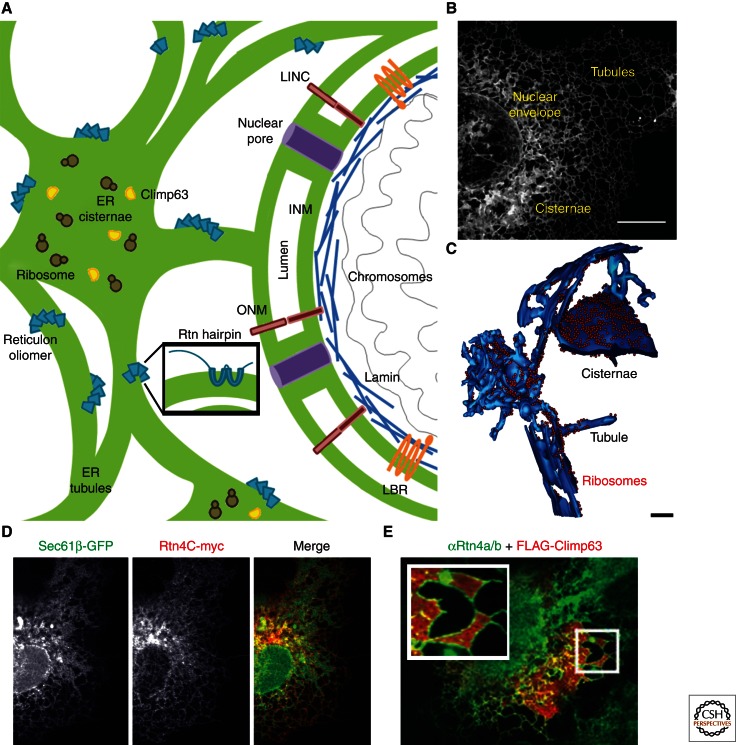
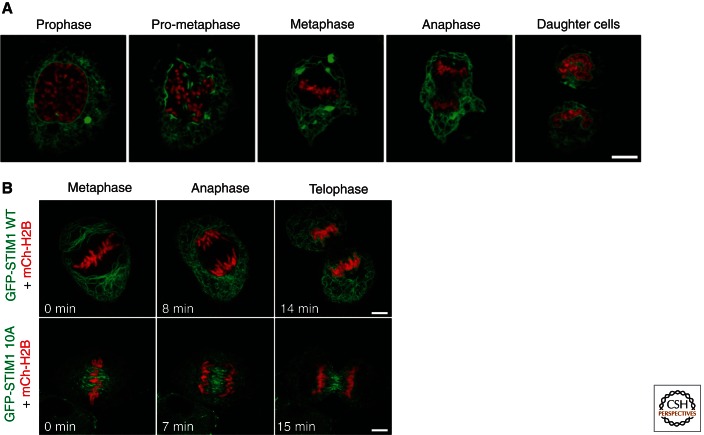
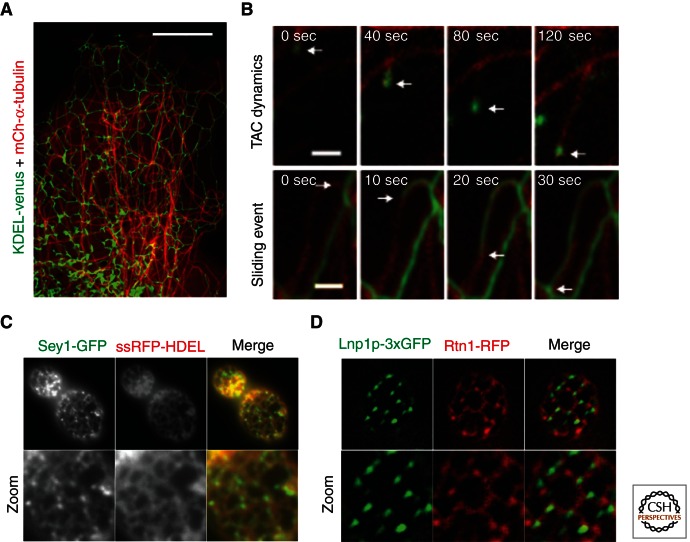
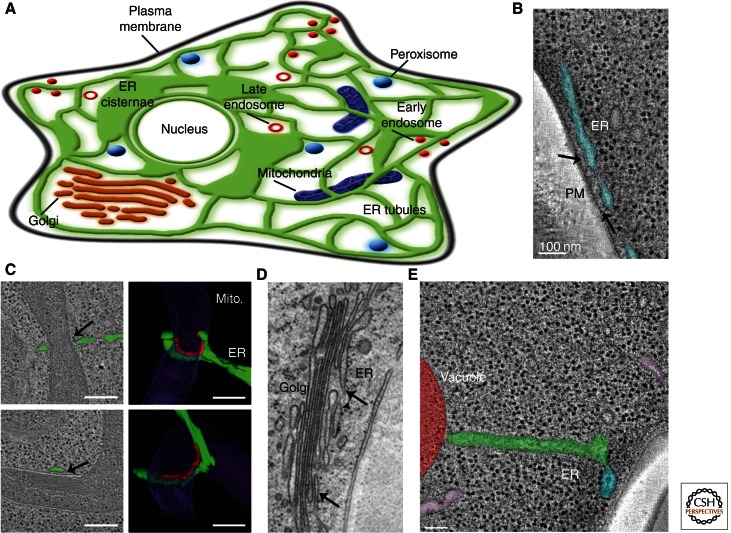
The endoplasmic reticulum (ER) is a large, continuous membrane-bound organelle comprised of functionally and structurally distinct domains including the nuclear envelope, peripheral tubular ER, peripheral cisternae, and numerous membrane contact sites at the plasma membrane, mitochondria, Golgi, endosomes, and peroxisomes. These domains are required for multiple cellular processes, including synthesis of proteins and lipids, calcium level regulation, and exchange of macromolecules with various organelles at ER-membrane contact sites. The ER maintains its unique overall structure regardless of dynamics or transfer at ER-organelle contacts. In this review, we describe the numerous factors that contribute to the structure of the ER.


Figures

Figure 1.
Figure 1.
Domains of the ER are stabilized by membrane-shaping proteins. (A) Model depicting known ER domains (in green) and domain regulating proteins. The structure of the NE double membrane bilayer is regulated by the LINC complex (in red), nuclear pores (in purple) and lamin B-receptor (LBR) (in orange) interactions with lamin (in blue). The organization of the peripheral ER cisternae is regulated by Climp63 (in yellow) and large protein complexes such as polyribosomes (in brown). Reticulon proteins (in blue) oligomerize to control the tubular ER and curved edges of the cisternal ER. (B) Confocal fluorescence image of a Cos-7 cell expressing the ER luminal marker KDEL-venus. The continuous membrane network of the ER is comprised of the NE, peripheral cisternae and peripheral ER tubules. (C) EM tomogram of the 3D structure of ER domains shown with bound ribosomes in a yeast cell (ER in blue; ribosomes are shown as red spheres). (D) Image of a Cos-7 cell coexpressing Rtn4C-myc (red) and general ER marker mCh-Sec61β (green) shows that Rtn4 localizes preferentially to ER tubules. Note the absence of Rtn4C staining at the NE and peripheral ER cisternae (compare middle panel with left panel, and see merge). (E) Cisternal ER expands in Cos-7 cells expressing FLAG-Climp63. Expansion of ER cisternae reveals endogenous Rtn4a/b localized to the edges of ER cisternae. Scale bars, B, 10 µm; C, 100 nm. (Image in C adapted from West et al. 2011; adapted, with permission, from the Journal of Cell Biology. Image in D from Voeltz et al. 2006; reprinted, with permission, from Elsevier © 2006. Image in E from Shibata et al. 2010; reprinted, with permission, from Elsevier © 2010.)
Figure 2.
Figure 2.
The structural organization of the ER during mitosis in mammalian cells. (A) Images of HeLa cells expressing GFP-Sec61β (ER in green) and H2B-tdTomato (chromatin in red) show the dramatic ER structural changes that occur between interphase and the indicated stages of mitosis. Note the movement of ER domains to the periphery which is particularly striking in metaphase. (B) Images of HeLa cells through mitosis expressing mCh-H2B (red) along with either GFP-STIM1 WT (top panels) or GFP-STIM1 with 10 phosphorylation sites mutated to alanine (bottom panels). Note that expression of the GFP-STIM1 10A mutant causes the ER to accumulate on the mitotic spindle. Scale bars, A, 10 µm; B, 5 µm. (Images in panel A from Anderson and Hetzer 2008b; reprinted, with permission, from the Journal of Cell Science © 2008. Images in panel B from Smyth et al. 2012; reprinted, with permission, from Elsevier © 2012.)
Figure 3.
Figure 3.
ER structure is regulated by dynamics on the cytoskeleton and homotypic fusion. (A) Cos-7 cells expressing KDEL-venus (ER in green) and mCh-α-tubulin (MTs in red) illustrate the close relationship between the ER and MT networks. (B) Time lapse images of Cos-7 cells expressing YFP-STIM1 (TAC dynamics, top panel) or GFP-Sec61β (sliding event, bottom panel) to visualize ER dynamic events that are associated with MTs (labeled with mCh-α-tubulin). Arrows indicate the position of the dynamic ER tubule tip. (C) Image of a yeast cell expressing Sey1-GFP (Atl homolog, in green) and a luminal ER marker (ssRFP-HDEL, in red). Note that Sey1 is highly enriched at three-way junctions (see zoom, left panel). (D) Image of a yeast cell expressing Lnp1p-3xGFP (lunapark, in green) and the tubular ER marker Rtn1-RFP (in red). Note that Lnp1p also localizes to three-way junctions. Scale bars, A, 10 µm; B, 1 µm. (Images in panel B from Friedman et al. 2010; reprinted, with permission, from the Journal of Cell Biology. Images in panel C from Hu et al. 2009; reprinted, with permission, from Elsevier Ltd. © 2009. Images in panel D from Chen et al. 2012; reprinted, with permission, from Nature Cell Biology © 2012.)
Figure 4.
Figure 4.
The ER forms membrane contact sites with the PM and other organelles. (A) Model depicting observed membrane contact sites in mammalian cells between the ER and PM, mitochondria, Golgi, endosomes and peroxisomes. (B) EM tomograph of a yeast cell illustrates the close contact between the peripheral ER (in blue) and PM (dark edge). (C) EM tomogram reveals ER tubules (in green) wrapped around mitochondria (in purple) at positions of constriction in a yeast cell. Marked in red are positions where the ER and mitochondria are closely apposed. Mito., mitochondria. (D) EM tomograph of an NRK (normal rat kidney) mammalian cell shows the close contacts between the ER and Golgi cisternae. (E) EM tomograph illustrates contacts between the ER (tubular in green, PM-associated ER in blue) and a vacuole (in red) in yeast. Note that ribosomes are excluded from the ER membrane where it apposes the PM, mitochondria, Golgi, and vacuole (in B, C, D, and E). Scale bars, B, 100 nm; C, 200 nm. (Images in B and E from West et al. 2011; reprinted, with permission, from the Journal of Cell Biology. Images in C from Friedman et al. 2011; reprinted, with permission, from the American Association for the Advancement of Science © 2011. Image in D courtesy of M. Ladinsky.)

References

    1. Achleitner G, Gaigg B, Krasser A, Kainersdorfer E, Kohlwein SD, Perktold A, Zellnig G, Daum G 1999. Association between the endoplasmic reticulum and mitochondria of yeast facilitates interorganelle transport of phospholipids through membrane contact. Eur J Biochem 264: 545–553 - PubMed
    1. Agrawal G, Joshi S, Subramani S 2011. Cell-free sorting of peroxisomal membrane proteins from the endoplasmic reticulum. Proc Natl Acad Sci 108: 9113–9118 - PMC - PubMed
    1. Anderson DJ, Hetzer MW 2007. Nuclear envelope formation by chromatin-mediated reorganization of the endoplasmic reticulum. Nat Cell Biol 9: 1160–1166 - PubMed
    1. Anderson DJ, Hetzer MW 2008a. Reshaping of the endoplasmic reticulum limits the rate for nuclear envelope formation. J Cell Biol 182: 911–924 - PMC - PubMed
    1. Anderson DJ, Hetzer MW 2008b. Shaping the endoplasmic reticulum into the nuclear envelope. J Cell Sci 121: 137–142 - PubMed

Publication types

Substances