

Effect of high-fat diet on metabolic indices, cognition, and neuronal physiology in aging F344 rats
- PMID: 23545425
- PMCID: PMC3651766
- DOI: 10.1016/j.neurobiolaging.2013.02.019
Effect of high-fat diet on metabolic indices, cognition, and neuronal physiology in aging F344 rats
Abstract
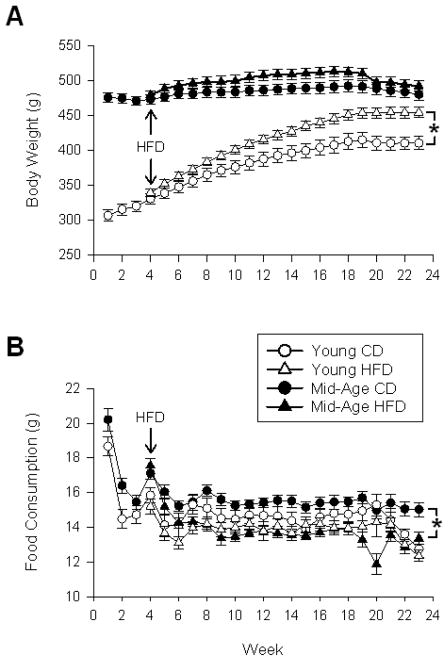
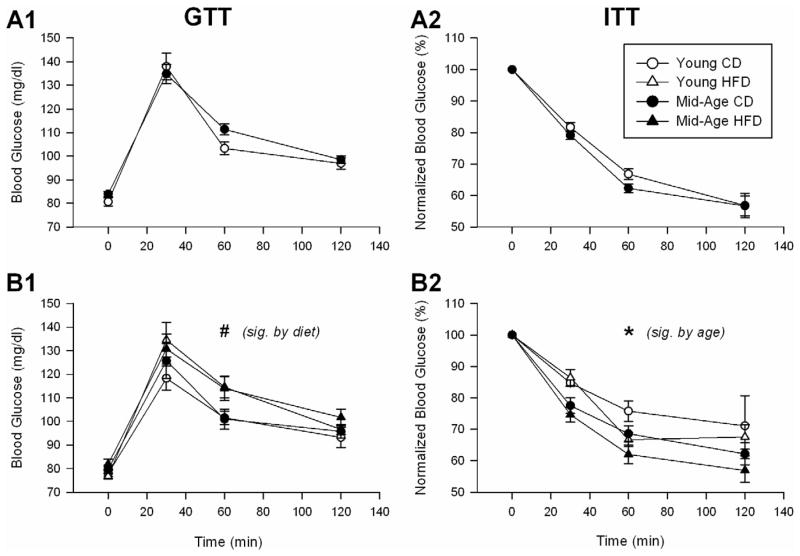
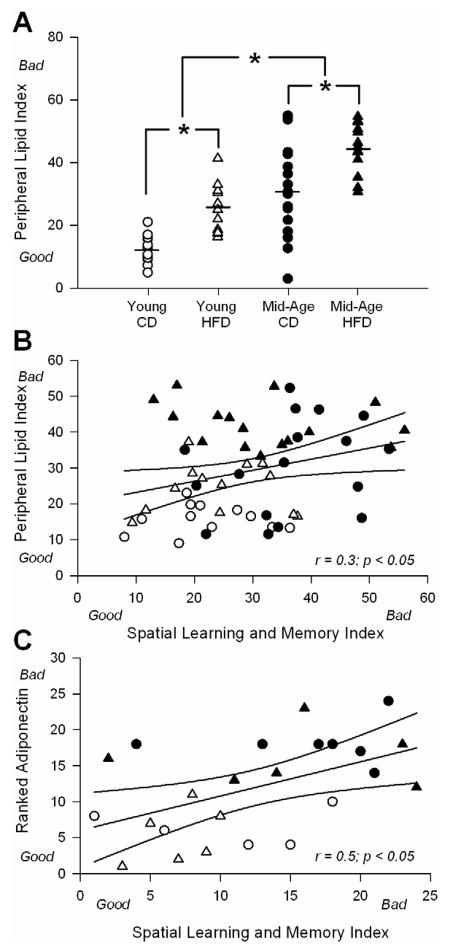
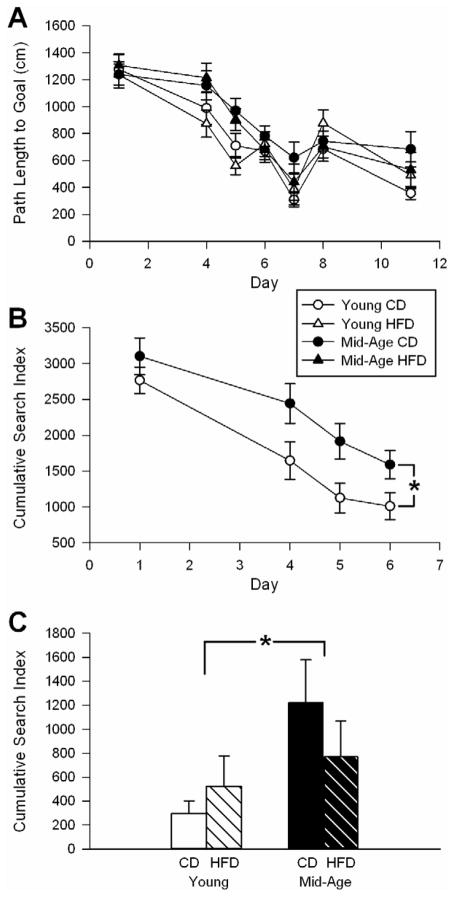
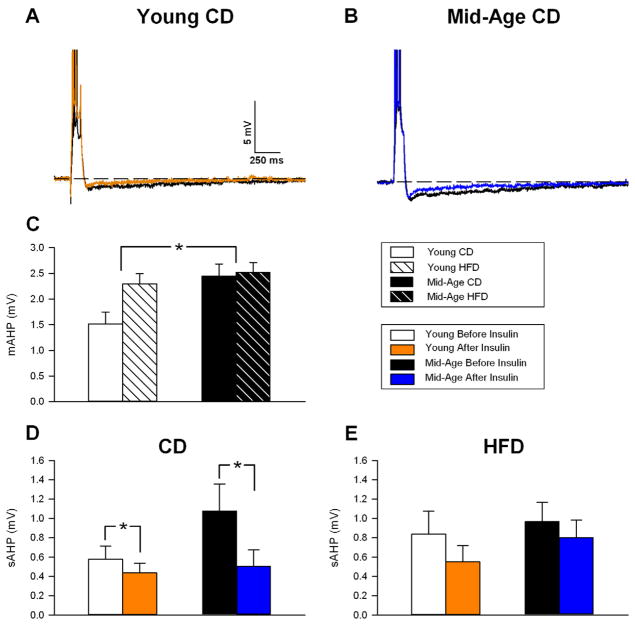
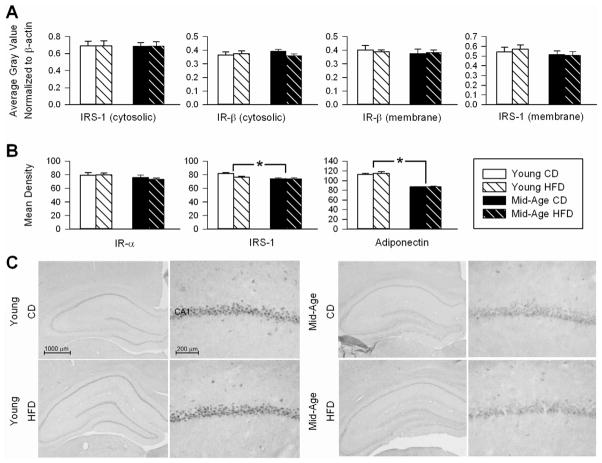
The prevalence of obesity and type 2 diabetes increases with age. Despite this, few studies have examined these conditions simultaneously in aged animals, and fewer studies have measured the impact of these conditions on brain function. Using an established animal model of brain aging (F344 rats), we investigated whether a high-fat diet (HFD) exacerbates cognitive decline and the hippocampal calcium-dependent afterhyperpolarization (a marker of age-dependent calcium dysregulation). Young and mid-aged animals were maintained on control or HFD for 4.5 months, and peripheral metabolic variables, cognitive function, and electrophysiological responses to insulin in the hippocampus were measured. HFD increased lipid accumulation in the periphery, although overt diabetes did not develop, nor were spatial learning and memory altered. Hippocampal adiponectin levels were reduced in aging animals but were unaffected by HFD. For the first time, however, we show that the AHP is sensitive to insulin, and that this sensitivity is reduced by HFD. Interestingly, although peripheral glucose regulation was relatively insensitive to HFD, the brain appeared to show greater sensitivity to HFD in F344 rats.
Copyright © 2013 Elsevier Inc. All rights reserved.
Conflict of interest statement
None of the authors on the manuscript has an actual or potential conflict of interest to declare. The work was supported by NIH/NIA grant AG033649. The data presented in this manuscript has not been submitted or published elsewhere. We will not submit the manuscript elsewhere while it is under review at Neurobiology of Aging. All authors approve of the procedures and the content of the manuscript and are able to validate the accuracy of the data presented.
Figures
Similar articles
-
High-fat diet and aging interact to produce neuroinflammation and impair hippocampal- and amygdalar-dependent memory.Neurobiol Aging. 2017 Oct;58:88-101. doi: 10.1016/j.neurobiolaging.2017.06.014. Epub 2017 Jun 24. Neurobiol Aging. 2017. PMID: 28719855 Free PMC article.
-
DPP-4 inhibitors improve cognition and brain mitochondrial function of insulin-resistant rats.J Endocrinol. 2013 May 28;218(1):1-11. doi: 10.1530/JOE-12-0521. Print 2013 Jul. J Endocrinol. 2013. PMID: 23591914
-
Young adult and aged female rats are vulnerable to amygdala-dependent, but not hippocampus-dependent, memory impairment following short-term high-fat diet.Brain Res Bull. 2023 Apr;195:145-156. doi: 10.1016/j.brainresbull.2023.03.001. Epub 2023 Mar 2. Brain Res Bull. 2023. PMID: 36870621 Free PMC article. Review.
-
Co-exposure of metals and high fat diet causes aging like neuropathological changes in non-aged mice brain.Brain Res Bull. 2019 Apr;147:148-158. doi: 10.1016/j.brainresbull.2019.02.013. Epub 2019 Feb 23. Brain Res Bull. 2019. PMID: 30807793
-
Hippocampal calcium dysregulation at the nexus of diabetes and brain aging.Eur J Pharmacol. 2013 Nov 5;719(1-3):34-43. doi: 10.1016/j.ejphar.2013.07.024. Epub 2013 Jul 17. Eur J Pharmacol. 2013. PMID: 23872402 Free PMC article. Review.
Cited by
-
Potential Neuroprotective Effects of Adiponectin in Alzheimer's Disease.Int J Mol Sci. 2017 Mar 9;18(3):592. doi: 10.3390/ijms18030592. Int J Mol Sci. 2017. PMID: 28282917 Free PMC article. Review.
-
The BMP2 nuclear variant, nBMP2, is expressed in mouse hippocampus and impacts memory.Sci Rep. 2017 Apr 18;7:46464. doi: 10.1038/srep46464. Sci Rep. 2017. PMID: 28418030 Free PMC article.
-
CAR Protects Females from Diet-Induced Steatosis and Associated Metabolic Disorders.Cells. 2023 Sep 6;12(18):2218. doi: 10.3390/cells12182218. Cells. 2023. PMID: 37759441 Free PMC article.
-
White matter inflammation and cognitive function in a co-morbid metabolic syndrome and prodromal Alzheimer's disease rat model.J Neuroinflammation. 2020 Jan 21;17(1):29. doi: 10.1186/s12974-020-1698-7. J Neuroinflammation. 2020. PMID: 31964387 Free PMC article.
-
Broadening the definition of brain insulin resistance in aging and Alzheimer's disease.Exp Neurol. 2019 Mar;313:79-87. doi: 10.1016/j.expneurol.2018.12.007. Epub 2018 Dec 18. Exp Neurol. 2019. PMID: 30576640 Free PMC article. Review.
References
-
- Barzilai N, Rossetti L. Relationship between changes in body composition and insulin responsiveness in models of the aging rat. Am J Physiol. 1995;269(3 Pt 1):E591–7. - PubMed
-
- Belanger A, Lavoie N, Trudeau F, Massicotte G, Gagnon S. Preserved LTP and water maze learning in hyperglycaemic-hyperinsulinemic ZDF rats. Physiol Behav. 2004;83(3):483–94. - PubMed
-
- Biessels GJ, Deary IJ, Ryan CM. Cognition and diabetes: a lifespan perspective. Lancet Neurol. 2008;7(2):184–90. - PubMed
Publication types
MeSH terms
Substances
Grants and funding
LinkOut - more resources
Full Text Sources
Other Literature Sources
Medical
