. 2013 May 10;288(19):13748-61.
doi: 10.1074/jbc.M112.381392. Epub 2013 Apr 1.

MicroRNA-144 is regulated by activator protein-1 (AP-1) and decreases expression of Alzheimer disease-related a disintegrin and metalloprotease 10 (ADAM10)

Affiliations

MicroRNA-144 is regulated by activator protein-1 (AP-1) and decreases expression of Alzheimer disease-related a disintegrin and metalloprotease 10 (ADAM10)

Cong Cheng et al. J Biol Chem. .

Abstract

Background: MicroRNA (miR) dysregulation is found in Alzheimer disease (AD). A disintegrin and metalloprotease 10 (ADAM10) prevents generation of amyloid β (Aβ) and decrease AD pathology.

Results: miR-144 suppresses ADAM10 expression and is up-regulated by activator protein-1.

Conclusion: miR-144 is a negative regulator of ADAM10 and may be involved in AD pathogenesis.

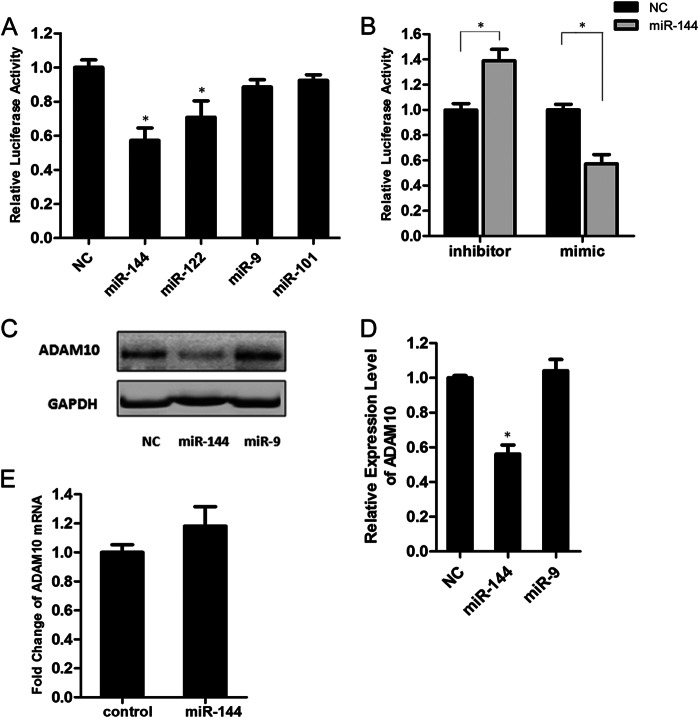
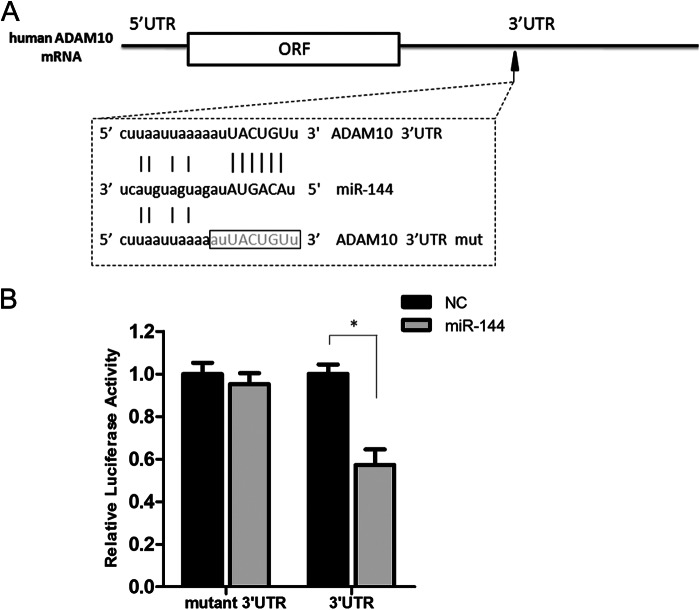
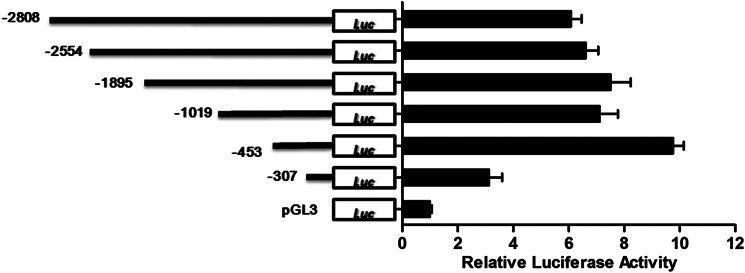
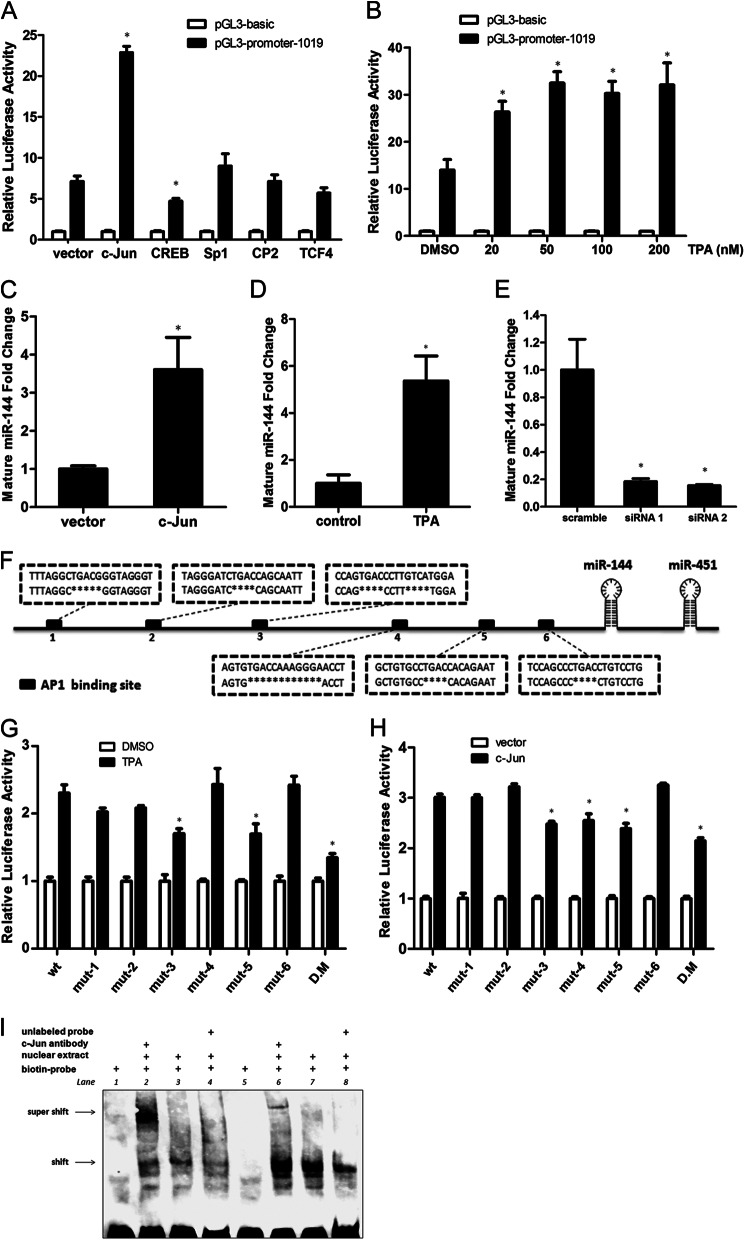
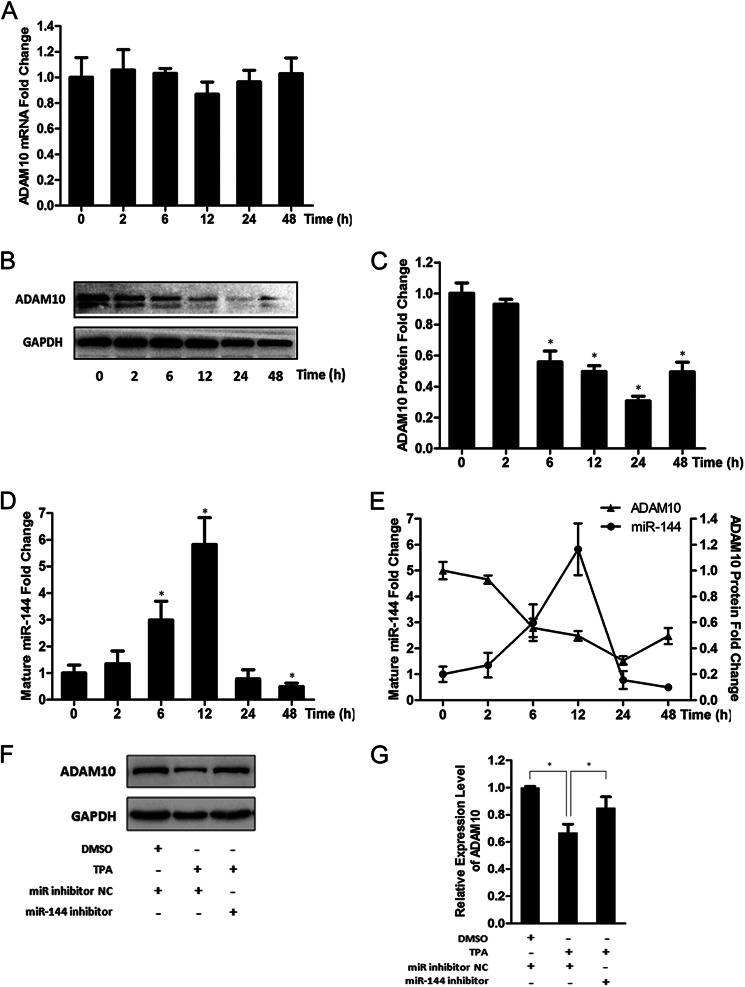
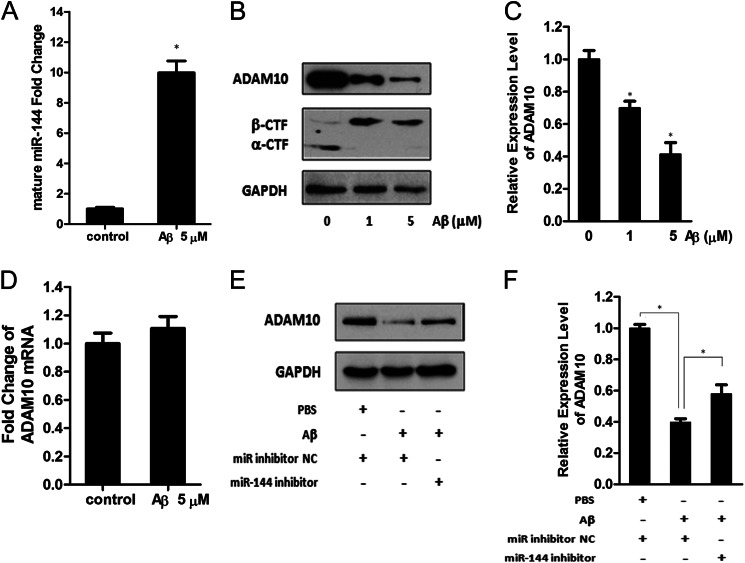
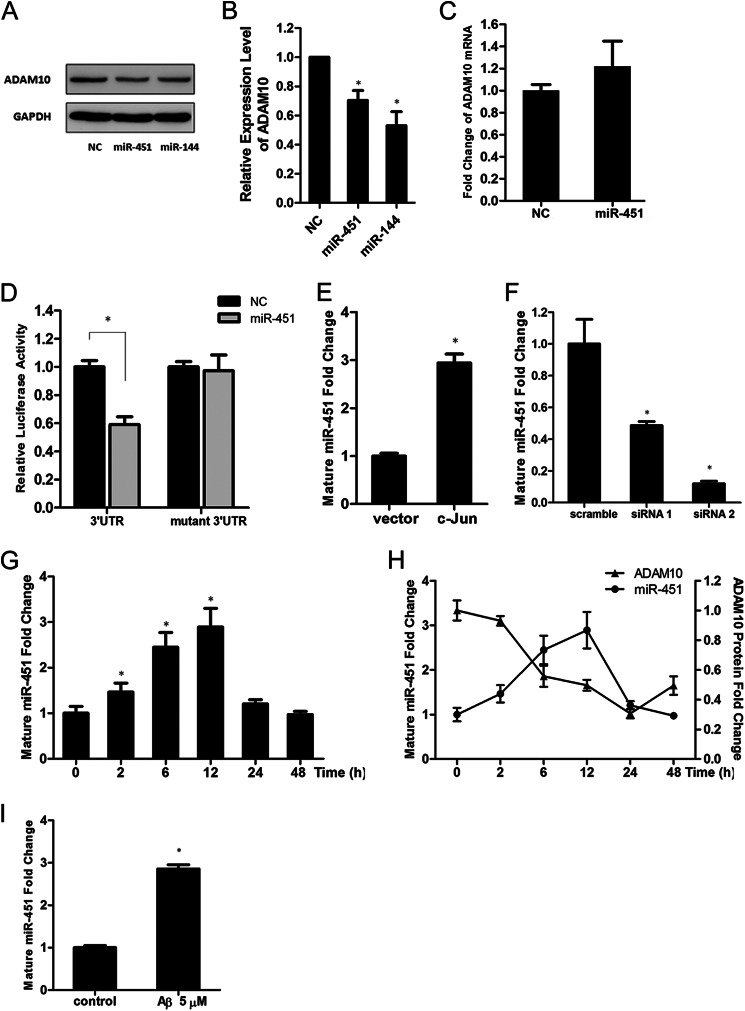
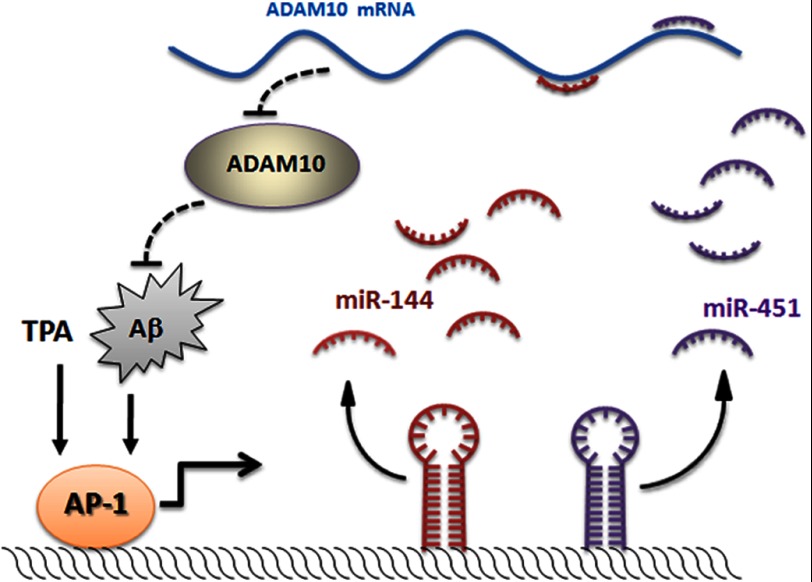
Significance: The first work to demonstrate the function of miRNA-144 and its regulation in the pathogenesis of AD. Amyloid β-peptide (Aβ) accumulating in the brain of Alzheimer disease (AD) patients is believed to be the main pathophysiologcal cause of the disease. Proteolytic processing of the amyloid precursor protein by α-secretase ADAM10 (a disintegrin and metalloprotease 10) protects the brain from the production of the Aβ. Meanwhile, dysregulation or aberrant expression of microRNAs (miRNAs) has been widely documented in AD patients. In this study, we demonstrated that overexpression of miR-144, which was previously reported to be increased in elderly primate brains and AD patients, significantly decreased activity of the luciferase reporter containing the ADAM10 3'-untranslated region (3'-UTR) and suppressed the ADAM10 protein level, whereas the miR-144 inhibitor led to an increase of the luciferase activity. The negative regulation caused by miR-144 was strictly dependent on the binding of the miRNA to its recognition element in the ADAM10 3'-UTR. Moreover, we also showed that activator protein-1 regulates the transcription of miR-144 and the up-regulation of miR-144 at least partially induces the suppression of the ADAM10 protein in the presence of Aβ. In addition, we found that miR-451, a miRNA processed from a single gene locus with miR-144, is also involved in the regulation of ADAM10 expression. Taken together, our data therefore demonstrate miR-144/451 is a negative regulator of the ADAM10 protein and suggest a mechanistic role for miR-144/451 in AD pathogenesis.

Keywords: ADAM ADAMTS; ADAM10; Alzheimers Disease; Amyloid; Gene Regulation; MicroRNA; miR-144.


Figures

FIGURE 1.
FIGURE 1.
Identification of miR-144 as a negative regulator of ADAM10. A, SH-SY5Y cells were transfected with the pmirGLO-ADAM10 3′-UTR reporter plasmid (0.05 μg) and miRNA mimics (50 nm) or cel-mir-67 mimics (negative control mimics, NC), which have no sequence identity with any human miRNAs. Luciferase activity was measured 48 h after transfection, and the values are shown as fold-change of the luciferase activity with respect to the negative control. B, SH-SY5Y cells were transfected with the pmirGLO-ADAM10 3′-UTR reporter plasmid and miR-144 inhibitor (100 nm) or miRNA inhibitor negative control (inhibitor NC). The dual luciferase assay was performed 48 h after transfection, and the luciferase activity of the miRNA inhibitor negative control was regarded as 1. C, Western blot analysis of endogenous ADAM10 protein levels in SH-SY5Y cells transfected with the miRNA negative control and miR-144 or miR-9 mimics. GAPDH served as an internal control. D, intensities of the ADAM10 bands from three independent experiments were quantified and normalized to that of the corresponding GAPDH bands. The values were plotted as fold-change with respect to the negative control. E, quantitative RT-PCR analysis of the ADAM10 mRNA levels in SH-SY5Y cells transfected with the miRNA negative control or miR-144 mimics. Values in A, B, D, and E are mean ± S.E. from experiments performed in triplicate. Asterisks indicate significant differences (*, p < 0.05).
FIGURE 2.
FIGURE 2.
Analysis of the miR-144 MRE within the ADAM10 3′-UTR. A, schematic representation of the human ADAM10 3′-UTR indicating the putative MRE for miR-144 and the sequences of the mutant reporter constructs created by PCR-based site-directed mutagenesis. B, the ADAM10 3′-UTR luciferase reporter (3UTR) or mutant construct without the predicted miR-144 MRE (mutant 3′UTR) was transfected with either miR-144 mimics or control mimics (NC) into SH-SY5Y cells. The dual luciferase assays were performed 48 h after transfection. The fold-change in relative luciferase activity was plotted; dark and gray bars indicate luciferase activity of the negative control and miR-144, respectively. Results are presented as mean ± S.E. from experiments performed in triplicate. Asterisks indicate significant differences (*, p < 0.05).
FIGURE 3.
FIGURE 3.
Identification of the miR-144 promoter by luciferase assays. Identification of miR-144 promoter activity by luciferase assays in SH-SY5Y cells. The luciferase reporter construct (−2080), containing the ∼2-kb region upstream of the precursor miR-144 and its deletion derivate (−2554, −1895, −1019, −453, and −307) were each transfected into SH-SY5Y cells, and dual luciferase assays were performed 48 h after transfection. For each reporter construct, the histogram shows the relative luciferase activity levels, evaluated as the ratio between each value versus the pGL3 basic vector; the schematic is on the right. Values are mean ± S.E. from experiments performed in triplicate.
FIGURE 4.
FIGURE 4.
Transcriptional regulation of miR-144. A, luciferase activity of the pGL3-promoter-1019 reporter after co-transfection into SH-SY5Y cells with an expression plasmid encoding the SP1, c-Jun, CREB, CP2, or TCF4 transcription factor, respectively. Values were calculated as the ratio of the luciferase activities in cells co-transfected with pGL3-promoter-1019 and a transcription factor expression plasmid versus in cells that were co-transfected with pGL3 basic vector and the same expression plasmid. B, dual luciferase activity assay after treatment with the indicated concentration of TPA in SH-SY5Y cells that were transfected with the pGL3-promoter-1019 reporter plasmid. Values were calculated as the ratio of luciferase activities in cells transfected with pGL3-promoter-1019 versus in cells transfected with pGL3 basic vector treated with TPA of same concentration. C, quantitative RT-PCR analysis of the level of endogenous mature miR-144 in SH-SY5Y cells after 24 h transfection of c-Jun expression plasmid. D, quantitative RT-PCR analysis of the level of endogenous mature miR-144 in SH-SY5Y cells after a 12-h TPA (50 nm) treatment. E, the levels of miR-144 were analyzed by quantitative RT-PCR 48 h after transfection of c-Jun siRNA-1 or siRNA-2 in SH-SY5Y cells. F, schematic representation of the gene encoding miR-144 and miR-451, as well as the promoter region with six potential AP-1 binding sites with the sequences deleted by PCR-based site-directed mutagenesis in each mutant reporter. G, each single mutant (mut-1 to mut-6) or double mutant (D.M.) reporter plasmid, or the wild type (wt) plasmid was transfected into SH-SY5Y cells, 24 h after the transfection the cells were treated with or without TPA (20 nm), and the dual luciferase activity assay was performed after another 12 h. Values were calculated as the ratio of luciferase activities in cells transfected with wild type or mutant reporter plasmids and treated with TPA versus cells transfected with the same reporter plasmid and treated with dimethyl sulfoxide (DMSO). H, each mutant reporter plasmid or the wild type plasmid was co-transfected with c-Jun expression vector into SH-SY5Y cells, the dual luciferase activity assay was performed 48 h after the transfection. I, 2 μl of SH-SY5Y cells nuclear extracts were incubated with 50 fmol of biotin-labeled DNA probe corresponding to putative AP-1 binding site 3 in miR-144 promoter (lanes 2–4) or with the biotin-labeled DNA probe corresponding to binding site 5 (lanes 6–8). For binding competition, 200-fold excess of unlabeled DNA probe was included in the reaction (lanes 4 and 8). For the supershift assay, c-Jun antibody was included (lanes 2 and 6). Results in A–E, G, and H are presented as mean ± S.E. from experiments performed in triplicate. Asterisks indicate significant differences (*, p < 0.05).
FIGURE 5.
FIGURE 5.
miR-144 contributes to the down-regulation of ADAM10 protein in response to TPA treatment. A, the mRNA levels of ADAM10 after treatment of TPA (50 nm) for the indicated time intervals were analyzed by quantitative RT-PCR and plotted as fold-change with respect to untreated control. B, representative results from three independent Western blot analyses of ADAM10 protein in SH-SY5Y cells treated with TPA (50 nm) after the indicated time intervals. GAPDH served as an internal control. C, intensities of the ADAM10 bands for each time interval from three independent experiments were quantified by densitometry. The values were normalized to that of corresponding GAPDH bands and plotted as fold-change with respect to the dimethyl sulfoxide-treated control. D, quantitative RT-PCR analysis of the endogenous mature miR-144 after TPA (50 nm) treatment for the indicated time intervals. E, demonstration of the inverse correlation between the ADAM10 protein and mature miR-144 levels in SH-SY5Y cells after TPA treatment for the indicated times intervals. F, SH-SY5Y cells with or without miR-144 loss-of-function by transfection with the miR-144 inhibitor or mirRNAs inhibitor negative control (miR inhibitor NC) were treated with TPA (20 nm) for 24 h, then the ADAM10 protein levels in cells were analyzed by Western blot. G, intensities of ADAM10 bands from three independent experiments were quantified and normalized to that of the corresponding GAPDH bands. The values were plotted as the fold-change with respect to the negative control. Values in A, C–E, and G are mean ± S.E. from experiments performed in triplicate. Asterisks indicate significant differences (*, p < 0.05). DMSO, dimethyl sulfoxide.
FIGURE 6.
FIGURE 6.
miR-144 is regulated by Aβ and contributes to the repression of ADAM10 induced by Aβ. A, the level of endogenous mature miR-144 24 h after treatment with the Aβ42 peptide (5 μm) was measured by quantitative RT-PCR and plotted as fold-change with respect to PBS-treated control. B, ADAM10 protein, α-CTF, and β-CTF in SH-SY5Y cells 24 h after treatment with the Aβ42 peptide at the indicated concentrations were analyzed by Western blot. C, intensities of the ADAM10 bands from three independent experiments were quantified and normalized to that of the corresponding GAPDH bands. The values were plotted as the fold-change with respect to the PBS-treated control. D, quantitative RT-PCR analysis of ADAM10 mRNA in SH-SY5Y cells 24 h after treatment with Aβ42 peptide (5 μm). E, SH-SY5Y cells with or without miR-144 loss-of-function by transfection with the miR-144 inhibitor or the negative control of the mirRNAs inhibitor (miR inhibitor NC) were treated with Aβ42 (5 μm) peptide for 24 h, then the levels of ADAM10 protein in the cells were analyzed by Western blot. F, intensities of the ADAM10 bands from three independent experiments were quantified and normalized to that of the corresponding GAPDH bands. The relative expression of ADAM10 was plotted as the fold-change with respect to the negative control. Results in A, C, D, and F are presented as mean ± S.E. from experiments performed in triplicate. Asterisks indicate significant differences (*, p < 0.05).
FIGURE 7.
FIGURE 7.
miR-451 is also involved in the regulation of ADAM10 expression. A, Western blot analysis of the ADAM10 protein in SH-SY5Y cells after transfection with miR-451 or miR-144 mimics. The miR-144 mimics were used as a positive control. B, intensities of ADAM10 bands from three independent experiments were quantified and normalized to that of the corresponding GAPDH bands. The values were plotted as fold-change with respect to the negative control. C, quantitative RT-PCR analysis of ADAM10 mRNA in SH-SY5Y cells after transfection with miR-451. D, the ADAM10 3′-UTR luciferase reporter (3UTR) or mutant construct without the predicted miR-451 MRE (mutant 3UTR) was transfected with either miR-451 mimics or control mimics (NC) into SH-SY5Y cells. The dual luciferase assays were performed 48 h after transfection. The fold-change in relative luciferase activity was plotted; dark and gray bars indicate luciferase activity of the negative control and miR-451, respectively. E, quantitative RT-PCR analysis of the level of endogenous mature miR-451 in SH-SY5Y cells 24 h after transfection of c-Jun plasmid. F, 48 h after transfection of c-Jun siRNA-1 or siRNA-2 in SH-SY5Y cells, the levels of endogenous mature miR-451 were analyzed by quantitative RT-PCR. G, quantitative RT-PCR analysis of the endogenous mature miR-451 after TPA (50 nm) treatment for the indicated time intervals. H, demonstration of the inverse correlation between the levels of ADAM10 protein and endogenous mature miR-451 in SH-SY5Y cells after TPA (50 nm) treatment for the indicated time intervals. I, the level of endogenous mature miR-451 24 h after the treatment with Aβ42 peptide (5 μm) was measured by quantitative RT-PCR and plotted as the fold-change with respect to the PBS-treated control. Results in B–I are mean ± S.E. from experiments performed in triplicate. Asterisks indicate significant differences (*, p < 0.05).
FIGURE 8.
FIGURE 8.
Regulatory feedback loop encompassing AP-1, miR-144, miR-451, and ADAM10. miR-144 and miR-451 bind to each MRE with the 3′-UTR of ADAM10 mRNA and decrease ADAM10 expression at the transcriptional level. The decrease in ADAM10 protein promotes amyloidogenesis. In turn, the increase in Aβ may activate AP-1 and other signaling pathways that may be involved in the regulation of miR-144 and miR-451.

References

    1. Blennow K., de Leon M. J., Zetterberg H. (2006) Alzheimer's disease. Lancet 368, 387–403 - PubMed
    1. Tanzi R. E., Bertram L. (2005) Twenty years of the Alzheimer's disease amyloid hypothesis. A genetic perspective. Cell 120, 545–555 - PubMed
    1. Postina R., Schroeder A., Dewachter I., Bohl J., Schmitt U., Kojro E., Prinzen C., Endres K., Hiemke C., Blessing M., Flamez P., Dequenne A., Godaux E., van Leuven F., Fahrenholz F. (2004) A disintegrin-metalloproteinase prevents amyloid plaque formation and hippocampal defects in an Alzheimer disease mouse model. J. Clin. Invest. 113, 1456–1464 - PMC - PubMed
    1. Postina R. (2008) A closer look at α-secretase. Curr. Alzheimer Res 5, 179–186 - PubMed
    1. Colciaghi F., Borroni B., Pastorino L., Marcello E., Zimmermann M., Cattabeni F., Padovani A., Di Luca M. (2002) α-Secretase ADAM10 as well as αAPPs is reduced in platelets and CSF of Alzheimer disease patients. Mol. Med. 8, 67–74 - PMC - PubMed

Publication types

MeSH terms