. 2013 Apr 16;110(16):6388-93.
doi: 10.1073/pnas.1219651110. Epub 2013 Apr 1.

Pathway-based personalized analysis of cancer

Affiliations

Pathway-based personalized analysis of cancer

Yotam Drier et al. Proc Natl Acad Sci U S A. .

Abstract

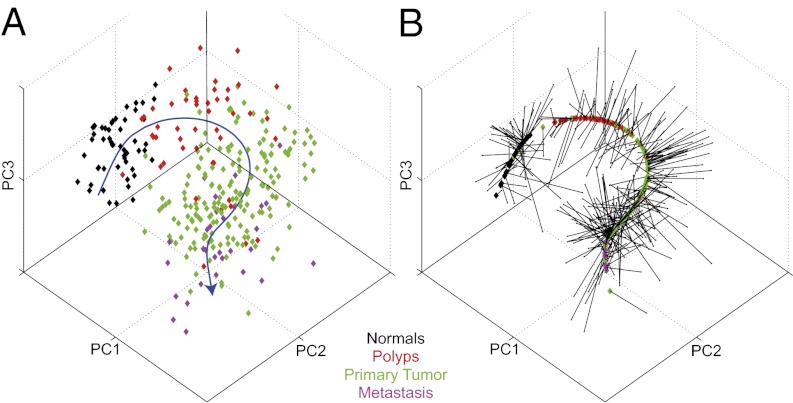
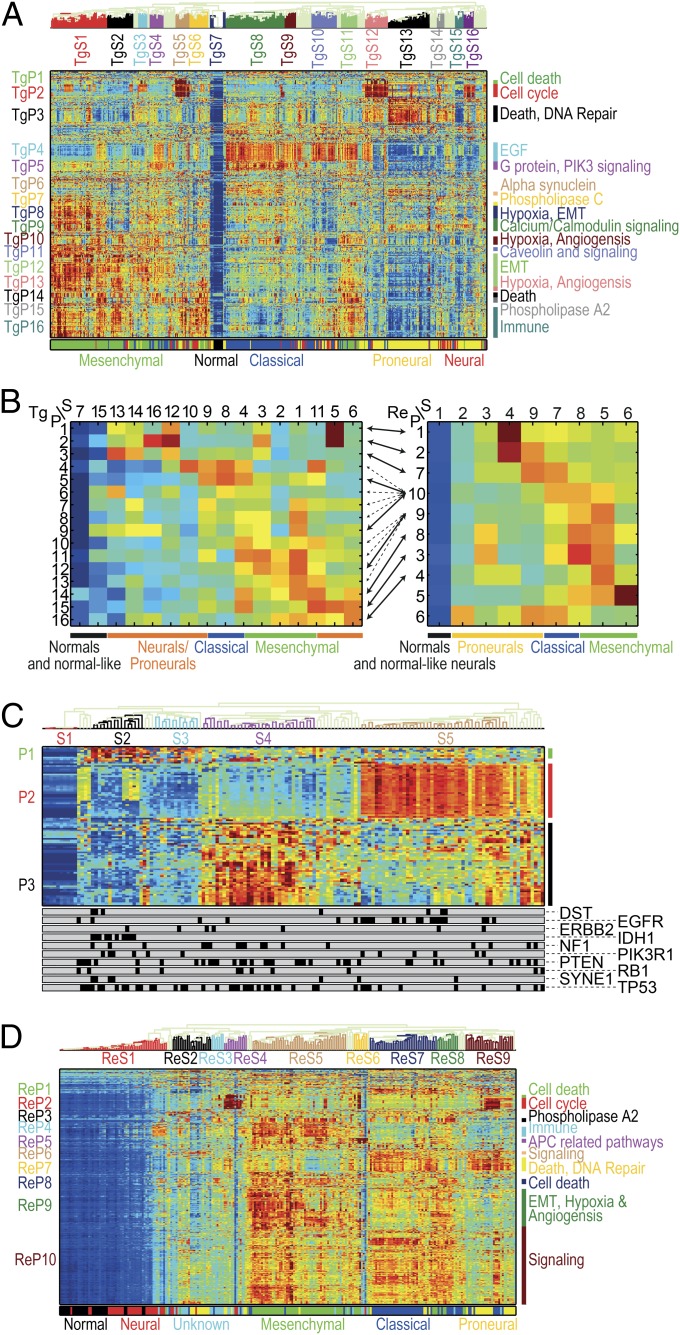
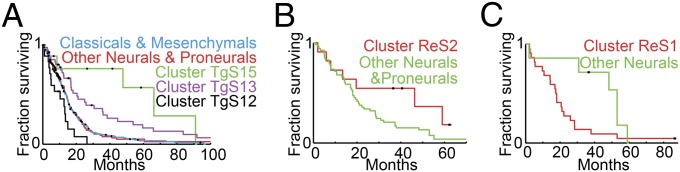
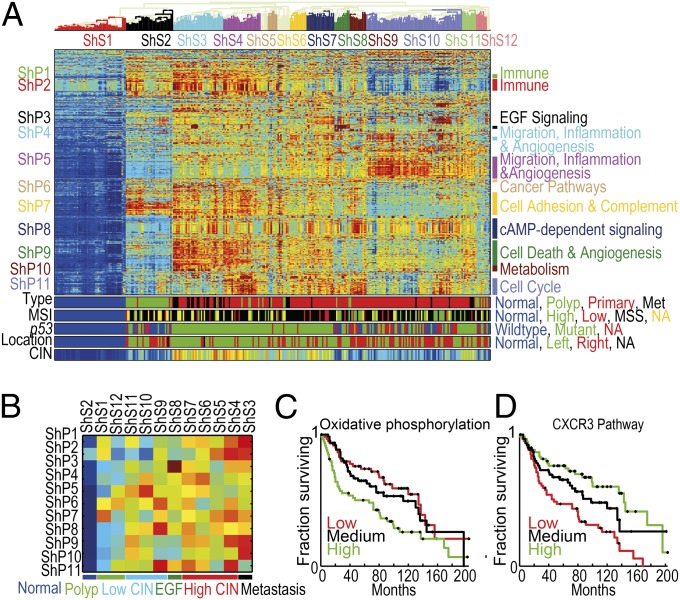
We introduce Pathifier, an algorithm that infers pathway deregulation scores for each tumor sample on the basis of expression data. This score is determined, in a context-specific manner, for every particular dataset and type of cancer that is being investigated. The algorithm transforms gene-level information into pathway-level information, generating a compact and biologically relevant representation of each sample. We demonstrate the algorithm's performance on three colorectal cancer datasets and two glioblastoma multiforme datasets and show that our multipathway-based representation is reproducible, preserves much of the original information, and allows inference of complex biologically significant information. We discovered several pathways that were significantly associated with survival of glioblastoma patients and two whose scores are predictive of survival in colorectal cancer: CXCR3-mediated signaling and oxidative phosphorylation. We also identified a subclass of proneural and neural glioblastoma with significantly better survival, and an EGF receptor-deregulated subclass of colon cancers.


Conflict of interest statement

The authors declare no conflict of interest.

Figures

Fig. 1.
Fig. 1.
The principal curve learned for the apoptosis pathway [as defined by the Kyoto Encyclopedia of Genes and Genomes (KEGG)] on the colorectal dataset of Sheffer et al. (30). The data points (representing samples of different tissue types, colored accordingly) and the principal curve are projected onto the three leading principal components. (A) The principal curve (in blue) going through the cloud of samples. The curve is directed so that normal samples are near the beginning of the curve (Methods). (B) The samples projected onto the curve. Each point carries its color from A.
Fig. 2.
Fig. 2.
(A) Pathway deregulation scores (PDSs) of the TCGA glioblastoma (GBM) dataset (17). Each row corresponds to a pathway and each column to a sample. Pathways and samples are clustered according to PDS. Blue color represents low score (“no deregulation”) and red high. The bottom bar represents the GBM subtype. Notice that pathway-based clustering captures the subtypes well and identifies a secondary substratification. (B) Summary of clustered PDS for the TCGA (Left) and REMBRANDT (19) (Right) GBM datasets. Each row corresponds to a pathway cluster and each column to a sample cluster, displaying the median value of deregulation for each pair of clusters. Arrows connect between pathway clusters that match (that is, the pathways in the clusters have significant overlap). When several matches are significant (as for ReP9 and ReP10) all are shown in dashed arrows, except for the extremely significant ones (P < 10−5). Some of the neurals/proneurals are mostly not deregulated, and some are deregulated on TgP1–TgP3 or matching ReP1/ReP2/ReP7. Classical tumors are deregulated on TgP4/TgP5 and possibly TgP6/TgP7 as well as matching ReP10 (and unmatched ReP6/ReP7). Mesenchymal samples are highly deregulated on TgP8–TgP16 as well as matching ReP8–10/ReP3/ReP4 (and unmatchable ReP5). The classical-mesenchymal cluster TgS4 matches ReS8, and indeed they are both deregulated on TgP4/TgP5/TgP10–12/TgP14/TgP15 and matching ReP8–10/ReP3 (as well as unmatchable ReP5). (C) Normalized PDS of 94 pathways correlated with mutations. The bottom bars display the mutation status, each bar for one gene (samples with mutation are marked in black). Cluster S1 corresponds to normal samples, S2 mostly to samples with IDH1 mutations, S4 mostly to samples with NF1 mutations, and S5 mostly to samples with EGFR mutations. Notice pathway cluster P2, which consist mostly of EGF-activated pathways, and is highly deregulated on the EGFR mutated samples. (D) Normalized PDS of the REMBRANDT GBM dataset. As in A, the pathway clusters correspond to the known subtypes but offer additional substratifications.
Fig. 3.
Fig. 3.
Kaplan–Meier plots for neural and proneural substratification. (A) Patients in TCGA clusters TgS13 and TgS15 have better prognosis. Neural and proneural tumors were divided into three groups, cluster TgS12 (in black), TgS13 (in purple), and TgS15 (in green), and all “others” (in red). Kaplan–Meier plots show clear separation between the four, where cluster TgS15 patients survive the longest (P = 0.009) and cluster TgS13 a little less, but still better compared with the others (P = 0.015); those in TgS12 survive less than the others (P = 0.003). The prognosis of the other neural and proneural tumors is similar to classical and mesenchymal tumors (blue). (B) In the REMBRANDT dataset, neural and proneural tumors were divided into two groups: those in cluster ReS2 (in red) and all others (in green). Kaplan–Meier plots show clearly better survival of the ReS2 patients (P = 0.066). (C) In the REMBRANDT dataset, cluster ReS1 contains only normal samples and normal-like neural samples. Interestingly, these neural patients (in red) have significantly worse prognosis (P = 0.032) than other neurals (in green).
Fig. 4.
Fig. 4.
(A) Clustered normalized PDS of the Sheffer dataset. Pathways and samples are clustered according to PDS. For most pathways the PDS of the normal samples are minimal (dark blue), and hence the higher the PDS are the more deregulated the pathway is. For a few pathways (mostly in ShP2) tumors deviate from normals in both directions; PDSs of normal samples have PDS ∼ 0 (green); both highly positive PDS (dark red) and highly negative PDS (dark blue) correspond to pathway deregulation, but in different directions. The color bars at the bottom correspond to the sample type (met denotes metastasis), the MSI status [normal, low, high, MSS, and not available (NA)], p53 mutation status, anatomic location of the tumor, and the CIN index (equally distributed into 20 bins). (B) Summary of clustered pathway scores for the Sheffer dataset. Each row corresponds to a pathway cluster and each column to a sample cluster, displaying the median value of deregulation for each pair of clusters. The color bar indicates the major groups of samples. (C) Oxidative phosphorylation pathway is associated with survival. Kaplan–Meier plots for groups defined by the deregulation scores of oxidative phosphorylation in the Sheffer dataset. The primary tumor samples were divided into three equal groups, based on their level of deregulation (high, medium, and low). Low deregulation scores are associated with better prognosis. (D) CXCR3 pathway is associated with survival. Kaplan–Meier plots for the deregulation scores of CXCR3 pathway in the Sheffer dataset. The primary tumor samples were divided into three equal groups, based on their level of deregulation (high, medium, and low). High deregulation scores are associated with better prognosis.

References

    1. Markert EK, Mizuno H, Vazquez A, Levine AJ. Molecular classification of prostate cancer using curated expression signatures. Proc Natl Acad Sci USA. 2011;108(52):21276–21281. - PMC - PubMed
    1. Thomas DC, et al. American Association for Cancer Research Approaches to complex pathways in molecular epidemiology: Summary of a special conference of the American Association for Cancer Research. Cancer Res. 2008;68(24):10028–10030. - PubMed
    1. Segal E, Friedman N, Koller D, Regev A. A module map showing conditional activity of expression modules in cancer. Nat Genet. 2004;36(10):1090–1098. - PubMed
    1. Bild AH, et al. Oncogenic pathway signatures in human cancers as a guide to targeted therapies. Nature. 2006;439(7074):353–357. - PubMed
    1. Chin L, Hahn WC, Getz G, Meyerson M. Making sense of cancer genomic data. Genes Dev. 2011;25(6):534–555. - PMC - PubMed

Publication types