. 2013 Jun;33(11):2285-301.
doi: 10.1128/MCB.01517-12. Epub 2013 Apr 1.

Inactivation of the mTORC1-eukaryotic translation initiation factor 4E pathway alters stress granule formation

Affiliations

Inactivation of the mTORC1-eukaryotic translation initiation factor 4E pathway alters stress granule formation

Marie-Josée Fournier et al. Mol Cell Biol. 2013 Jun.

Abstract

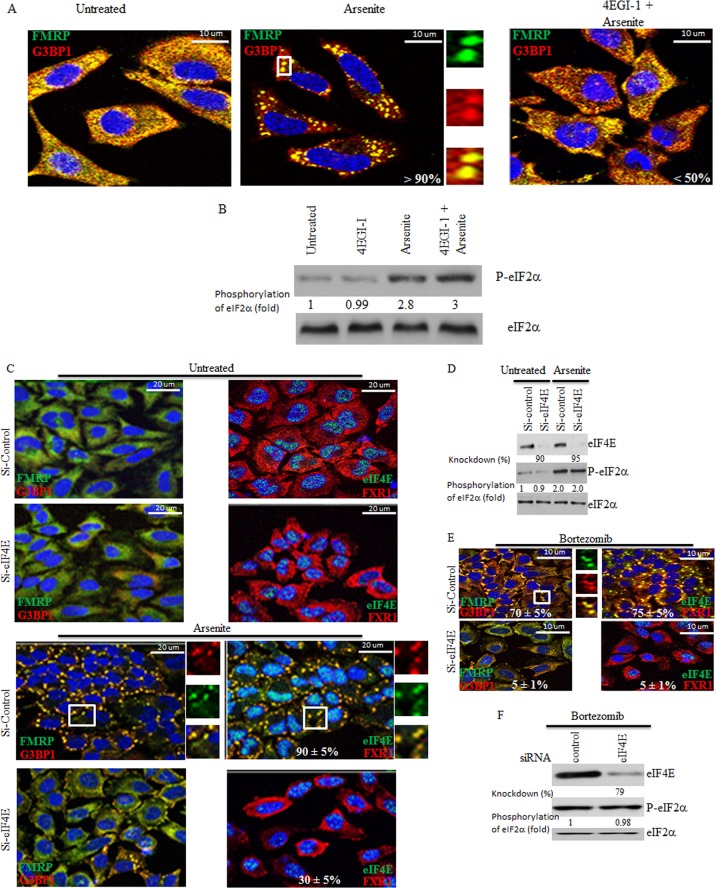
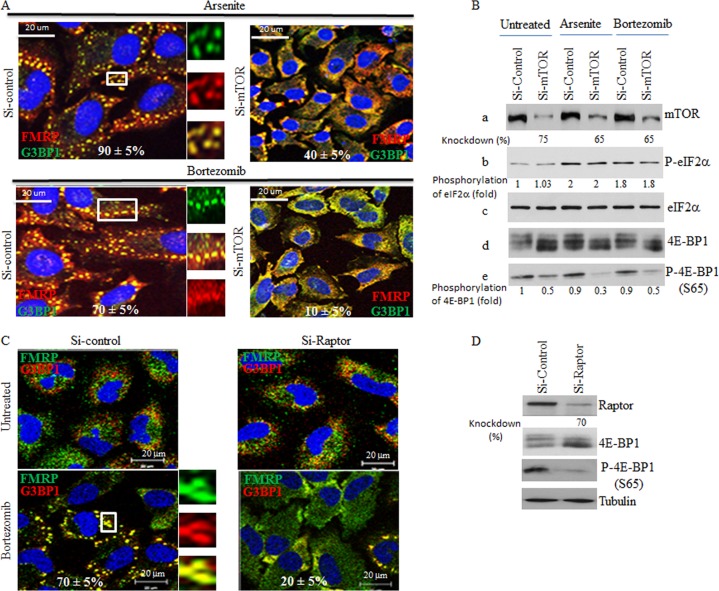
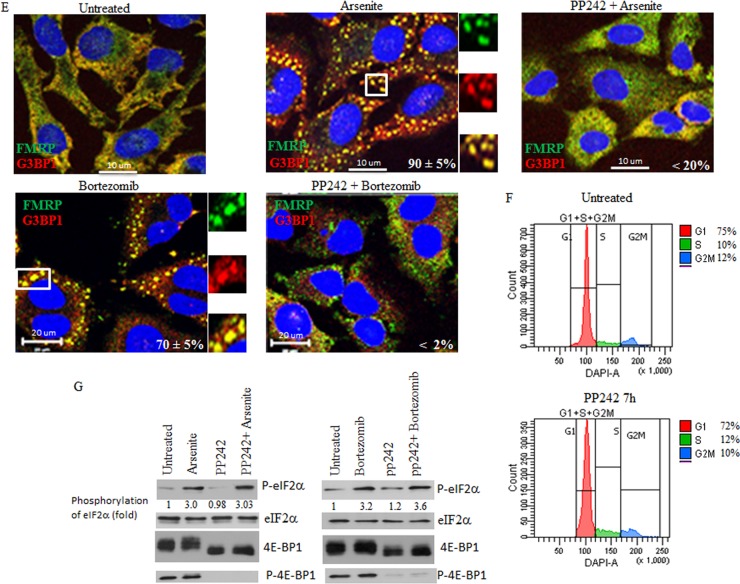
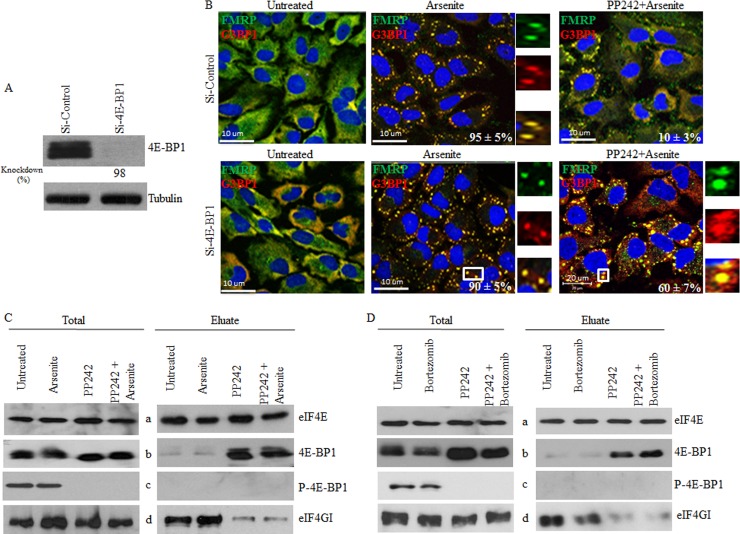
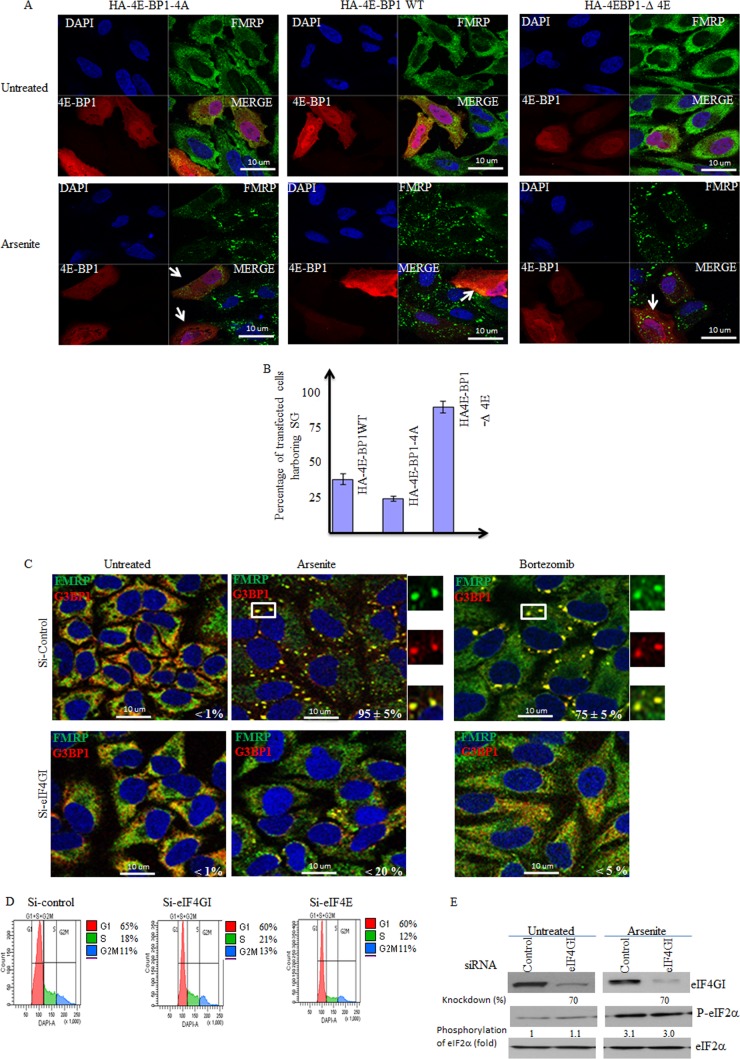
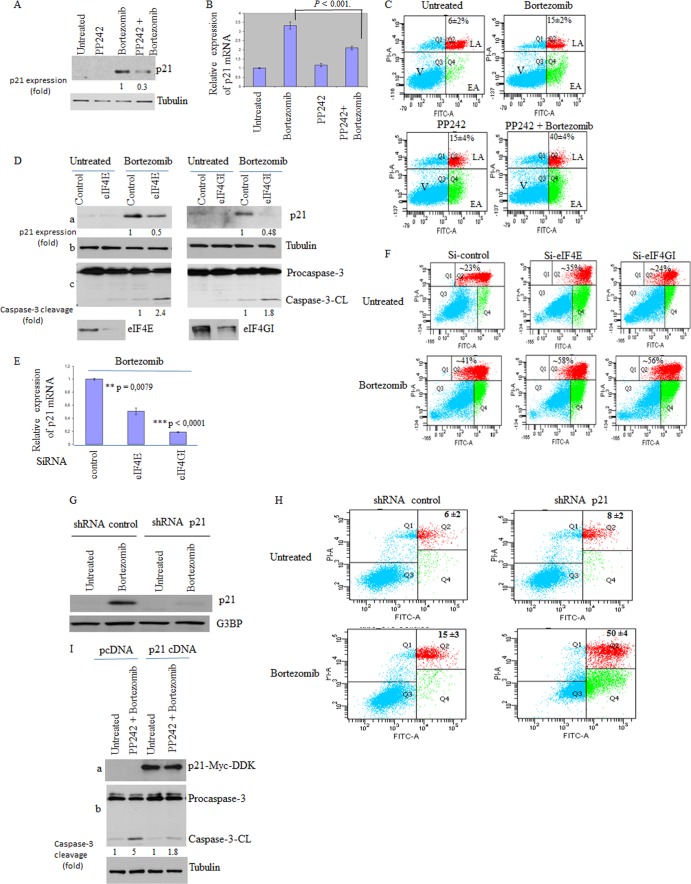
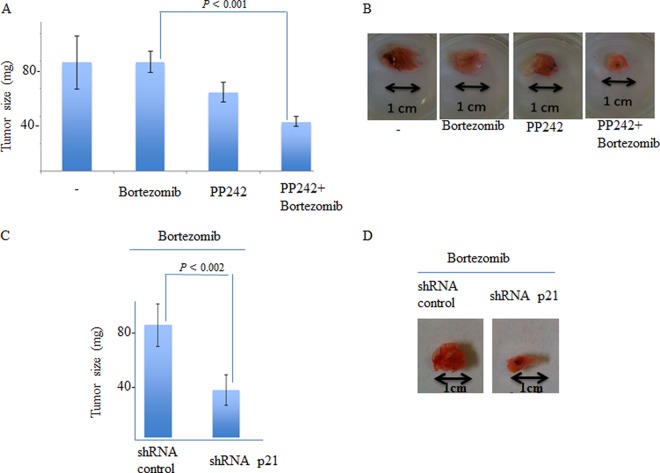
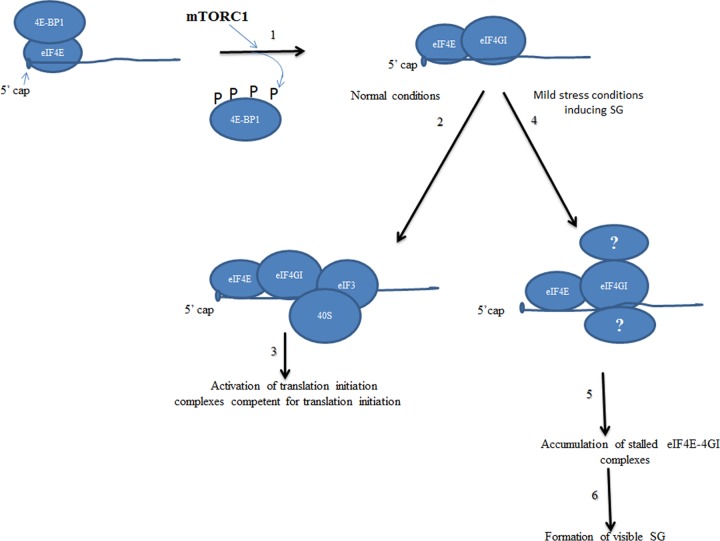
Stress granules (SG) are cytoplasmic multimeric RNA bodies that form under stress conditions known to inhibit cap-dependent translation. SG contain translation initiation factors, RNA binding proteins, and signaling molecules. SG are known to inhibit apoptotic pathways, thus contributing to chemo- and radioresistance in tumor cells. However, whether stress granule formation involves oncogenic signaling pathways is currently unknown. Here, we report a novel role of the mTORC1-eukaryotic translation initiation factor 4E (eIF4E) pathway, a key regulator of cap-dependent translation initiation of oncogenic factors, in SG formation. mTORC1 specifically drives the eIF4E-mediated formation of SG through the phosphorylation of 4E-BP1, a key factor known to inhibit formation of the mTORC1-dependent eIF4E-eIF4GI interactions. Disrupting formation of SG by inactivation of mTOR with its specific inhibitor pp242 or by depletion of eIF4E or eIF4GI blocks the SG-associated antiapoptotic p21 pathway. Finally, pp242 sensitizes cancer cells to death in vitro and inhibits the growth of chemoresistant tumors in vivo. This work therefore highlights a novel role of the oncogenic mTORC1-eIF4E pathway, namely, the promotion of formation of antiapoptotic SG.


Figures

Fig 1
Fig 1
Inactivating eIF4E or reducing its levels in HeLa cells impairs SG formation without affecting phosphorylation of eIF2α. (A and B) Cells were preincubated with 4EGI-1 (250 μM) for 6 h and then treated with 150 μM arsenite in the presence of 4EGI-1 (250 μM) for one additional hour. (A) Cells were then fixed, permeabilized, and processed for immunofluorescence using antibodies against different SG markers (FMRP in green and G3BP1 in red). DAPI (blue) was used as a nuclear stain. Pictures were taken using a 63× objective with a 1.5 zoom. The percentage of cells harboring SG (>3 granules/cell) from at least 5 different fields and 5 different experiments containing a total of 2 × 10³ cells is indicated at the bottom of the merged images. Typical SG are shown in enlarged pictures. (B) Cells were then lysed, and total cell lysates were analyzed by Western blotting for eIF2α phosphorylation using anti-phospho-eIF2α antibodies. Total eIF2α was analyzed using pan-eIF2α antibodies. The amount of phosphorylated eIF2α was determined by densitometry quantitation of the film signal and is expressed as a percentage of total eIF2α. The results are representative of 3 different experiments. (C to F) Cells were treated with nonspecific or eIF4E-selective siRNAs for 96 h. Cells were then incubated with 150 μM arsenite for 1 h (C and D) or with 2 μM bortezomib for 4 h (E and F). (C and E) Cells were fixed, permeabilized, and then processed for immunofluorescence to detect SG using anti-FMRP (green), anti-G3BP1 (red), and anti-FXR1 (red) antibodies. Anti-eIF4E (green) antibodies were used in order to detect SG and to assess eIF4E depletion. DAPI (blue) was used as a nuclear stain. Pictures were taken using a 63× objective with a 1.5 zoom. The percentage of cells harboring SG (>3 granules/cell) from 5 different fields and 5 different experiments for a total of 2 × 10³ cells is indicated in the merged images. Typical SG are shown. (D and F) Cells were lysed, and protein extracts were prepared and analyzed by Western blotting to detect eIF4E and phospho-eIF2α. Total eIF2α was analyzed using the pan-eIF2α antibodies and served as a loading control. The percentage of eIF4E knockdown was determined by densitometry quantification of the film signal using Photoshop and expressed as a percentage of total eIF2α. The amount of phosphorylated eIF2α was determined as described for panels A and B. The results are representative of 3 different experiments.
Fig 2
Fig 2
Depletion of either mTOR or Raptor as well as chemical inactivation of mTOR alters SG formation in HeLa cells without affecting eIF2α phosphorylation. (A and B) Cells were treated with nonspecific or mTOR-selective siRNAs for 96 h and then were incubated with either 150 μM arsenite for 1 h or with 2 μM bortezomib for 4 h. (A) Cells were fixed, permeabilized, and then processed for immunofluorescence to detect SG using anti-FMRP and anti-G3BP1. The percentage of cells harboring SG (>3 granules/cell) from 5 different fields and 5 different experiments containing a total of 2 × 10³ cells is indicated at the bottom of the merged images. Representative SG are shown in enlarged pictures. (B) Cells were lysed, and protein extracts were prepared and analyzed by Western blotting to detect mTOR, phospho-eIF2α, 4E-BP1, and phospho-4E-BP1 (S65) using the appropriate antibodies. Total eIF2α serves as a loading control. The percentage of mTOR knockdown and the amount of phosphorylated eIF2α and phospho-4E-BP1 were determined as described above. The results are representative of 5 different experiments. (C and D) Depletion of Raptor inhibits formation of SG. Cells were treated with nonspecific or Raptor-selective siRNAs and were then incubated with 2 μM bortezomib for 4 h. (C) Cells were fixed, permeabilized, and then processed for immunofluorescence to detect SG using anti-FMRP and anti-G3BP1, as described above. The percentage of cells harboring SG from 5 different fields and 3 different experiments containing a total of 103 cells is indicated at the bottom of the merged images. (D) Cells were lysed, and protein extracts were prepared and analyzed by Western blotting to detect Raptor, 4E-BP1, phospho-4E-BP1 (S65), and tubulin (loading control) using the appropriate antibodies. The percentage of Raptor knockdown was determined as described above. The results are representative of 3 different experiments. (E) The mTOR inhibitor pp242 is a novel SG suppressor drug. Cells were either pretreated with pp242 (2.5 μM) for 6 h and then incubated with 150 μM arsenite plus 2.5 μM pp242 for 1 h (PP242+Arsenite) or pretreated with pp242 (2.5 μM) for 4 h and then incubated with 2 μM bortezomib for 4 h (PP242+Bortezomib). As controls, cells were treated with pp242 (2.5 μM) for 7 h (PP242), with 150 μM arsenite for 1 h (Arsenite), or with 2 μM bortezomib for 4 h (Bortezomib). Cells were then processed for immunofluorescence to detect SG using anti-FMRP (green) and anti-G3BP1 (red) antibodies. Pictures were taken using a 63× objective with a 1.5 zoom. The percentage of cells harboring SG (>3 granules/cell) from 5 different fields and 5 different experiments containing a total of 2 × 10³ cells is indicated at the bottom of merged images. Typical SG are shown in enlarged pictures. (F) Cells were left untreated or were treated with 2.5 μM pp242 for 7 h, collected, washed with PBS, and then fixed with ethanol for 20 min. Cells were washed with PBS, stained with DAPI (1 μg/ml), and analyzed by flow cytometry. (G) Cells were either pretreated with pp242 (2.5 μM) for 6 h and then incubated with 150 μM arsenite plus 2.5 μM pp242 for 1 h (PP242+Arsenite) or were pretreated with pp242 (2.5 μM) for 4 h and then incubated with 2 μM bortezomib for 4 h (PP242+Bortezomib). As controls, cells were treated with pp242 (2.5 μM) for 7 h (PP242), with 150 μM arsenite for 1 h (Arsenite), or with 2 μM bortezomib for 4 h (Bortezomib). Cells were lysed, and protein extracts were prepared and analyzed by Western blotting to detect phospho-eIF2α, 4E-BP1, and phospho-4E-BP1 (S65) using the appropriate antibodies. Total eIF2α was analyzed using the pan-eIF2α antibodies and serves as a loading control. The amount of phosphorylated eIF2α was determined as described above. The results are representative of 5 different experiments.
Fig 2
Fig 2
Depletion of either mTOR or Raptor as well as chemical inactivation of mTOR alters SG formation in HeLa cells without affecting eIF2α phosphorylation. (A and B) Cells were treated with nonspecific or mTOR-selective siRNAs for 96 h and then were incubated with either 150 μM arsenite for 1 h or with 2 μM bortezomib for 4 h. (A) Cells were fixed, permeabilized, and then processed for immunofluorescence to detect SG using anti-FMRP and anti-G3BP1. The percentage of cells harboring SG (>3 granules/cell) from 5 different fields and 5 different experiments containing a total of 2 × 10³ cells is indicated at the bottom of the merged images. Representative SG are shown in enlarged pictures. (B) Cells were lysed, and protein extracts were prepared and analyzed by Western blotting to detect mTOR, phospho-eIF2α, 4E-BP1, and phospho-4E-BP1 (S65) using the appropriate antibodies. Total eIF2α serves as a loading control. The percentage of mTOR knockdown and the amount of phosphorylated eIF2α and phospho-4E-BP1 were determined as described above. The results are representative of 5 different experiments. (C and D) Depletion of Raptor inhibits formation of SG. Cells were treated with nonspecific or Raptor-selective siRNAs and were then incubated with 2 μM bortezomib for 4 h. (C) Cells were fixed, permeabilized, and then processed for immunofluorescence to detect SG using anti-FMRP and anti-G3BP1, as described above. The percentage of cells harboring SG from 5 different fields and 3 different experiments containing a total of 103 cells is indicated at the bottom of the merged images. (D) Cells were lysed, and protein extracts were prepared and analyzed by Western blotting to detect Raptor, 4E-BP1, phospho-4E-BP1 (S65), and tubulin (loading control) using the appropriate antibodies. The percentage of Raptor knockdown was determined as described above. The results are representative of 3 different experiments. (E) The mTOR inhibitor pp242 is a novel SG suppressor drug. Cells were either pretreated with pp242 (2.5 μM) for 6 h and then incubated with 150 μM arsenite plus 2.5 μM pp242 for 1 h (PP242+Arsenite) or pretreated with pp242 (2.5 μM) for 4 h and then incubated with 2 μM bortezomib for 4 h (PP242+Bortezomib). As controls, cells were treated with pp242 (2.5 μM) for 7 h (PP242), with 150 μM arsenite for 1 h (Arsenite), or with 2 μM bortezomib for 4 h (Bortezomib). Cells were then processed for immunofluorescence to detect SG using anti-FMRP (green) and anti-G3BP1 (red) antibodies. Pictures were taken using a 63× objective with a 1.5 zoom. The percentage of cells harboring SG (>3 granules/cell) from 5 different fields and 5 different experiments containing a total of 2 × 10³ cells is indicated at the bottom of merged images. Typical SG are shown in enlarged pictures. (F) Cells were left untreated or were treated with 2.5 μM pp242 for 7 h, collected, washed with PBS, and then fixed with ethanol for 20 min. Cells were washed with PBS, stained with DAPI (1 μg/ml), and analyzed by flow cytometry. (G) Cells were either pretreated with pp242 (2.5 μM) for 6 h and then incubated with 150 μM arsenite plus 2.5 μM pp242 for 1 h (PP242+Arsenite) or were pretreated with pp242 (2.5 μM) for 4 h and then incubated with 2 μM bortezomib for 4 h (PP242+Bortezomib). As controls, cells were treated with pp242 (2.5 μM) for 7 h (PP242), with 150 μM arsenite for 1 h (Arsenite), or with 2 μM bortezomib for 4 h (Bortezomib). Cells were lysed, and protein extracts were prepared and analyzed by Western blotting to detect phospho-eIF2α, 4E-BP1, and phospho-4E-BP1 (S65) using the appropriate antibodies. Total eIF2α was analyzed using the pan-eIF2α antibodies and serves as a loading control. The amount of phosphorylated eIF2α was determined as described above. The results are representative of 5 different experiments.
Fig 3
Fig 3
mTOR inactivation-induced hypophosphorylation of 4E-BP1 prevents eIF4E-mediated SG formation by disrupting its interaction with eIF4GI. (A and B) Depletion of 4E-BP1 rescues arsenite-induced SG formation in pp242-treated cells. HeLa cells were treated with nonspecific or 4E-BP1-selective siRNAs for 96 h. (A) Cells were lysed, and protein extracts were prepared and analyzed by Western blotting to detect 4E-BP1 using specific antibodies. Tubulin serves as a loading control. (B) Cells were then left untreated or were treated with pp242 (2. 5 μM) for 7 h or arsenite (150 μM) for 1 h or were incubated with pp242 (2. 5 μM) for 6 h before addition of arsenite (150 μM) together with pp242 (2.5 μΜ) for an additional 1 h. Cells were then processed for immunofluorescence to detect SG using anti-FMRP and anti-G3BP1 antibodies. Pictures were taken using a 63× objective with a 1.5 zoom. The percentage of cells harboring SG (>3 granules/cell) from 5 different fields and 5 different experiments containing a total of 2 × 10³ cells is indicated at the bottom of merged images. (C) pp242 disrupts eIF4F assembly, as monitored by cap-binding assays. HeLa cells were left untreated or were treated with pp242 (2. 5 μM) for 7 h or arsenite (150 μM) for 1 h or were incubated with pp242 (2.5 μM) for 6 h before addition of arsenite (150 μM) together with pp242 (2.5 μM) for an additional 1 h. Cells were lysed and then incubated with m7GTP-Sepharose beads. Eluted proteins were analyzed by Western blotting using specific antibodies. Total is 1% of the input used for cap pulldown. (D) HeLa cells were left untreated or were treated with pp242 (2. 5 μM) for 8 h or bortezomib (2 μM) for 4 h or were incubated with pp242 (2.5 μM) for 4 h before addition of bortezomib (2 μM) for an additional 4 h. Cells were lysed and then incubated with m7GTP-Sepharose beads. Eluted proteins were analyzed by Western blotting using specific antibodies. Total is 1% of the input used for cap pulldown.
Fig 4
Fig 4
eIF4GI is required for formation of SG, which is antagonized by 4E-BP1. (A and B) HeLa cells were transfected with wild-type (WT) HA-4E-BP1 or HA-4E-BP1-4A or with HA-4E-BP1-Δ4E for 48 h and were then treated with arsenite (150 μM) for 1 h. (A) Cells were processed for immunofluorescence to detect 4E-BP1 with anti-4E-BP1 antibodies or SG using anti-FMRP antibodies. (B) The percentage of transfected cells (indicated by arrows) harboring SG (>3 granules/cell) from 5 different fields and 3 different experiments containing a total of 500 cells is indicated. (C to E) eIF4GI is a novel SG-promoting factor. Cells were treated with nonspecific or eIF4GI-specific siRNAs for 96 h. Cells were treated with 150 μM arsenite for 1 h or with 2 μM bortezomib for 4 h. (C) HeLa cells were fixed, permeabilized, and then processed for immunofluorescence to detect SG using anti-FMRP and anti-G3BP1 antibodies. Pictures were taken using a 63× objective with a 1.5 zoom. The percentage of cells harboring SG was calculated as described for Fig. 2. (D) Cells were treated with nonspecific or eIF4E- or eIF4GI-specific siRNAs for 96 h. Cells were collected, washed with PBS, and then fixed with ethanol for 20 min. Cells were washed with PBS, stained with DAPI (1 μg/ml), and analyzed by flow cytometry. (E) Cells were treated with nonspecific or eIF4GI-specific siRNAs for 96 h. Cells were lysed, and protein extracts were prepared and analyzed by Western blotting to detect eIF4GI and phospho-eIF2α. Total eIF2α was analyzed using the pan-eIF2α antibodies and serves as a loading control. The percentage of eIF4GI knockdown and phosphorylated eIF2α was determined as described above by densitometry quantification of the film signal using Photoshop, and results are expressed as a percentage of total eIF2α. The results are representative of 3 different experiments.
Fig 5
Fig 5
PP242 and depletion of either eIF4E or eIF4GI downregulate the SG-associated p21 pathway and sensitize cancer cells to bortezomib. (A) HeLa cells were incubated with pp242 (2.5 μM) or with bortezomib (2 μM) or with both compounds for 16 h. Cells were then lysed and proteins resolved on SDS-PAGE and analyzed by Western blotting for p21 expression. Tubulin serves as a loading control. (B) Quantitative RT-PCR (qRT-PCR) of p21 mRNA. Following treatment with bortezomib (2 μM) or with pp242 (2.5 μM) or with both compounds for 4 h, cells were collected and total RNA content was then isolated. The amount of p21 was quantified by qRT-PCR relative to GAPDH mRNA using the threshold cycle (ΔΔCT) method. Results are expressed as the means ± SEM (error bars) of triplicate measurements. (C) HeLa cells were treated as described for panel A, collected, and then stained with annexin V-FITC and PI and analyzed by flow cytometry. The percentage of total dead or dying cells (indicated at the top of each panel) was defined as the sum of early (lower right box) and late (upper right box) apoptosis and corresponds to the means ± SEM of the results of 3 independent experiments. V, viable cells; EA, early apoptosis; LA, late apoptosis. (D to F) HeLa cells were treated with nonspecific or eIF4E- or eIF4GI-specific siRNAs for 96 h. Cells were treated with 2 μM bortezomib for 16 h. (D) Cells were then lysed, and extracted proteins were analyzed by Western blotting for the expression of p21, eIF4E, and eIF4GI as well as for caspase-3 cleavage. Tubulin serves as a loading control. (E) qRT-PCR of p21 mRNA as described above. (F) Cells were stained with annexin V-FITC and PI as described above and analyzed by flow cytometry. (G and H) Depletion of p21 promotes bortezomib-mediated apoptosis. (G) HeLa cells stably expressing either shRNA control or shRNA p21 were treated with bortezomib and then collected. Proteins extracts were then prepared and analyzed for p21 expression using anti-p21 antibodies. G3BP1 serves as a loading control. (H) HeLa cells stably expressing either shRNA control (left panel) or shRNA p21 (right panel) were treated with bortezomib for 16 h and then analyzed by staining with annexin V-FITC and PI and flow cytometry. The percentage of apoptotic cells is indicated at the top of each panel, and the values represent the means ± standard errors of the means (SEM) of the results of 3 independent experiments. (I) Overexpression of p21 reduces the effects of pp242 in promoting bortezomib-mediated apoptosis. HeLa cells transfected with either p21-myc-DDK or pcDNA for 20 h were treated with bortezomib (2 μM) or with pp242 (2.5 μM) and bortezomib (2 μM) for 16 h. Cells were then lysed, and extracted proteins were analyzed by Western blotting for p21 expression and caspase-3 cleavage. Tubulin serves as a loading control.
Fig 6
Fig 6
Both depletion of p21 and depletion of pp242 inhibit the formation of bortezomib-resistant tumors in the chick CAM assay. (A and B) HeLa cells (1 × 10⁶ cells/egg) were inoculated directly onto the CAM tissue of 10-day-old embryos. Bortezomib (60 ng/egg) or pp242 (80 ng/egg) or both were then injected i.v. on day 11 into a total of 100 embryos as described in Materials and Methods. At day 17, embryos were euthanized and decapitated and the tumor wet weight was recorded. (B) Representative tumors are shown. (C and D) p21 depletion inhibits the formation of bortezomib-resistant tumors in the chick CAM assay. HeLa cells that were stably expressing either shRNA control (left panel) or shRNA p21 (right panel) (1 × 10⁶ cells/egg) were inoculated directly onto the CAM tissue of 10-day-old embryos. Bortezomib (60 ng/egg) was then injected i.v. on day 11 in a total of 100 embryos as described in Materials and Methods. (C) At day 17, embryos were euthanized and decapitated and the tumor wet weight was recorded. Representative tumors are shown in panel D.
Fig 7
Fig 7
Our working model of mTORC1-eIF4E-4GI-dependent mode of SG assembly. Under both normal and SG-inducing stress conditions, mTORC1 drives formation of eIF4E-eIF4GI translation initiation complexes through phosphorylation of its 4E-BP1 target (1). Under normal growth conditions, eIF4E-4GI complexes are joined by 40S ribosomes at an early step of translation initiation (2 and 3). Under mild stress conditions inducing SG, eIF4E-4GI complexes may serve as scaffolding for the recruitment of unidentified factors in an mTORC1-dependent manner (4). This binding then stalls eIF4E-4GI complexes in an inactive status (5) and results in accumulation leading to formation of SG (6).

References

    1. Moeller BJ, Cao Y, Li CY, Dewhirst MW. 2004. Radiation activates HIF-1 to regulate vascular radiosensitivity in tumors: role of reoxygenation, free radicals, and stress granules. Cancer Cell 5:429–441 - PubMed
    1. Gardner LB. 2008. Hypoxic inhibition of nonsense-mediated RNA decay regulates gene expression and the integrated stress response. Mol. Cell. Biol. 28:3729–3741 - PMC - PubMed
    1. Mazroui R, Sukarieh R, Bordeleau ME, Kaufman RJ, Northcote P, Tanaka J, Gallouzi I, Pelletier J. 2006. Inhibition of ribosome recruitment induces stress granule formation independently of eukaryotic initiation factor 2alpha phosphorylation. Mol. Biol. Cell 17:4212–4219 - PMC - PubMed
    1. McInerney GM, Kedersha NL, Kaufman RJ, Anderson P, Liljestrom P. 2005. Importance of eIF2alpha phosphorylation and stress granule assembly in alphavirus translation regulation. Mol. Biol. Cell 16:3753–3763 - PMC - PubMed
    1. Fournier MJ, Gareau C, Mazroui R. 2010. The chemotherapeutic agent bortezomib induces the formation of stress granules. Cancer Cell Int. 10:12 doi:10.1186/1475-2867-10-12 - DOI - PMC - PubMed

Publication types

MeSH terms