

Morbid obesity in women on the rise: an observational, population-based study
- PMID: 23547911
- PMCID: PMC3641016
- DOI: 10.1186/1471-2458-13-290
Morbid obesity in women on the rise: an observational, population-based study
Abstract
Background: The obesity epidemic is generally monitored by the proportion of the population whose body mass index (BMI) exceeds 30 kg/m2 but this masks the growing proportion of those who are morbidly obese. This issue is important as the adverse health risks amplify as the level of obesity increases. The aim of this study was to determine how the prevalence of morbid obesity (BMI ≥ 40.0 kg/m2) has changed over a decade among women living in south-eastern Australia.
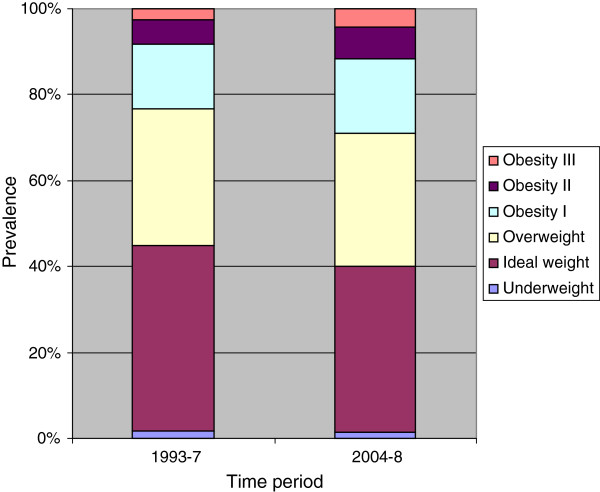
Methods: BMI was determined for women in the Geelong Osteoporosis study (GOS) during two time periods, a decade apart. Height and weight were measured for 1,494 women (aged 20-94 years) during 1993-7 and for 1,076 women (aged 20-93 years), 2004-8, and the BMI calculated as weight in kilograms divided by the square of the height in metres (kg/m2). Prevalence estimates were age-standardised to enable direct comparisons.
Results: Mean BMI increased from 26.0 kg/m2 (95%CI 25.7-26.3) in 1993-7, to 27.1 kg/m2 (95%CI 26.8-27.4) in 2004-8. During this period, the prevalence of morbid obesity increased from 2.5% to 4.2% and the standardised morbidity ratio for morbid obesity was 1.69 (95%CI 1.26-2.27). Increases in mean BMI and prevalence of morbid obesity were observed for all ages and across the socioeconomic spectrum.
Conclusions: These findings reveal that over a decade, there has been an increase in mean BMI among women residing in south-eastern Australia, resulting in a measurable increase in the prevalence of morbid obesity.
Figures
References
-
- Weighing it up: obesity in Australia. http://apo.org.au/research/weighing-it-obesity-australia (accessed Aug 2012)
-
- Talbot ML, Jorgensen JO, Loi KW. Difficulties in provision of bariatric surgical services to the morbidly obese. Med J Aust. 2005;182:344–347. - PubMed
Publication types
MeSH terms
LinkOut - more resources
Full Text Sources
Other Literature Sources
