. 2013 Aug 26;53(8):1853-70.
doi: 10.1021/ci400025f. Epub 2013 May 10.

CSAR benchmark exercise 2011-2012: evaluation of results from docking and relative ranking of blinded congeneric series

Affiliations

CSAR benchmark exercise 2011-2012: evaluation of results from docking and relative ranking of blinded congeneric series

Kelly L Damm-Ganamet et al. J Chem Inf Model. .

Abstract

The Community Structure-Activity Resource (CSAR) recently held its first blinded exercise based on data provided by Abbott, Vertex, and colleagues at the University of Michigan, Ann Arbor. A total of 20 research groups submitted results for the benchmark exercise where the goal was to compare different improvements for pose prediction, enrichment, and relative ranking of congeneric series of compounds. The exercise was built around blinded high-quality experimental data from four protein targets: LpxC, Urokinase, Chk1, and Erk2. Pose prediction proved to be the most straightforward task, and most methods were able to successfully reproduce binding poses when the crystal structure employed was co-crystallized with a ligand from the same chemical series. Multiple evaluation metrics were examined, and we found that RMSD and native contact metrics together provide a robust evaluation of the predicted poses. It was notable that most scoring functions underpredicted contacts between the hetero atoms (i.e., N, O, S, etc.) of the protein and ligand. Relative ranking was found to be the most difficult area for the methods, but many of the scoring functions were able to properly identify Urokinase actives from the inactives in the series. Lastly, we found that minimizing the protein and correcting histidine tautomeric states positively trended with low RMSD for pose prediction but minimizing the ligand negatively trended. Pregenerated ligand conformations performed better than those that were generated on the fly. Optimizing docking parameters and pretraining with the native ligand had a positive effect on the docking performance as did using restraints, substructure fitting, and shape fitting. Lastly, for both sampling and ranking scoring functions, the use of the empirical scoring function appeared to trend positively with the RMSD. Here, by combining the results of many methods, we hope to provide a statistically relevant evaluation and elucidate specific shortcomings of docking methodology for the community.


Figures

Figure 1
Figure 1
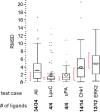
RMSD box plot of the best pose for each protein–ligand complex broken down by group–method. The rectangular box indicates the interquartile range (25–75%), and the bars the 1.5× interquartile range. The median is shown by the line in the box, and the diamond denotes the mean and 95% confidence interval around the mean. The red bracket signifies the shortest interval that contains 50% of the data, and outliers are indicated by squares above the bars. Group–method, which submitted scores for all ligands of LpxC, Urokinase, Chk1, and Erk2, are bolded.
Figure 2
Figure 2
RMSD box plot of the best pose for each protein–ligand complex broken down by protein target. The rectangular box indicates the interquartile range (25–75%) and the bars the 1.5× interquartile range. The median is shown by the line in the box, and the diamond denotes the mean and 95% confidence interval around the mean. The red bracket signifies the shortest interval that contains 50% of the data, and outliers are indicated by squares above the bars.
Figure 3
Figure 3
Native contacts box plot of the best pose for each protein–ligand complex broken down by protein target. The rectangular box indicates the interquartile range (25–75%) and the bars the 1.5× interquartile range. The median is shown by the line in the box, and the diamond denotes the mean and 95% confidence interval around the mean. The red bracket signifies the shortest interval that contains 50% of the data, and outliers are indicated by squares above the bars. (A) %Total contacts correct, (B) %Het–Het contacts correct, and (C) %C–C contacts correct.
Figure 4
Figure 4
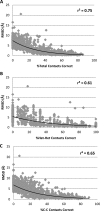
(A) %Total contacts correct, (B) %Het–Het contacts correct, and (C) %C–C contacts correct plotted again RMSD. The exponential fit is shown on each graph.
Figure 5
Figure 5
Predicted docking pose (submission; yellow) overlaid with the experimental co-crystal structure of Chk1–ligand 1 (blue). Dotted lines illustrate two important hydrogen bonds formed between the ligand and the hinge region of the protein backbone. The RMSD between the coordinates of the predicted pose and coordinates of the experimental structure is equal to 0.702, %Het–Het contacts correct is equal to 0%, and %C–C contacts correct is equal to 37%.
Figure 6
Figure 6
Number of raw Het–Het contacts in co-crystal versus number of raw Het–Het contacts in prediction. The solid line illustrates a perfect match, while the dotted lines show a ±10% range. (A) RMSD < 1 Å bin. (B) RMSD = 1–2 Å bin.
Figure 7
Figure 7
Number of raw C–C contacts in co-crystal versus number of raw C–C contacts in prediction. The solid line illustrates a perfect match, while the dotted lines show a ±10% range. (A) RMSD < 1 Å bin. (B) RMSD = 1–2 Å bin.
Figure 8
Figure 8
Number of raw packing contacts in co-crystal versus number of raw packing contacts in prediction. The solid line illustrates a perfect match, while the dotted lines show a ±10% range. (A) RMSD < 1 Å bin. (B) RMSD = 1–2 Å bin.
Figure 9
Figure 9
Outcome of the online questionnaire on protein and ligand setup for all poses. The pose prediction results were binned by RMSD and plotted as the percentage of time that a particular feature resulted in a pose within the RMSD bin. Distinct trends that are related to docking RMSD are noted with arrows.
Figure 10
Figure 10
Outcome of the online questionnaire on docking methodology for all poses. The pose prediction results were binned by RMSD and plotted as the percentage of time that a particular feature resulted in a pose within the RMSD bin. Distinct trends that are related to docking RMSD are noted with arrows.
Figure 11
Figure 11
Outcome of the online questionnaire on scoring functions for all poses. The percentage of time that a scoring function was utilized is shown by RMSD bin. Distinct trends that are related to docking RMSD are noted with arrows.
Figure 12
Figure 12
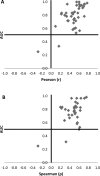
For the Urokinase test set, the ability to rank active molecules versus enriching hit lists is plotted. An AUC of less than 0.50 is considered random. Negative values of r or ρ signify that the data was anticorrelated. (A) Pearson r parametric correlation versus AUC and (B) Spearman ρ nonparametric correlation versus AUC.
Figure 13
Figure 13
RMSD is plotted against the percentage of inactive molecules ranked higher than an active molecule for both Urokinase and Chk1 targets. The insert shows the percentage of ligands that fall with each RMSD bin for two groups: (1) active molecules that have no inactives ranked higher (0%) and (2) active molecules that have one or more inactives ranked higher (all other).

References

    1. Cheng T.; Li Q.; Zhou Z.; Wang Y.; Bryant S. H. Structure-based virtual screening for drug discovery: A problem-centric review. AAPS J. 2012, 14, 133–141. - PMC - PubMed
    1. Huang S. Y.; Zou X. Advances and challenges in protein–ligand docking. Int. J. Mol. Sci. 2010, 11, 3016–3034. - PMC - PubMed
    1. Jorgensen W. L. The many roles of computation in drug discovery. Science 2004, 303, 1813–1818. - PubMed
    1. Leach A. R.; Shoichet B. K.; Peishoff C. E. Prediction of protein–ligand interactions. Docking and scoring: Successes and gaps. J. Med. Chem. 2006, 49, 5851–5855. - PubMed
    1. Lyne P. D. Structure-based virtual screening: An overview. Drug. Discovery Today 2002, 7, 1047–1055. - PubMed

Publication types