Review
. 2013:82:205-51.
doi: 10.1016/B978-0-12-407706-5.00003-4.

The malaria transition on the Arabian Peninsula: progress toward a malaria-free region between 1960-2010

Affiliations
Review

The malaria transition on the Arabian Peninsula: progress toward a malaria-free region between 1960-2010

Robert W Snow et al. Adv Parasitol. 2013.

Abstract

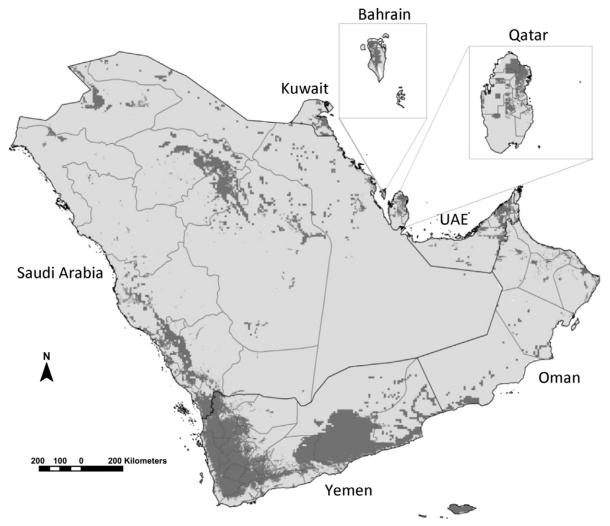
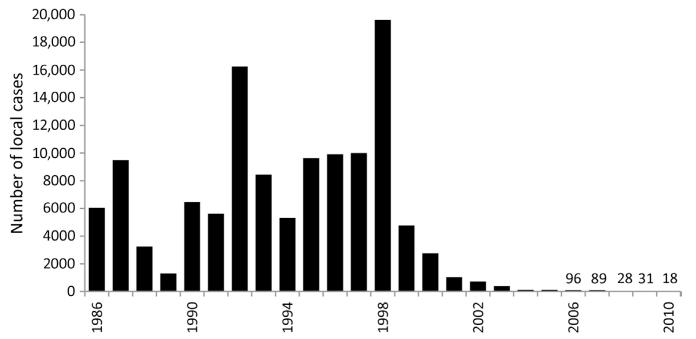
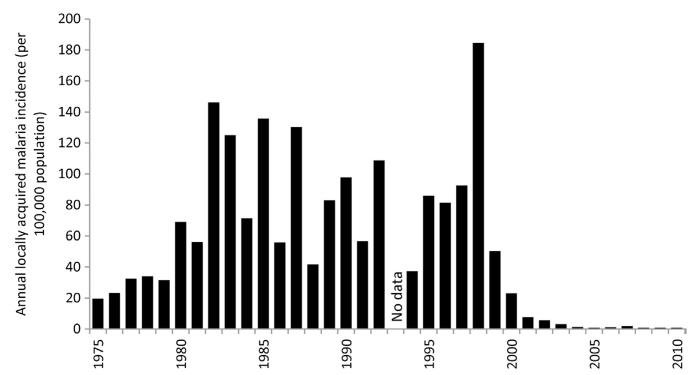
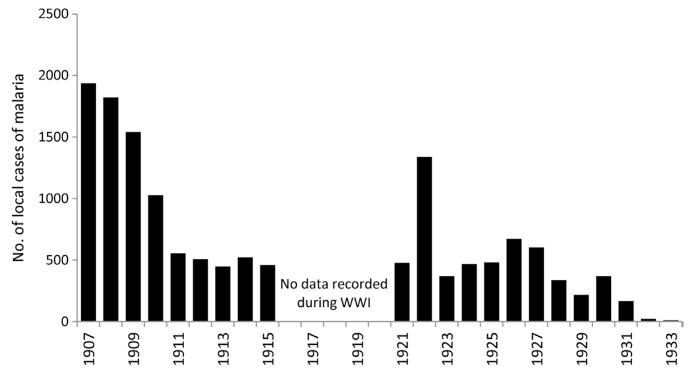
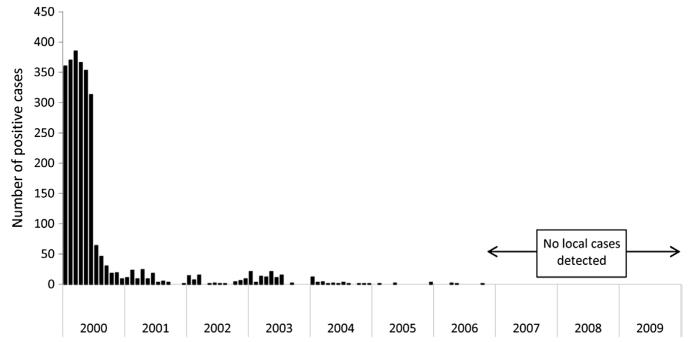
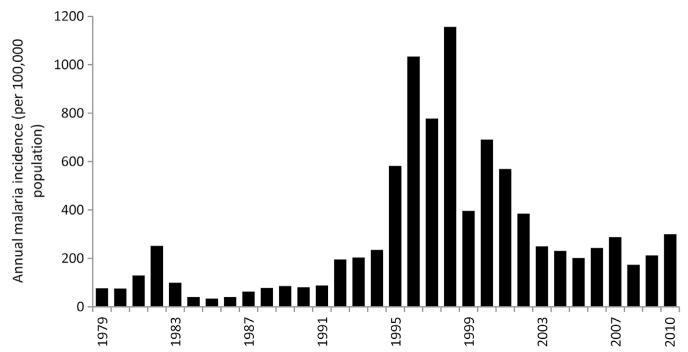
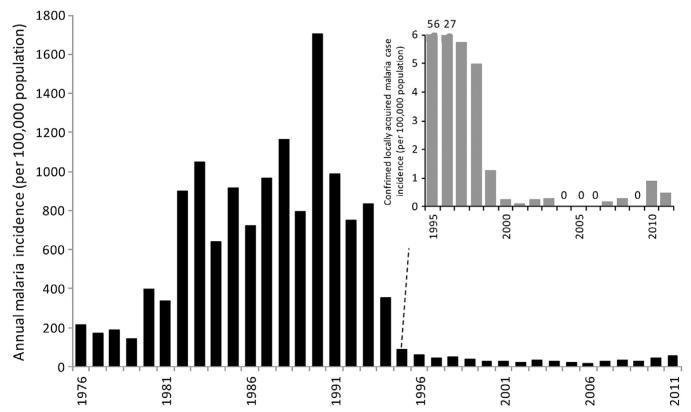
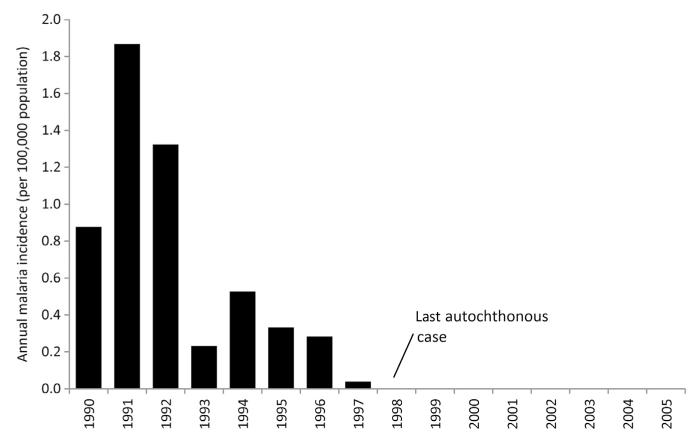
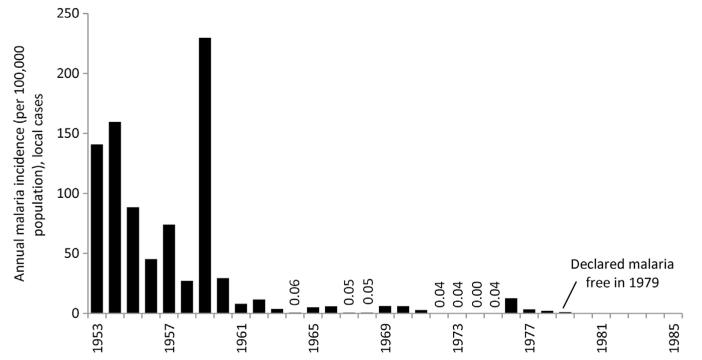
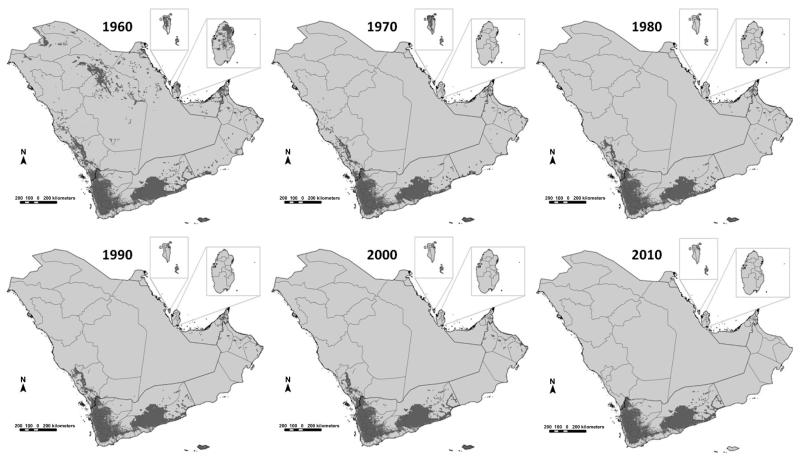
The transmission of malaria across the Arabian Peninsula is governed by the diversity of dominant vectors and extreme aridity. It is likely that where malaria transmission was historically possible it was intense and led to a high disease burden. Here, we review the speed of elimination, approaches taken, define the shrinking map of risk since 1960 and discuss the threats posed to a malaria-free Arabian Peninsula using the archive material, case data and published works. From as early as the 1940s, attempts were made to eliminate malaria on the peninsula but were met with varying degrees of success through to the 1970s; however, these did result in a shrinking of the margins of malaria transmission across the peninsula. Epidemics in the 1990s galvanised national malaria control programmes to reinvigorate control efforts. Before the launch of the recent global ambition for malaria eradication, countries on the Arabian Peninsula launched a collaborative malaria-free initiative in 2005. This initiative led a further shrinking of the malaria risk map and today locally acquired clinical cases of malaria are reported only in Saudi Arabia and Yemen, with the latter contributing to over 98% of the clinical burden.


Figures

Figure 3.1
Figure 3.1. Map showing the aridity and temperature masks that do not support malaria transmission (light grey) and areas able to support some degree of stable transmission (dark grey) on the Arabian Peninsula
Dark lines represent national boundaries; light grey lines represent sub-national provinces or governorates. Areas unsuitable for stable malaria transmission represented in light grey developed from temperature, aridity and population density masks. A temperature suitability index was used to provide a means to exclude the possibilities of transmission based on the average vector’s life-span, monthly ambient temperature and the duration of sporogony (Gething et al., 2011). For extreme aridity, the enhanced vegetation index (EVI) from 12 monthly surfaces has been used in previous global malaria risk maps to classify into areas unlikely to support transmission, areas without two or more consecutive months of an EVI >0.1 (Guerra et al., 2006; Guerra et al., 2008). The history database of the global environment (HYDE) population dataset provides a modelled projection of population distributions and densities at a 9 km × 9 km resolution for every decade (Goldewijik et al., 2010). The HYDE dataset uses national and sub-national population numbers from multiple, time-series sources and every historical source adjusted to match the current sub-national boundaries. Here, we have used a mask to identify those areas in 2000 with population density less than 1 person per 100 km2. These biological receptive limits are adjusted according to temporal information on elimination status, medical intelligence and reported case data for the years 1960, 1970, 1980, 1990, 2000 and 2010, as shown in Fig. 3.10.
Figure 3.2
Figure 3.2. Locally acquired, slide-confirmed cases of malaria in Jizan province 1986–2010
(Data provided in Anon, 1994 and by Dr Ahmed Sahli)
Figure 3.3
Figure 3.3. Annual incidence of slide-confirmed, locally acquired malaria cases between 1979 and 2010 in the Kingdom of Saudi Arabia per 100,000 population per annum
Reports of slide-confirmed, locally acquired cases used for 1975–1979 (Malaria Control Service Ministry of Health, 1980); 1990–2010 EMRO database. Population data have been sourced from several publications: 1992, 2004, 2007 and 2010 (Central Department of Statistics and Information, Kingdom of Saudi Arabia, 2011); 2009 (Saudi Arabian Monetary Agency, 2011). All other years have been estimated using intercensal growth rates.
Figure 3.4
Figure 3.4. Malaria admissions to Keith Falconer Mission Hospital, Sheikh Othman, Aden 1907–1933 (Phipson, 1933)
At the Mission Hospital, case incidence dropped from over 1900 cases in 1907 to 460 locally acquired cases by 1915 following environmental management and larviciding. During the First World War, the control of malaria was interrupted but resumed in 1922 with increasing success at mapping breeding sites in surrounding villages (including Dar-al-amir, Lahej and Halwan) and cases reported at the mission hospital declined to very low levels by 1933 (Phipson, 1933).
Figure 3.5
Figure 3.5. Monthly slide confirmed cases 2000–2010 on Socotra island (Anon, 2009)
According to the census in 2004, Socotra Island had a population of 43,000 people. 50% of the population live in two settlements, Hudaibo and Qalansia. The rest of the population live in scattered villages across three ecological zones: Coastal (0–400 m above sea level), foothills (400–700 m) and hills (above 700 m). Anopheles culicifacies is believed to be the major malaria vector in all geographical areas of the island. In September 2000, the Plan of Action for Malaria Control in Socotra was launched and implemented with funding from the government, Oman, Italy and WHO. Operational personnel included a director, team leaders in operations, supervision, malaria case management and health education, six supervisors and 37 spray-men. Larviciding with temephos across over 5000 mapped breeding sites began in 2001. Over 5000 ITN were distributed between 2002 and 2005. Between 2004 and 2008, 25,000–30,000 people were protected with bi-annual IRS using lambda-cyhalothrin (Kondrachine, 2009).
Figure 3.6
Figure 3.6. Annual presumed malaria case incidence between 1979 and 2010 per 100,000 population per annum across the combined territories that constitute the present day Republic of Yemen
(Data sourced from Anon (1981), Jamal Amran unpublished data (2006), Anon (2010) and EMRO Database (2012)). No distinction is made in the available reports between locally acquired/imported infections nor is it possible to define slide confirmed/presumptively treated for the entire surveillance period, and therefore cases included are regarded as presumed malaria diagnoses. However, by the mid-1980s, it is thought that reported cases were confirmed cases only. From the 1980s onwards, it is not possible to distinguish the slide-confirmed and presumptively treated malaria cases. The national malaria indicator survey in 2009 reported that only 56% of all fevers sought any form of treatment, and therefore it is additionally likely that many fever cases that are malaria go undetected (NMCP Yemen, 2009). Population has been estimated from several projections (Yemen Central Statistics Organization, 2010), combining YAR and PDYR estimates and based on the first census of the Republic in 1994 where nonreported years computed from intercensal growth rates, including pre-1994 census using the intercensal growth rate (2.91%).
Figure 3.7
Figure 3.7. Annual locally acquired, slide-confirmed malaria cases both locally acquired and imported in Oman 1976–2011 per 100,000 resident populations; insert shows only locally acquired notified case incidence 1995–2011
Before 1994, malaria was not a notifiable disease and imported versus locally acquired cases were not distinguished. The graph shows all slide-confirmed cases of malaria detected in the Sultanate of Oman between 1976 and 2011 as dark bars. Various authors and reports have assembled estimates of locally acquired slide-positivity rates from clinic records before 1994 including the periods 1976–1979 (Zahar et al., 1982), 1980–1985 (EMRO, 1987), 1986–1988 (WHO, 1989) and data 1988–1993 from the Omani MoH Statistics office (MoH Oman, 2009). Data for the period 1994–2011 are from the EMRO database. The insert is from 1995 to 2011 showing the incidence of only locally acquired cases all foci rapidly identified and EMRO regard Oman as malaria-free today. Population has been sourced from several publications: 1993–2002, 2004 and 2006–2010 (Sultanate of Oman Ministry of National Economy, 2012); 2003 (MoH, Oman, 2003) and 2011 (UN population projections, 2011). All population estimates prior to 1993 have been calculated using intercensal growth rates.
Figure 3.8
Figure 3.8. Annual, locally acquired case incidence per 100,000 population in the United Arab Emirates 1990–2005
Locally acquired case data provided by MoH-UAE (2002). The last case of locally acquired malaria was vivax and reported in 1997. UAE was certified malaria-free in 2007. Annual population estimates derived from UAE National Bureau of Statistics (2006) and all noncensus years have been estimated using intercensal growth rates.
Figure 3.9
Figure 3.9. Annual locally acquired malaria case incidence 1953–1990 in the Kingdom of Bahrain per 100,000 resident populations
(Data assembled from Amin (1989)). Bahrain was declared malaria-free in 1979. Population data sourced from census years between 1950 and 1985 (State of Bahrain Central Statistics Organization, 2002). Intercensal growth rates used to compute noncensus year population size.
Figure 3.10
Figure 3.10. Changing limits of malaria transmission 1960–2010 across the Arabian Peninsula showing the aridity and temperature masks that do not support malaria transmission or where malaria transmission has been eliminated (light grey) and areas able to support some degree of stable transmission (dark grey)
Temperature, aridity and population density masks are applied according to the rule outlined in text and legend to Fig. 3.1 and reflect the population density changes with time from 1960 to 2000 (Goldewijik et al., 2010). 1960: Kuwait: While the potential for transmission exists, there is no evidence that locally acquired infections have occurred in Kuwait and therefore regarded as malaria-free since 1960 (Hira et al., 1985; EMRO, 1990; Al-Kilidar, 1982). Yemen: During the 1940s, it was documented that local transmission was absent from the Aden Colony and the only cases detected were imported cases found on the ships entering the port or from surrounding areas (WHO-Aden, 1956). By 1980, Aden remained a town thought only to report cases of malaria acquired outside the limits of the town (MoPH, 1981). The city limits of Sana’a had experienced an epidemic in 1946 but have been regarded as malaria-free since the 1960s with most cases from low-lying areas outside the city. 1970: Saudi Arabia: The last case of autochthonous malaria was detected in the eastern region at Awwamiyah in 1973. By early late 1970s, active transmission in the north western areas was interrupted by the eradication of An. superpictus. All central areas were free of active transmission by before 1974. Qatar: Probably malaria-free from 1970 (Shidrawi, 1976). 1980: Saudi Arabia: By the 1980s, the north western regions were under active surveillance for the last foci and were largely malaria-free by early 1980s. Jazan city and Farasan Island were also reported malaria-free at this time (Farid et al., 1980; Anon, 1994). Oman: Muscat city limits were free from active transmission in 1980, respectively. In Dhofar, epidemiological surveys between 1983 and 1986 included slides taken from 15,418 individuals of whom only one was found positive (Delfini and Abdel-Majeed, 1993) and a survey of three areas in October 1987 among 1513 people found no one positive (Muiz, 1989). During the 1990s, the WHO regarded the border area with Yemen as malaria-free (Anon, 1993); however, sporadic epidemics from imported infections were reported in 1998 initiated by infected Somali immigrants (Baomar and Mohamed, 2000). While reasonable to presume that this area was malaria free in the 1990s, it does have a receptive risk making it vulnerable to imported infections. UAE: In 1976, there were no locally acquired cases in Dubai and all of the 2432 cases detected in Abu Dhabi Emirate were classified as imported in 1976 (Farid, 1977). In November 1996, no infant was found positive for malaria infection and a survey of 6–9 year-old school children identified 26 children with enlarged spleens and the three P. vivax slide positive cases had come from Oman and one P. falciparum case from Bangladesh (Farid, 1977). Al Ain, Dubai and Abu Dhabi were reported as malaria-free by 1980 (Farid, 1981). Bahrain: was reported as malaria-free in 1979. 1990: Saudi Arabia: The focal risks in 1990 were documented largely at Qunfudha and Al Lith sectors of Mecca province, Asir in the southern region and much of Jizan province (Farid, 1992). UAE: In 1990, there were a few dominant residual foci identified: Menaey, Lolya, Al Foa, Rashidia, Hili, Kattara, Khorfakkan, Dibbal Hisan, Medha and Masfoot, and these led to 18 cases of malaria in 1990. Oman: Risks only in most northerly coastal governorates. 2000: Saudi Arabia: Cases detected only in Asir, Quadanfun and Jizan provinces. Oman: By 2000, foci in the five most northerly provinces; UAE: Last locally acquired case detected in 1997 and by 2000 malaria-free. 2010: Saudi Arabia: By 2010, only 29 locally acquired cases were detected in the Kingdom with 11 from Asir resumed at southerly edge with Jizan province and 18 from Jizan at two localities close to Yemeni border, Kkauba and Samta (Al Zahrani, 2010). Yemen: The last reported case on Socotra Island was in 2005 and regarded malaria-free since this date. Oman: Foci detected between 2005 and 2011 in Dakhliya and north Batinah all rapidly controlled and Oman regarded as malaria-free by EMRO.

References

    1. Abdel-Hameed AA. Antimalarial drug resistance in the Eastern Mediterranean region. East. Mediterr. Health J. 2003;9:492–509. - PubMed
    1. Abdoon AMMO, Alshahrani AM. Prevalence and distribution of Anopheline mosquitoes in malaria endemic areas of Asia region, Saudi Arabia. East. Mediterr. Health J. 2003;9:240–247. - PubMed
    1. Afridi MK, Majid SA. Malaria in Bahrain Islands (Persian Gulf) J. Mal. Inst. India. 1938;1:428–452.
    1. Al Abdullalatif Z, Fontaine RE, Saeed AB, Al Hamdan N, Al Sagheer S. Malaria outbreak in Gellwa, Al Baha, Saudi Arabia, January to March 1996. Saudi Epidemiol. Bull. 1996;3:27–29.
    1. Al Tawfiq JA. Epidemiology of travel-related malaria in a non-malarious area in Saudi Arabia. Saudi Med. J. 2006;27:86–89. - PubMed

MeSH terms