. 2013 Apr;123(4):1662-76.
doi: 10.1172/JCI65538. Epub 2013 Mar 15.

Hepatic glucose sensing is required to preserve β cell glucose competence

Affiliations

Hepatic glucose sensing is required to preserve β cell glucose competence

Pascal Seyer et al. J Clin Invest. 2013 Apr.

Abstract

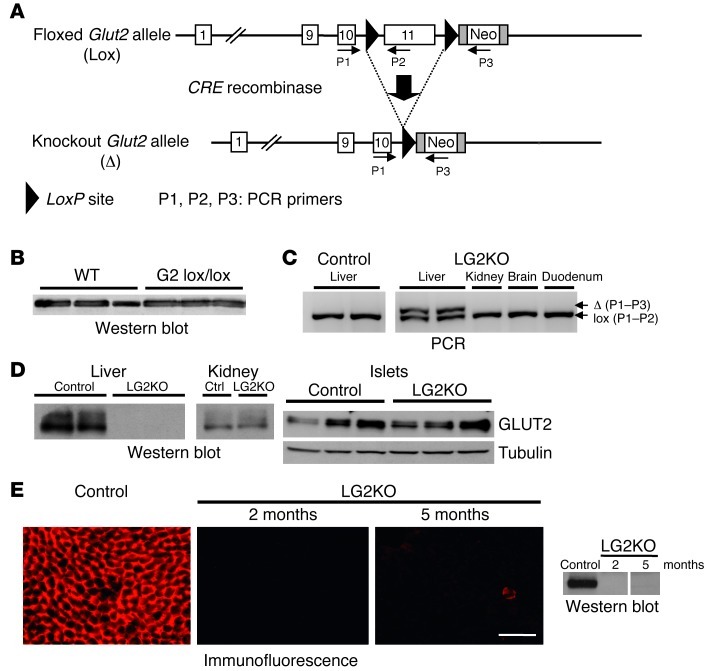
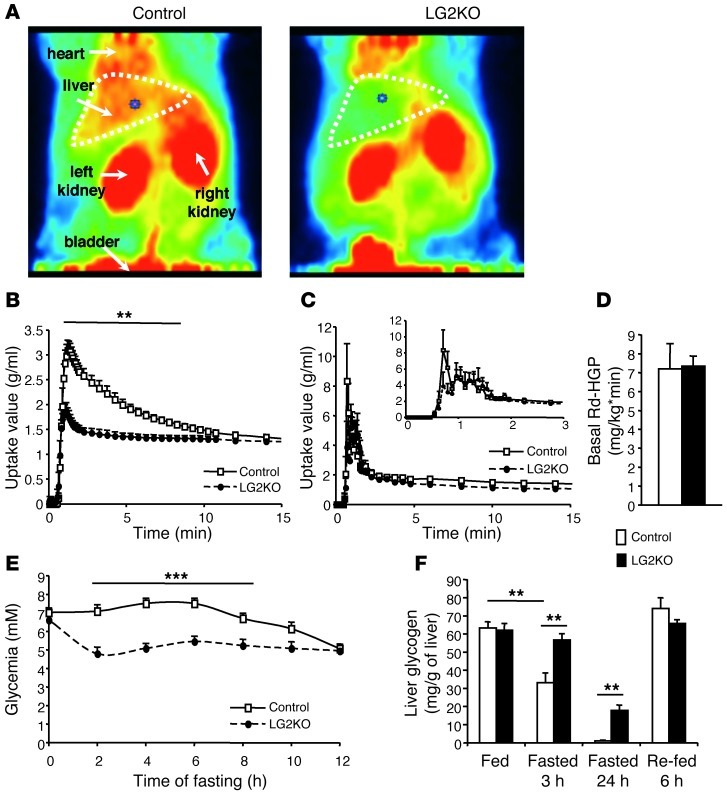
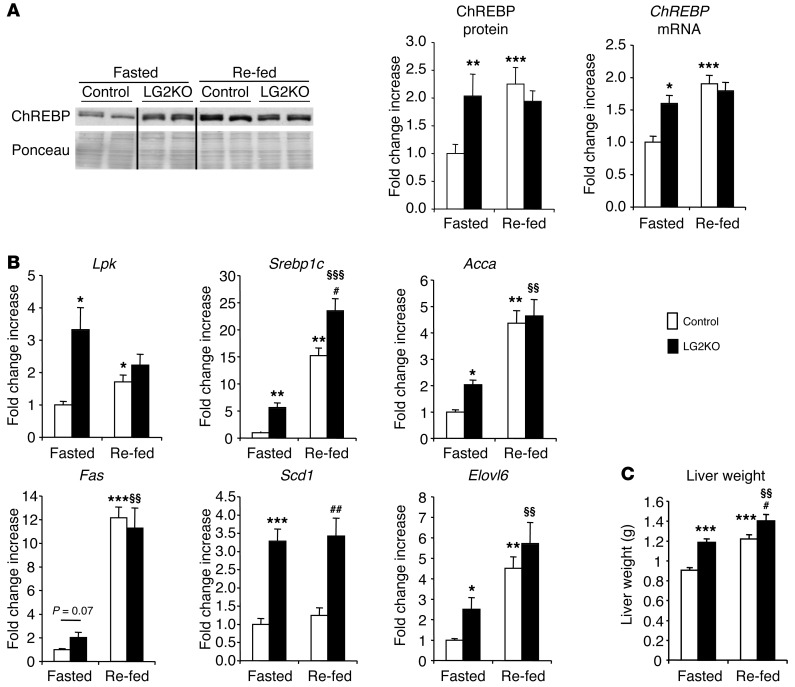
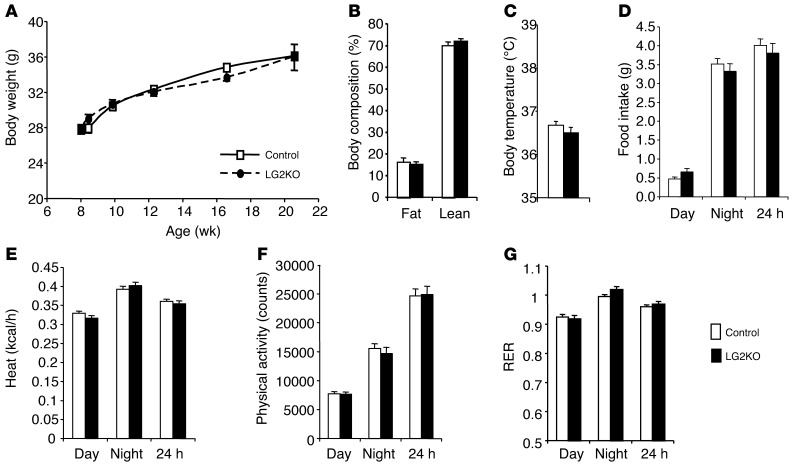
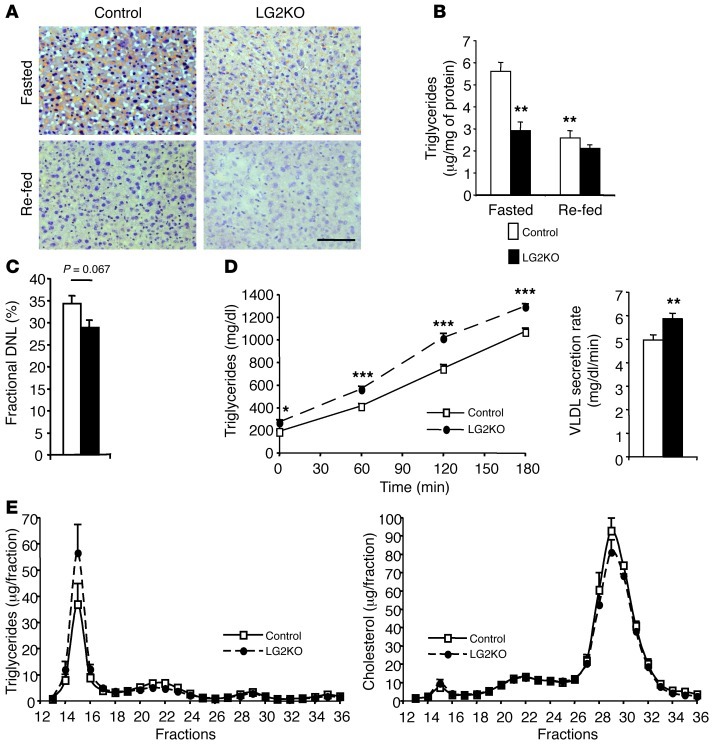
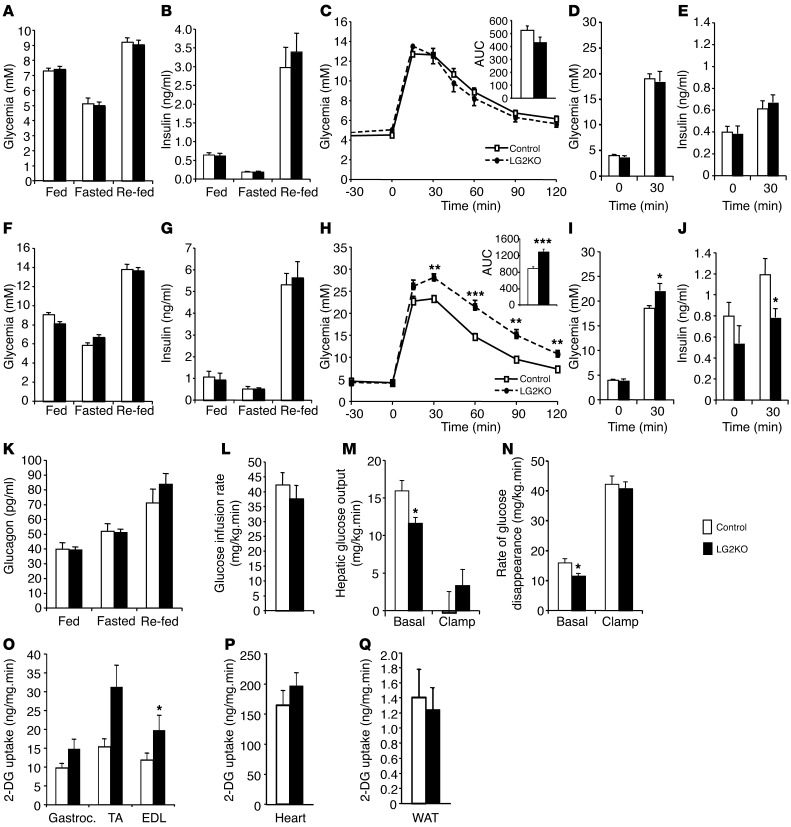
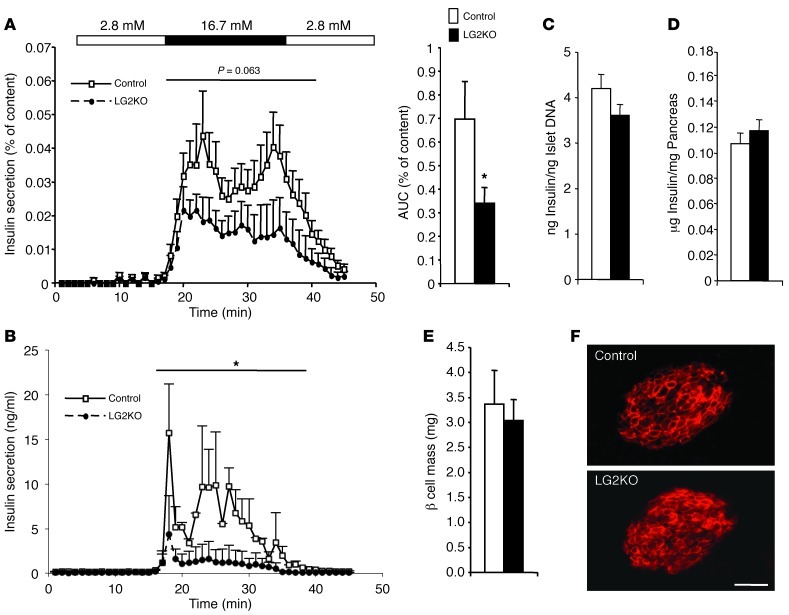
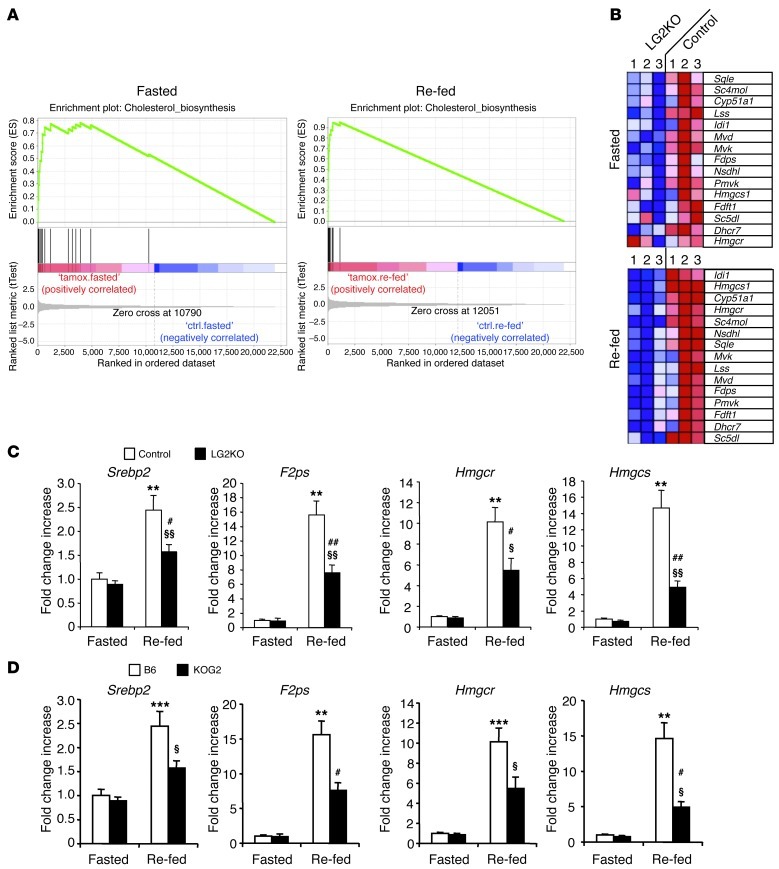
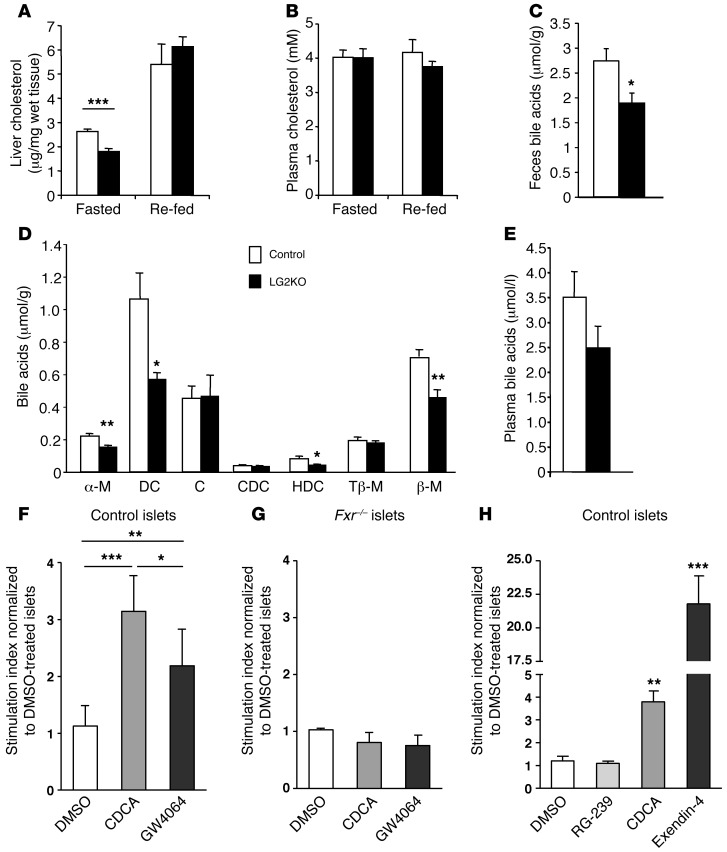
Liver glucose metabolism plays a central role in glucose homeostasis and may also regulate feeding and energy expenditure. Here we assessed the impact of glucose transporter 2 (Glut2) gene inactivation in adult mouse liver (LG2KO mice). Loss of Glut2 suppressed hepatic glucose uptake but not glucose output. In the fasted state, expression of carbohydrate-responsive element-binding protein (ChREBP) and its glycolytic and lipogenic target genes was abnormally elevated. Feeding, energy expenditure, and insulin sensitivity were identical in LG2KO and control mice. Glucose tolerance was initially normal after Glut2 inactivation, but LG2KO mice exhibited progressive impairment of glucose-stimulated insulin secretion even though β cell mass and insulin content remained normal. Liver transcript profiling revealed a coordinated downregulation of cholesterol biosynthesis genes in LG2KO mice that was associated with reduced hepatic cholesterol in fasted mice and reduced bile acids (BAs) in feces, with a similar trend in plasma. We showed that chronic BAs or farnesoid X receptor (FXR) agonist treatment of primary islets increases glucose-stimulated insulin secretion, an effect not seen in islets from Fxr(-/-) mice. Collectively, our data show that glucose sensing by the liver controls β cell glucose competence and suggest BAs as a potential mechanistic link.


Figures

Figure 1
Figure 1. Liver-specific inactivation of the Glut2 gene in adult mice.
(A) Structure of the Glut2 floxed and CRE recombined alleles, and localization of the primers used for genotyping. (B) Western blot analysis of GLUT2 expression in the liver of mice with wild-type (WT) or floxed (G2 lox/lox) Glut2 alleles. (C) PCR analysis revealed the presence of the recombined Glut2 allele in the liver of tamoxifen-treated Glut2lox/lox;SA-CREERT2 (LG2KO) mice; no recombination was found in the kidney, brain, or duodenum of these same mice, nor in the liver of oil-treated Glut2lox/lox;SA-CREERT2 (Control) mice. (D) Western blot analysis of GLUT2 expression in liver, kidney, and pancreatic islets of control and LG2KO mice. (E) Immunofluorescence and Western blot detection of GLUT2 in the liver of control and LG2KO mice 2 and 5 months after tamoxifen treatment. A vertical line separates nonadjacent lanes from the same blot. Scale bar: 50 μm.
Figure 2
Figure 2. Absence of liver GLUT2 expression suppresses hepatic glucose uptake but does not impair endogenous glucose production.
(A) PET imaging of 18FDG uptake by the liver and kidneys of control and LG2KO mice during the first 15 minutes after injection (dorsal view; red, high uptake; green, low uptake). (B) Kinetics of 18FDG uptake by the liver of control (white squares, n = 6) and LG2KO (black circles, n = 8) mice. Note the suppression of 18FDG uptake between 1 minute and 9 minutes after injection in the liver of LG2KO mice. **P < 0.01 versus control mice. (C) Time-activity curve of 18FDG uptake in the blood of control (white squares, n = 6) and LG2KO (black circles, n = 8) mice acquired by imaging the inferior vena cava. Inset shows expanded view of the same graph from 0 to 3 minutes after tracer injection. (D) Endogenous glucose production by control and LG2KO mice (n = 10). (E) Evolution of blood glucose levels in fasted control and LG2KO mice (n = 9). ***P < 0.001 versus control mice. (F) Evolution of hepatic glycogen content in control and LG2KO mice in the indicated states (n = 5). **P < 0.01. Rd, rate of glucose disappearance; HGO, hepatic glucose output.
Figure 3
Figure 3. Abnormal regulation of glucose-sensitive genes in the livers of LG2KO mice.
(A) Western blot analysis of ChREBP protein levels in nuclear fractions from the livers of 24-hour–fasted mice (Fasted) and mice re-fed for 6 hours after the end of the 24 hours of fasting (Re-fed). Vertical lines separate nonadjacent lanes from the same blot (left). Quantification of ChREBP protein levels in nuclear fraction, and ChREBP mRNA levels in the liver of fasted and re-fed control and LG2KO mice (n = 6) (right). (B) Levels of expression of the indicated metabolic gene mRNA in the livers of fasted and re-fed control and LG2KO mice (n = 6). (C) Liver weight in fasted and re-fed control and LG2KO mice (n = 12). Data represent the mean ± SEM. *P < 0.05; **P < 0.01; and ***P < 0.001 versus control fasted mice. §§P < 0.01 and §§§P < 0.001 versus LG2KO fasted mice. #P < 0.05 and ##P < 0.01 versus control re-fed mice.
Figure 4
Figure 4. Normal energy homeostasis in LG2KO mice.
(A) Body weight. (B) Body composition measured by echo MRI. (C) Body temperature. (D) Food intake. (E) Heat production. (F) Physical activity. (G) RER. Data represent the mean ± SEM (n = 6–8).
Figure 5
Figure 5. Impaired lipid metabolism in LG2KO mice.
(A) Oil red O staining of liver sections from fasted and re-fed control or LG2KO mice. Scale bar: 50 μm. (B) Quantification of TG storage in the liver of control and LG2KO mice. **P < 0.01 versus control fasted mice. (C) Fractional de novo lipogenesis measured over a 24-hour period. (D) VLDL secretion rates from overnight-fasted control and LG2KO mice. Secreted TG at the indicated time points after tyloxapol injection for control and LG2KO mice (left); rate of TG secretion derived from the left graph (right). *P < 0.05; **P < 0.01; and ***P < 0.001 versus control. (E) Triglycerides (left) and cholesterol (right) contents of FPLC-fractionated plasma from 24-hour–fasted control and LG2KO mice. Data represent the mean ± SEM (n = 6–8).
Figure 6
Figure 6. Progressive development of glucose intolerance in LG2KO mice.
(AC) Five days after the end of tamoxifen treatment, glycemia (A), insulinemia (B), and i.p. glucose tolerance (C) were identical in control and LG2KO mice (n = 12). (D) Glycemia and (E) insulinemia at the indicated time after an i.p. injection of glucose. (FH) Four months after tamoxifen treatment, glycemia (F) and insulinemia (G) were not different in control and LG2KO mice (n = 12). (H) Glucose intolerance became evident following i.p. glucose injection (n = 12). (I) Glycemia and (J) insulinemia at the indicated time after an i.p. injection of glucose. (K) Glucagonemia (n = 6). For A, B, F, G, and K, fasting was for 24 hours and re-feeding was for 6 hours after 24 hours of fasting. Fed mice were studied at the end of the dark period. (L) Insulin sensitivity assessed by the glucose infusion rate in hyperinsulinemic and euglycemic clamp experiments. (M) HGO before insulin infusion (Basal) and during the insulin clamp (Clamp). (N) Rate of glucose disappearance before (Basal) and during the insulin clamp (Clamp). 2-DG uptake in gastrocnemius (Gastroc.), TA, and EDL muscles (O) in heart (P) and in perigonadal fat (WAT) (Q) during the insulin clamp (n = 7). *P < 0.05; **P < 0.01; and ***P < 0.001 versus control.
Figure 7
Figure 7. Reduced insulin secretory capacity in islets from LG2KO mice.
(A) Four months after tamoxifen treatment, islets were isolated from control and LG2KO mice and insulin secretion was tested in perifusion experiments using the indicated glucose concentrations. AUC of the insulin secretion activity is represented on the right (n = 7). For AUC: Student’s t test, *P < 0.05 versus control. (B) Pancreas perfusion experiments revealed a reduced secretory capacity of the endocrine pancreas of LG2KO mice (n = 4). A and B (insulin secretion graphs): 2-way ANOVA, *P < 0.05 versus control mice. (C) Insulin per islet DNA (n = 7). (D) Pancreatic insulin content (n = 6), and (E) β cell mass in control and LG2KO mice (n = 4). (F) Immunofluorescence detection of GLUT2 in control and LG2KO pancreatic islets. Scale bar: 30 μm.
Figure 8
Figure 8. GSEA reveals a decreased expression of cholesterol biosynthesis genes in fasted and re-fed states.
Fasting was for 24 hours and re-feeding was for 6 hours after 24 hours of fasting. (A) GSEA of microarray data from fasted and re-fed control and LG2KO mice reveal enrichment in cholesterol biosynthesis genes in both conditions. (B) Heat map representing the level of expression of genes in the leading edge of the cholesterol biosynthesis gene set (official gene symbols are used). Expression level increases from blue to red. (C) qRT-PCR analysis of the expression of the indicated cholesterol biosynthesis genes in livers of fasted and re-fed control and LG2KO mice. **P < 0.01 versus control fasted mice. §P < 0.05 and §§P < 0.01 versus LG2KO fasted mice. #P < 0.05 and ##P < 0.01 versus control re-fed mice (n = 6). (D) Expression levels of the indicated cholesterol biosynthesis genes in livers of fasted and re-fed C57Bl/6 mice (B6) and mice with constitutive Glut2 knockout (Ripglut1;Glut2–/– mice backcrossed on a B6 background, KOG2). **P < 0.01 and ***P < 0.001 versus B6 fasted mice. §P < 0.05 versus KOG2 fasted mice. #P < 0.05 versus B6 re-fed mice (n = 6).
Figure 9
Figure 9. Reduced cholesterol and BA levels in LG2KO mice and potentiation of insulin secretion by BAs.
(A) Liver cholesterol content and (B) plasma cholesterol in fasted and re-fed control and LG2KO mice (n = 6). (C) BA content in feces of control and LG2KO mice collected over a 24-hour period (n = 7). (D) Composition of the fecal BAs: α-murocholic acid (α-M); deoxycholic acid (DC); cholic acid (C); chenodeoxycholic acid (CDC); hyodeoxycholic acid (HDC); tauro-β-murocholic acid (Tβ-M); and β-murocholic acid (β-M) (n = 7). (E) Total plasma BAs in the fasted state (n = 6). AE: *P < 0.05; **P < 0.01; and ***P < 0.001 versus control. (F) Twenty-four-hour pretreatment of control islets with chenodeoxycholic acid (CDCA, 50 μM), or the FXR agonist GW4064 (1 μM) increases glucose-stimulated insulin secretion. DMSO: vehicle. (G) No potentiation of glucose-stimulated insulin secretion by FXR agonists in Fxr–/– islets. (H) One-hour glucose-stimulated insulin secretion by control islets performed in the presence of, and after a 48-hour treatment with, TGR5 (RG-239), FXR (CDCA), or GLP-1 receptor (exendin-4 [Ex4]) agonists. FH: Pool of 5 different experiments. One-way ANOVA and post-hoc Tukey’s test: *P < 0.05; **P < 0.01; and ***P < 0.001. In H, statistical significance is calculated versus DMSO-treated islets.

Similar articles

Cited by

References

    1. Postic C, Girard J. Contribution of de novo fatty acid synthesis to hepatic steatosis and insulin resistance: lessons from genetically engineered mice. J Clin Invest. 2008;118(3):829–838. doi: 10.1172/JCI34275. - DOI - PMC - PubMed
    1. Carabaza A, Ciudad CJ, Baque S, Guinovart JJ. Glucose has to be phosphorylated to activate glycogen synthase, but not to inactivate glycogen phosphorylase in hepatocytes. FEBS Lett. 1992;296(2):211–214. doi: 10.1016/0014-5793(92)80381-P. - DOI - PubMed
    1. Foufelle F, Ferre P. New perspectives in the regulation of hepatic glycolytic and lipogenic genes by insulin and glucose: a role for the transcription factor sterol regulatory element binding protein-1c. Biochem J. 2002;366(pt 2):377–391. doi: 10.1042/BJ20020430. - DOI - PMC - PubMed
    1. Guillam MT, Burcelin R, Thorens B. Normal hepatic glucose production in the absence of GLUT2 reveals an alternative pathway for glucose release from hepatocytes. Proc Natl Acad Sci U S A. 1998;95(21):12317–12321. doi: 10.1073/pnas.95.21.12317. - DOI - PMC - PubMed
    1. Burcelin R, del Carmen Muñoz M, Guillam MT, Thorens B. Liver hyperplasia and paradoxical regulation of glycogen metabolism and glucose-sensitive gene expression in GLUT2-null hepatocytes. Further evidence for the existence of a membrane-based glucose release pathway. J Biol Chem. 2000;275(15):10930–10936. doi: 10.1074/jbc.275.15.10930. - DOI - PubMed

Publication types

MeSH terms

Associated data