Review
. 2013 Apr;60(4):685-701.
doi: 10.1109/TUFFC.2013.2617.

Acoustic radiation force elasticity imaging in diagnostic ultrasound

Affiliations
Review

Acoustic radiation force elasticity imaging in diagnostic ultrasound

Joshua R Doherty et al. IEEE Trans Ultrason Ferroelectr Freq Control. 2013 Apr.

Abstract

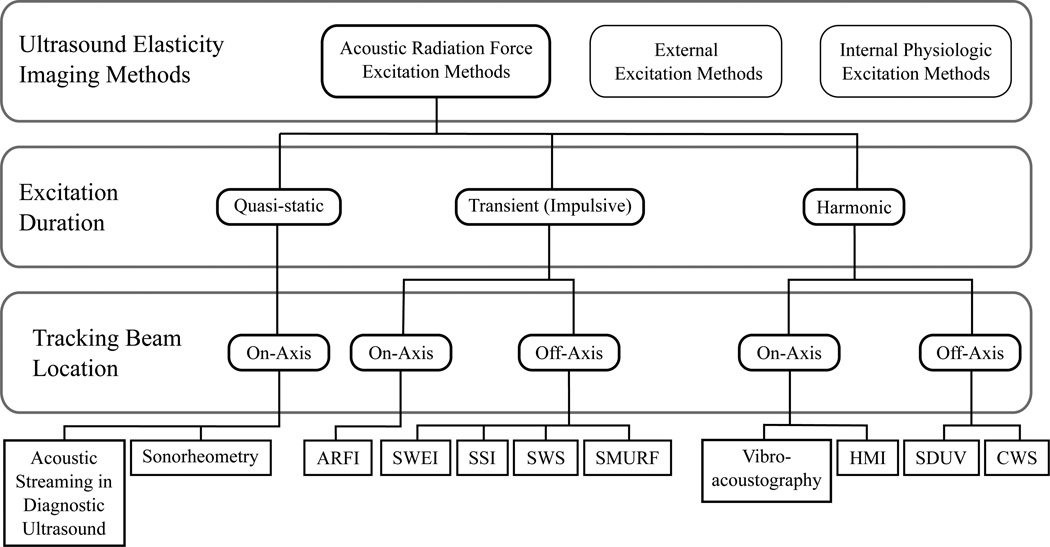
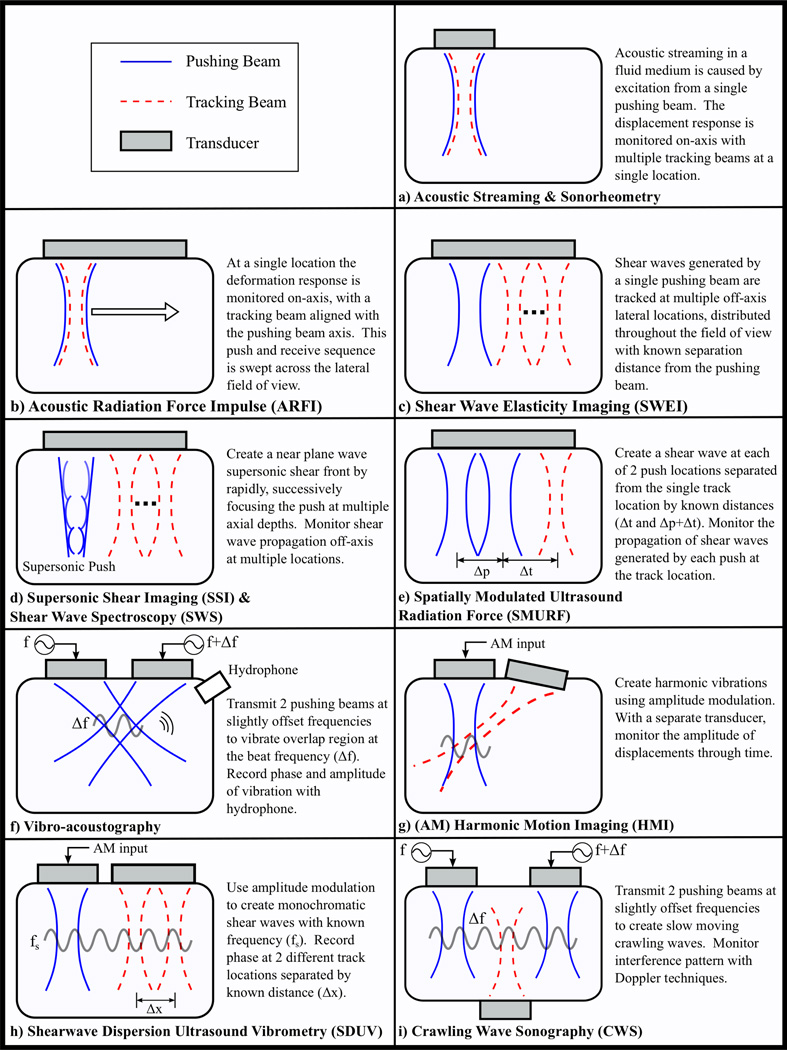
The development of ultrasound-based elasticity imaging methods has been the focus of intense research activity since the mid-1990s. In characterizing the mechanical properties of soft tissues, these techniques image an entirely new subset of tissue properties that cannot be derived with conventional ultrasound techniques. Clinically, tissue elasticity is known to be associated with pathological condition and with the ability to image these features in vivo; elasticity imaging methods may prove to be invaluable tools for the diagnosis and/or monitoring of disease. This review focuses on ultrasound-based elasticity imaging methods that generate an acoustic radiation force to induce tissue displacements. These methods can be performed noninvasively during routine exams to provide either qualitative or quantitative metrics of tissue elasticity. A brief overview of soft tissue mechanics relevant to elasticity imaging is provided, including a derivation of acoustic radiation force, and an overview of the various acoustic radiation force elasticity imaging methods.


Figures

Fig. 1
Fig. 1
General concept of ARF based elasticity imaging methods. 1) A focused ultrasound transducer is used to generate sufficient acoustic radiation force to cause localized tissue displacements. 2) The resulting deformation is monitored using the same or a separate remote device.
Fig. 2
Fig. 2
Brief overview depicting an arbitrary, yet physically realizable, restoring stress (σ⃗) and associated strain (ε⃗) that develops in an infinitesimal volume of a material body when an external force (f⃗) is applied. a) The restoring stress (σ⃗) satisfies equilibrium, according to (1), when an external force (f⃗) is applied to the body. b) The resulting deformation can be described by the displacement field (u⃗) related to the position of the infinitesimal volume in the reference (X⃗) and deformed (X⃗ ′) configurations. c) The associated strain (ε⃗) also describes the deformation and is related to the displacement (u⃗) according to (2). Here, the deformation is portrayed in 3 different orientations to illustrate both normal strains (ε11, ε22, and ε33) in the top and side views and shear strains (ε12 and ε21) in the front view.
Fig. 3
Fig. 3
FEM simulated response in a 3-D, homogeneous, isotropic, linear, elastic solid (E = 10 kPa) depicting the axial displacements from an impulsive 45 µs, F/1.3, 6.7 MHz acoustic radiation force excitation. The axial displacements depicted at 3 different time steps following excitation in (a) through (c) show the propagation of shear waves away from the ROE. The displacement through time profiles depicted in (d) show the axial displacements occurring at the focal depth for each of 3 separate lateral locations, located both on-axis (pink X) and off-axis (red circle and green square). These profiles reflect the decreased displacement amplitude with increased distance from the ROE due to geometric spreading.
Fig. 4
Fig. 4
FEM simulated response depicting the axial displacements from an impulsive 45 µs, F/1.3, 6.7 MHz acoustic radiation force excitation in a 3-D linear, isotropic, elastic solid consisting of a stiffer material (E = 10 kPa) centered between two softer materials (E = 2 kPa). The material boundaries are indicated by the white dashed lines in (a) through (c), which depict the axial displacements at 3 distinct times following excitation. In (b) the shear waves have not reached the layer boundaries and only the initial shear waves propagating from the ROE are observed. In (c), just after the shear waves reached the center material boundary, the reflected and transmitted waves are depicted. Displacement through time profiles in (d) show multiple distinct peaks indicative of both the incident shear waves along with the reflected shear waves introduced by the material boundaries.
Fig. 5
Fig. 5
Ultrasound-based elasticity imaging methods can be categorized by the excitation source used to deform soft tissue. As presented herein, Acoustic Radiation Force methods can be further classified according to the duration of the applied acoustic radiation force excitation and the location of tracking beams used to monitor the deformation response. These methods include: Acoustic Streaming in Diagnostic Ultrasound [32, 33], Sonorheometry [34], Acoustic Radiation Force Impulse (ARFI) Imaging [35, 36], Shear Wave Elasticity Imaging (SWEI) [37], Supersonic Shear Imaging (SSI) [38], Shear Wave Spectroscopy (SWS) [39], Spatially Modulated Ultrasound Radiation Force (SMURF) [40], Vibro-acoustography [41, 42], Harmonic Motion Imaging (HMI) [43], Shear Wave Ultrasound Dispersion Ultrasound Vibrometry (SDUV) [44], and Crawling Wave Spectroscopy (CWS) [45].
Fig. 6
Fig. 6
Overview of Acoustic Radiation Force elasticity imaging methods in diagnostic ultrasound.
Fig. 7
Fig. 7
Sonorheometry: Images portray a decrease in the force-free parameter (τ) indicative of blood stiffening with increasing time after the blood is withdrawn in three test subjects. The horizontal axis represents the axial depth within the cuvet containing the blood samples. In Subject 3, who had a history of a blood clotting disorder, the rate of stiffening is much greater than in Subject 1 and Subject 2. Image is modified from [34].
Fig. 8
Fig. 8
ARFI: Comparing (a) B-mode and (b) ARFI in vivo images of a hepatocellular carcinoma (HCC) in a human liver. The overlaid ARFI grayscale represents normalized displacements, and indicates that the HCC displaced farther than the surrounding cirrhotic liver tissue. While HCC’s are known to be stiffer than normal liver (and would thus be expected to appear darker in an ARFI image), this patient was diagnosed with cirrhosis, which is associated with increased tissue stiffness. Image modified from [58].
Fig. 9
Fig. 9
SSI: Matched (a) elastographic and (b) B-mode in vivo images of an oval breast mass. The heterogeneously stiff breast mass and surrounding tissue are suspicious findings in the elastography image for the biopsy proven grade III invasive ductal carcinoma. Image is modified from [99].

References

    1. Adams F. The Genuine Works of Hippocrates. William Wood and Company; 1891.
    1. Tohno E, Cosgrove DO, Sloane JP. Ultrasound diagnosis of breast diseases. New York: Churchill Livingstone Inc.; 1994.
    1. Wolfe JN. Xeroradiography of the breast. Springfield, IL: Thomas; 1972.
    1. Bassett L, Gold R, Kimme-Smith C. Hand-held and automated breast ultrasound. Thorafore, NJ: Slack Inc.; 1986.
    1. Donegan WL, Spratt JS. Cancer of the breast. Philadelphia: Suanders; 2002.

Publication types

MeSH terms